Home > Comparison > Technology > TER vs NDSN
The strategic rivalry between Teradyne, Inc. and Nordson Corporation shapes key dynamics across technology and industrial sectors. Teradyne dominates as a semiconductor test equipment innovator, while Nordson excels in precision fluid dispensing machinery. This head-to-head contrasts high-tech automation against industrial manufacturing expertise. My analysis will clarify which firm’s operational model offers superior risk-adjusted returns, guiding investors aiming to balance portfolio growth and stability within evolving market cycles.
Table of contents
Companies Overview
Teradyne, Inc. and Nordson Corporation stand as key players in their respective technology and industrial machinery markets.
Teradyne, Inc.: Semiconductor and Automation Test Leader
Teradyne dominates the semiconductor test equipment market, generating revenue by designing and selling automated test solutions globally. Its 2026 focus spans Semiconductor Test, Industrial Automation, System Test, and Wireless Test segments, catering to chipmakers and electronics manufacturers. Teradyne’s edge lies in advanced testing platforms and robotic automation tailored for evolving semiconductor and wireless device demands.
Nordson Corporation: Precision Fluid Dispensing Innovator
Nordson specializes in dispensing and coating systems for adhesives, polymers, and fluids across industrial and medical sectors. Revenues come from Industrial Precision Solutions and Advanced Technology Solutions units. The company emphasizes automated dispensing and surface treatment technologies in 2026, serving packaging, electronics, and medical device industries with precision engineering and fluid control expertise.
Strategic Collision: Similarities & Divergences
Teradyne pursues a high-tech, automation-driven semiconductor ecosystem, while Nordson focuses on precision fluid applications in diverse industrial niches. Their competitive battleground overlaps in manufacturing process optimization, yet Teradyne targets semiconductor innovation, and Nordson advances materials application and surface treatment. These differences shape distinct risk-return profiles: Teradyne’s growth hinges on semiconductor cycles, Nordson’s stability on industrial demand and innovation in fluid dispensing.
Income Statement Comparison
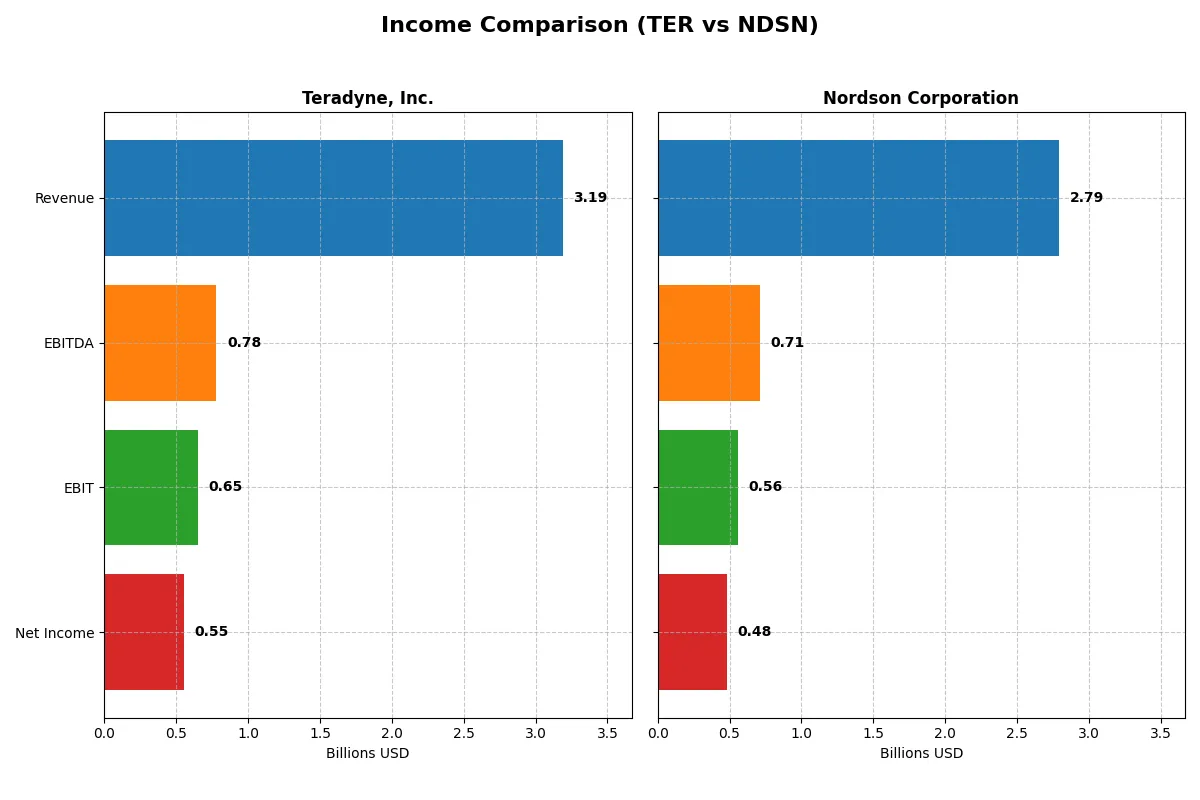
This data dissects the core profitability and scalability of both corporate engines to reveal who dominates the bottom line:
| Metric | Teradyne, Inc. (TER) | Nordson Corporation (NDSN) |
|---|---|---|
| Revenue | 3.19B | 2.79B |
| Cost of Revenue | 1.32B | 1.25B |
| Operating Expenses | 1.17B | 828M |
| Gross Profit | 1.87B | 1.54B |
| EBITDA | 780M | 712M |
| EBIT | 653M | 561M |
| Interest Expense | 8.0M | 101M |
| Net Income | 554M | 484M |
| EPS | 3.49 | 8.56 |
| Fiscal Year | 2025 | 2025 |
Income Statement Analysis: The Bottom-Line Duel
This income statement comparison reveals which company deploys its resources more effectively to generate profit and sustain growth.
Teradyne, Inc. Analysis
Teradyne’s revenue showed volatility, peaking at 3.7B in 2021 and dipping to 3.2B in 2025. Net income dropped sharply from 1B in 2021 to 554M in 2025, reflecting margin compression. Its gross margin remains strong at 58.55%, and the 2025 EBIT margin of 20.48% indicates solid operational efficiency despite a recent net margin decline to 17.37%.
Nordson Corporation Analysis
Nordson delivered steady revenue growth, rising from 2.36B in 2021 to 2.79B in 2025. Net income improved modestly to 484M, with a stable net margin of 17.35%. Its gross margin of 55.16% and EBIT margin of 20.1% in 2025 demonstrate consistent profitability, though EBIT contracted 16.8% last year, signaling margin pressure.
Steady Growth vs. Margin Resilience
Teradyne boasts superior gross and EBIT margins with strong operational leverage but faces declining net income and revenue volatility. Nordson grows revenue steadily with stable net margins but shows recent EBIT weakness. For investors, Teradyne’s margin power offers efficiency, while Nordson’s profile suggests steadier top-line expansion.
Financial Ratios Comparison
These vital ratios act as a diagnostic tool to expose the underlying fiscal health, valuation premiums, and capital efficiency of the companies compared below:
| Ratios | Teradyne, Inc. (TER) | Nordson Corporation (NDSN) |
|---|---|---|
| ROE | 19.2% | 15.9% |
| ROIC | 17.2% | 10.5% |
| P/E | 36.9 | 27.1 |
| P/B | 7.1 | 4.3 |
| Current Ratio | 2.91 | 1.64 |
| Quick Ratio | 1.84 | 1.05 |
| D/E | 0.03 | 0.69 |
| Debt-to-Assets | 2.1% | 35.4% |
| Interest Coverage | 166x | 7.0x |
| Asset Turnover | 0.76 | 0.47 |
| Fixed Asset Turnover | 4.88 | 4.70 |
| Payout ratio | 14.1% | 37.0% |
| Dividend yield | 0.38% | 1.36% |
| Fiscal Year | 2024 | 2025 |
Efficiency & Valuation Duel: The Vital Signs
Ratios serve as the company’s DNA, uncovering hidden risks and operational strengths beyond surface-level financials.
Teradyne, Inc.
Teradyne delivers robust profitability with a 19.24% ROE and a strong 19.23% net margin, signaling operational excellence. However, its valuation appears stretched with a high 36.93 P/E and 7.11 P/B ratio. The company returns modest dividends at 0.38%, favoring reinvestment into R&D for sustained growth and innovation.
Nordson Corporation
Nordson posts solid profitability with a 15.92% ROE and a 17.35% net margin but trades at a lower multiple with a 27.1 P/E and 4.31 P/B. Its dividend yield of 1.36% offers reasonable income, balancing shareholder returns with a slightly conservative capital structure and moderate reinvestment in R&D.
Premium Valuation vs. Operational Safety
Teradyne commands a premium valuation driven by superior profitability and reinvestment focus but carries higher valuation risk. Nordson offers a more balanced risk-reward profile with solid margins and higher dividend yield. Growth-oriented investors may prefer Teradyne, while income-focused investors might find Nordson more suitable.
Which one offers the Superior Shareholder Reward?
Teradyne, Inc. (TER) pays a modest 0.38% dividend yield with a low 14% payout ratio, heavily supported by free cash flow (FCF coverage ~70%). Its buyback program is moderate, balancing growth and shareholder returns sustainably. Nordson Corporation (NDSN) offers a higher 1.36% dividend yield with a 37% payout ratio, supported by robust FCF coverage (~92%) and a more aggressive buyback. However, NDSN’s higher leverage (debt-to-equity ~0.69) raises risk. I find Teradyne’s conservative distribution and strong cash flow generation more sustainable for long-term value. For 2026, I favor TER’s balanced approach, offering steadier total returns with prudent capital allocation.
Comparative Score Analysis: The Strategic Profile
The radar chart reveals the fundamental DNA and trade-offs of both firms, highlighting their core financial strengths and valuation differences:
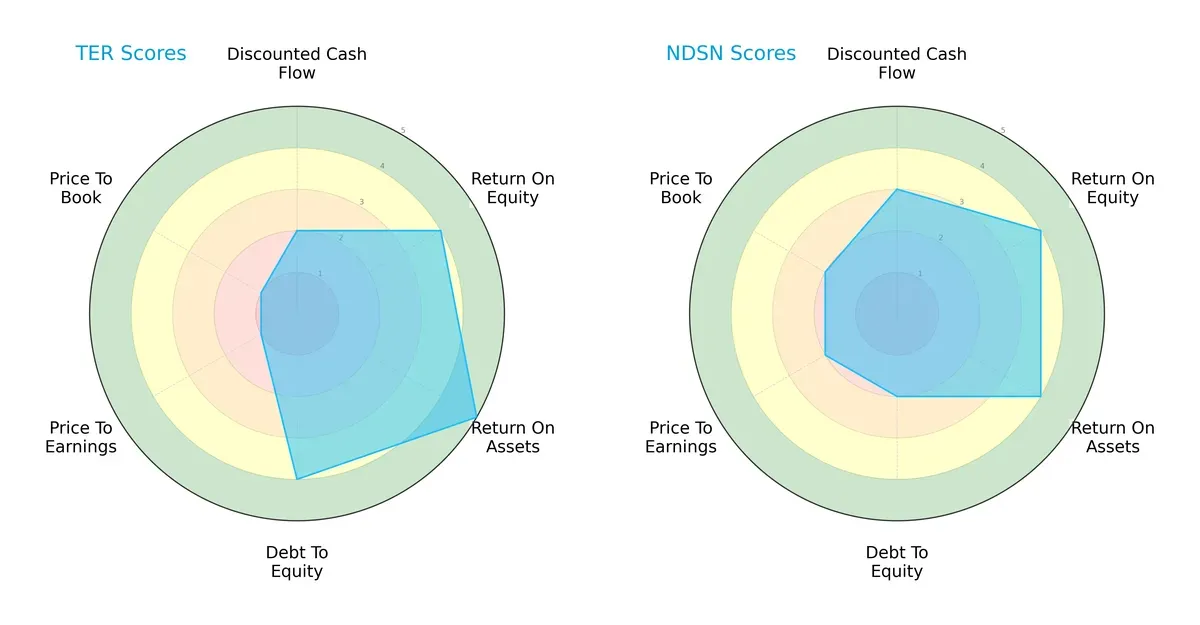
Teradyne, Inc. excels in asset utilization (ROA score 5) and maintains a stronger debt position (Debt/Equity score 4) compared to Nordson Corporation. Nordson shows a more balanced valuation profile with moderate P/E and P/B scores (2 each) but carries higher leverage risk (Debt/Equity score 2). Teradyne leans heavily on operational efficiency, while Nordson balances growth with valuation discipline.
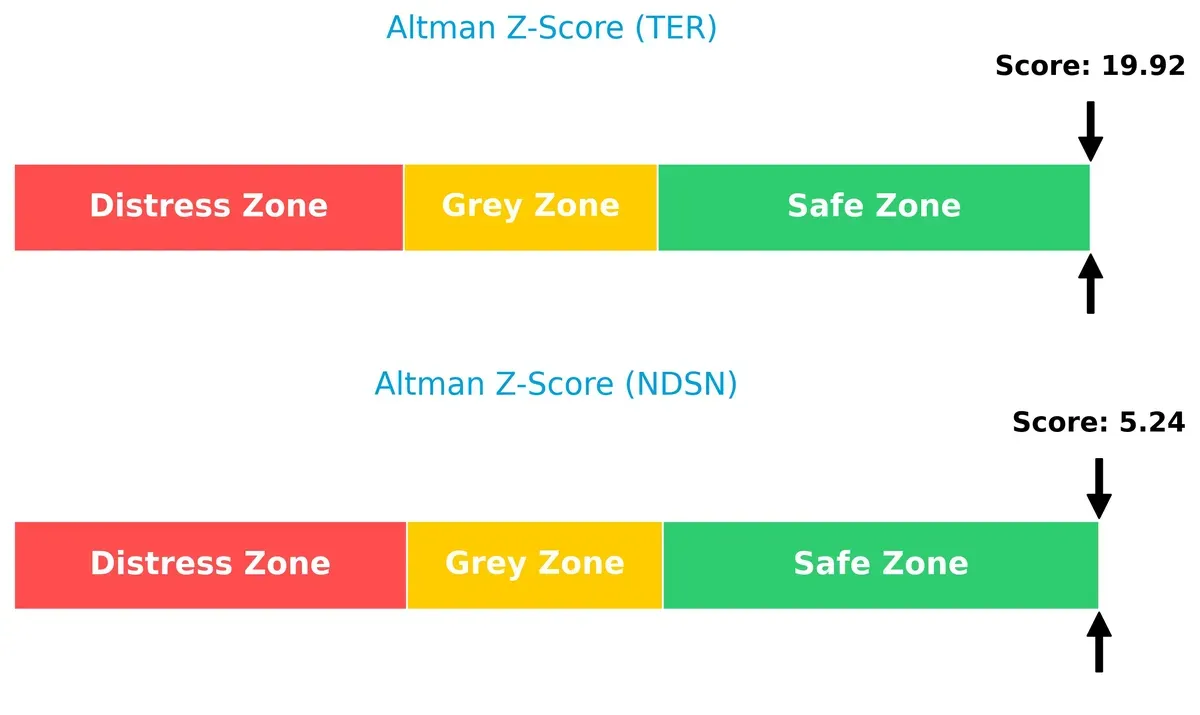
Bankruptcy Risk: Solvency Showdown
Teradyne’s Altman Z-Score of 19.9 far exceeds Nordson’s 5.2, signaling a much safer long-term solvency position in this cycle:
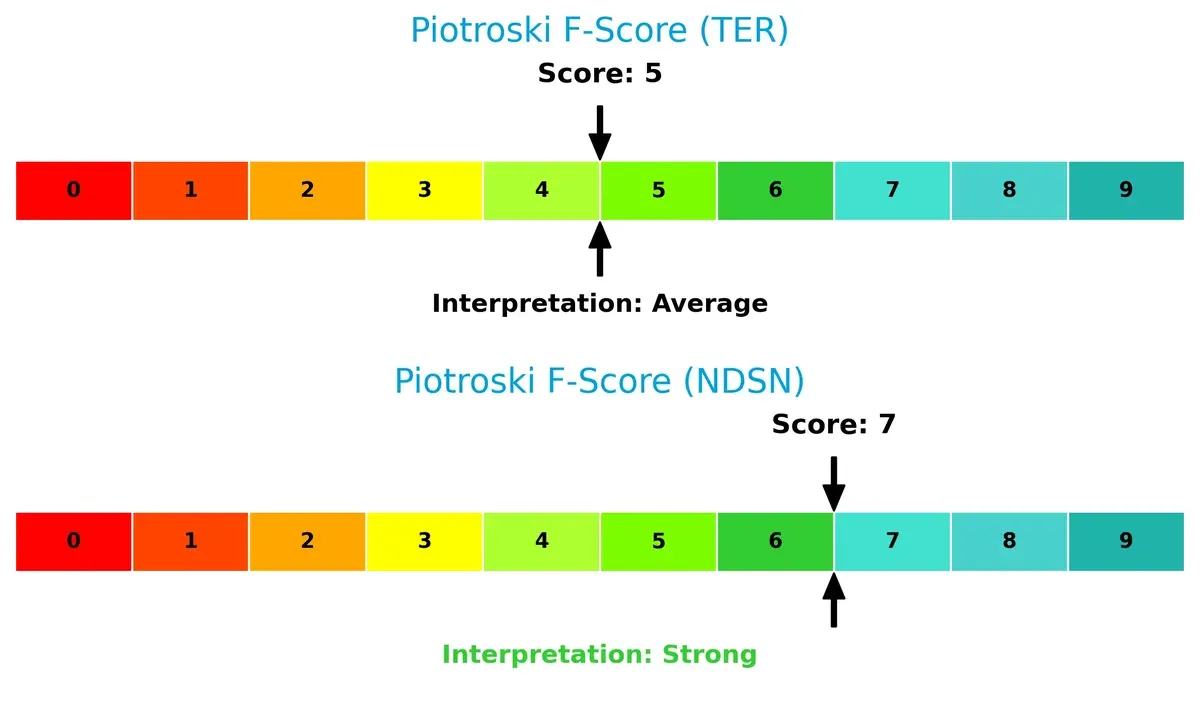
Financial Health: Quality of Operations
Nordson holds a stronger Piotroski F-Score at 7, indicating robust financial health, while Teradyne’s average 5 suggests caution on internal metrics:
How are the two companies positioned?
This section dissects TER and NDSN’s operational DNA by comparing revenue distribution and internal dynamics. The goal is to confront their economic moats and identify which offers the most resilient, sustainable competitive advantage today.
Revenue Segmentation: The Strategic Mix
The following visual comparison dissects how Teradyne, Inc. and Nordson Corporation diversify their income streams and where their primary sector bets lie:
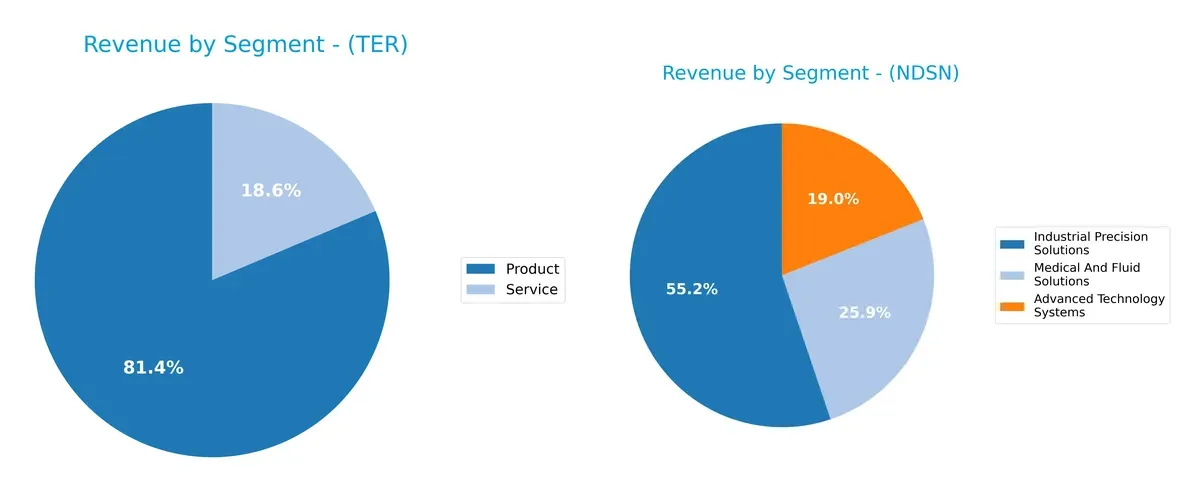
Teradyne anchors its revenue in Products with $2.3B in 2024, supported by $525M in Services, showing moderate diversification. Nordson spreads its $2.6B across Industrial Precision ($1.48B), Medical and Fluid ($695M), and Advanced Technology ($510M), reflecting a balanced portfolio. Teradyne’s concentration risks hinge on product demand cycles, while Nordson’s mix suggests resilience through sector diversification and infrastructure dominance.
Strengths and Weaknesses Comparison
This table compares the Strengths and Weaknesses of Teradyne, Inc. and Nordson Corporation:
TER Strengths
- Higher net margin at 19.23%
- Strong ROE at 19.24%
- Excellent liquidity with current ratio 2.91
- Very low debt-to-assets at 2.07%
- High interest coverage ratio of 81.43
- Balanced global presence with significant Asia sales
NDSN Strengths
- Favorable net margin at 17.35%
- Positive ROE of 15.92%
- Favorable ROIC at 10.49%
- Solid interest coverage at 5.55
- Diverse product segments
- Broad geographic presence including Americas and Asia
TER Weaknesses
- Unfavorable valuation multiples: PE 36.93 and PB 7.11
- Dividend yield low at 0.38%
- ROIC and WACC data unavailable
- Moderate asset turnover at 0.76
- Slightly lower service revenue diversification
NDSN Weaknesses
- Unfavorable PE at 27.1 and PB at 4.31
- Higher debt-to-equity at 0.69 and debt-to-assets at 35.36%
- Lower asset turnover at 0.47
- Dividend yield neutral at 1.36%
- Moderate neutral ratios dilute financial strength
Teradyne shows superior profitability and liquidity metrics, but valuation appears stretched and some key capital efficiency data is missing. Nordson balances favorable returns with higher leverage and more neutral financial metrics. Both firms demonstrate meaningful diversification and global reach, shaping distinct strategic profiles.
The Moat Duel: Analyzing Competitive Defensibility
A structural moat alone protects long-term profits from relentless competition and market erosion. Let’s dissect the unique moats of Teradyne and Nordson:
Teradyne, Inc.: Innovation-Driven Intellectual Property Moat
Teradyne’s moat stems from its advanced automated test equipment and intellectual property. This moat shows in solid gross margins (58.6%) and margin stability. However, declining ROIC signals rising competitive pressures in 2026, threatening its historical edge.
Nordson Corporation: Precision Engineering and Customer Integration Moat
Nordson leverages precision dispensing systems and long-term customer contracts, differing from Teradyne’s tech focus. It creates value with ROIC above WACC, albeit with a slight downward trend. Expansion into advanced technology solutions could deepen its competitive moat.
Innovation Edge vs. Precision Expertise: Which Moat Protects Better?
Nordson holds a slightly wider moat, demonstrated by ROIC exceeding WACC and consistent value creation. Teradyne’s innovation moat is strong but faces erosion. Nordson appears better positioned to defend and grow its market share in 2026.
Which stock offers better returns?
Over the past 12 months, Teradyne, Inc. and Nordson Corporation both showed bullish trends, with Teradyne displaying stronger price acceleration and higher volatility.
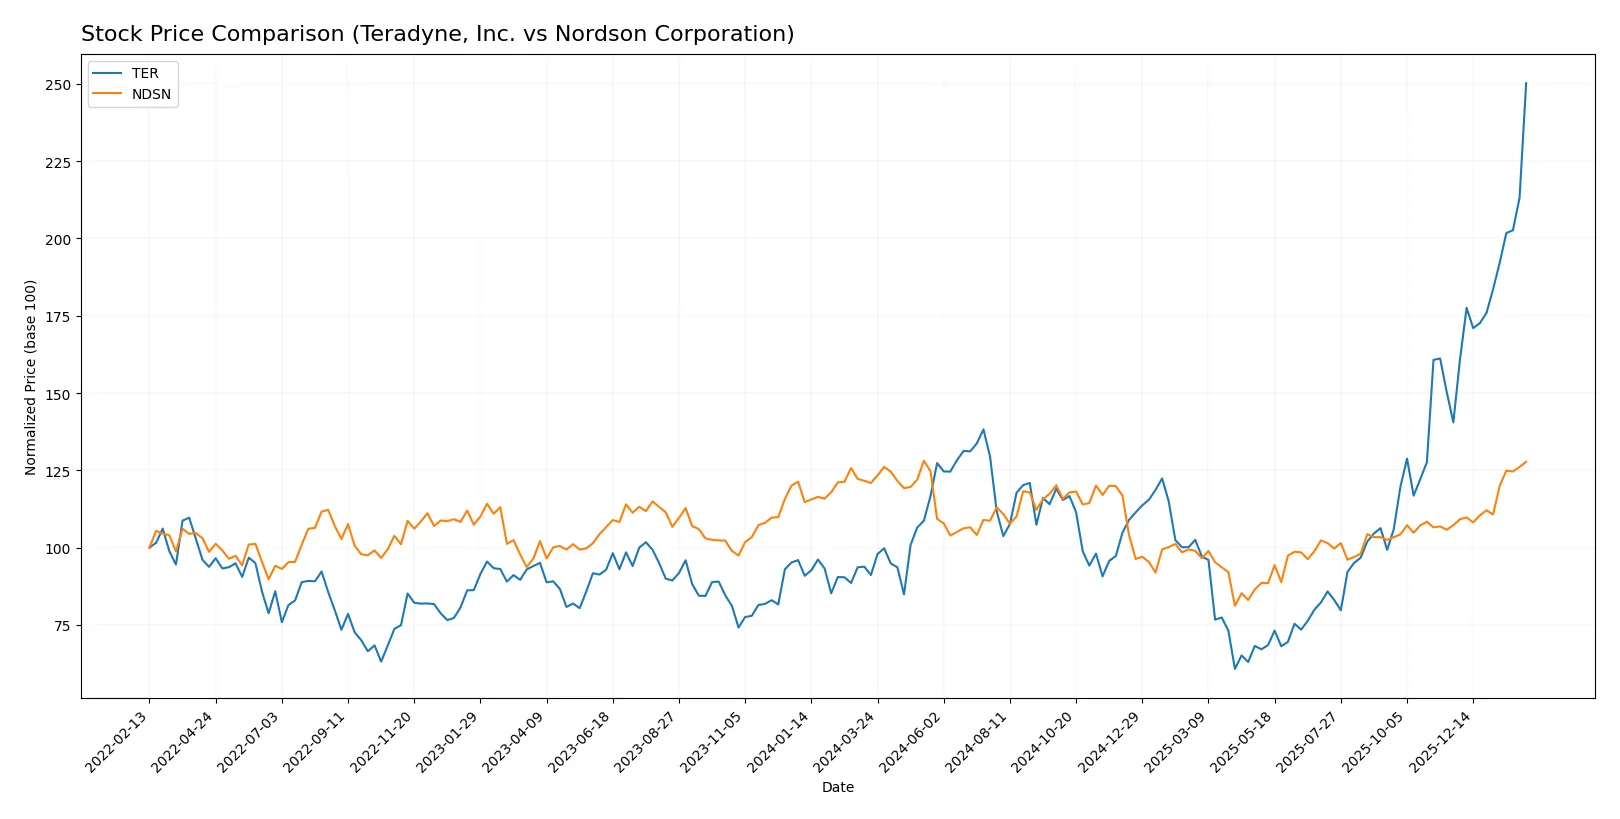
Trend Comparison
Teradyne, Inc. surged 175% over the past year, showing clear acceleration and a high price range from 69 to 283. Its volatility is elevated, with a 39.7 std deviation.
Nordson Corporation gained 5.7% over the same period with accelerating momentum. Its price fluctuated between 177 and 279, and volatility stayed moderate at 23.9 std deviation.
Teradyne’s stock outperformed Nordson’s by a wide margin, delivering significantly higher returns and stronger upward momentum in 2026.
Target Prices
Analysts project moderately bullish targets for Teradyne and Nordson, reflecting confidence tempered by valuation considerations.
| Company | Target Low | Target High | Consensus |
|---|---|---|---|
| Teradyne, Inc. | 175 | 288 | 245.33 |
| Nordson Corporation | 240 | 295 | 274.17 |
Teradyne’s target consensus sits below its current price of $283, suggesting limited upside or potential valuation pressure. Nordson’s consensus of $274 nearly matches its $278 market price, indicating expectations of stable performance with modest growth.

Don’t Let Luck Decide Your Entry Point
Optimize your entry points with our advanced ProRealTime indicators. You’ll get efficient buy signals with precise price targets for maximum performance. Start outperforming now!
How do institutions grade them?
Teradyne, Inc. Grades
The table below shows recent grades assigned to Teradyne, Inc. by leading firms.
| Grading Company | Action | New Grade | Date |
|---|---|---|---|
| Evercore ISI Group | maintain | Outperform | 2026-02-03 |
| Cantor Fitzgerald | maintain | Overweight | 2026-02-02 |
| Stifel | maintain | Buy | 2026-01-30 |
| UBS | maintain | Buy | 2026-01-26 |
| B of A Securities | maintain | Buy | 2026-01-22 |
| Stifel | maintain | Buy | 2026-01-14 |
| B of A Securities | maintain | Buy | 2026-01-13 |
| Goldman Sachs | upgrade | Buy | 2025-12-16 |
| Stifel | upgrade | Buy | 2025-12-02 |
| Citigroup | maintain | Buy | 2025-11-12 |
Nordson Corporation Grades
Below is a summary of recent grades awarded to Nordson Corporation by recognized analysts.
| Grading Company | Action | New Grade | Date |
|---|---|---|---|
| DA Davidson | maintain | Buy | 2025-12-12 |
| Baird | maintain | Neutral | 2025-12-12 |
| DA Davidson | maintain | Buy | 2025-12-11 |
| Keybanc | maintain | Overweight | 2025-12-11 |
| Oppenheimer | maintain | Outperform | 2025-08-25 |
| Baird | maintain | Neutral | 2025-08-22 |
| Keybanc | maintain | Overweight | 2025-07-15 |
| Oppenheimer | upgrade | Outperform | 2025-05-30 |
| Baird | maintain | Neutral | 2025-05-30 |
| Keybanc | maintain | Overweight | 2025-04-08 |
Which company has the best grades?
Teradyne consistently holds buy-level grades with multiple upgrades recently. Nordson’s grades skew more neutral and overweight, with fewer upgrades. Teradyne’s stronger grades may signal greater institutional confidence, affecting investor sentiment.
Risks specific to each company
The following categories identify the critical pressure points and systemic threats facing both firms in the 2026 market environment:
1. Market & Competition
Teradyne, Inc.
- Operates in highly cyclical semiconductor test equipment market with intense innovation pressure.
Nordson Corporation
- Faces competition in diverse industrial machinery sectors with steady but slower growth dynamics.
2. Capital Structure & Debt
Teradyne, Inc.
- Extremely low debt levels (D/E 0.03), strong interest coverage (81.4x), signaling conservative leverage.
Nordson Corporation
- Moderate leverage (D/E 0.69) and debt to assets at 35%, manageable but elevates financial risk.
3. Stock Volatility
Teradyne, Inc.
- High beta at 1.82 indicating significant market sensitivity and price swings.
Nordson Corporation
- Beta near 1.00 reflects market-level volatility, more stable price movements.
4. Regulatory & Legal
Teradyne, Inc.
- Subject to export controls and IP regulations in semiconductor sector, risk of geopolitical tech restrictions.
Nordson Corporation
- Faces industrial safety and environmental regulations, with moderate legal exposure.
5. Supply Chain & Operations
Teradyne, Inc.
- Dependent on complex semiconductor supply chains vulnerable to global disruptions.
Nordson Corporation
- Supply chain diversified but exposed to raw material price fluctuations and logistics issues.
6. ESG & Climate Transition
Teradyne, Inc.
- Increasing pressure to reduce carbon footprint in tech manufacturing processes.
Nordson Corporation
- Stronger emphasis on sustainable industrial solutions; moderate ESG risks.
7. Geopolitical Exposure
Teradyne, Inc.
- High exposure to US-China tech tensions impacting semiconductor market access.
Nordson Corporation
- Mainly North America focused, limited direct geopolitical risk.
Which company shows a better risk-adjusted profile?
Teradyne’s most impactful risk is its high stock volatility and geopolitical exposure in the semiconductor sector. Nordson’s key risk lies in its moderate leverage and supply chain vulnerabilities. Despite Teradyne’s sharper market swings, its conservative capital structure and robust liquidity provide a safer financial footing. Nordson has steadier stock behavior but bears higher financial risk from debt. The Altman Z-score for both companies places them in the safe zone; however, Nordson’s stronger Piotroski score signals better operational health. Overall, Teradyne shows a better risk-adjusted profile due to its balance sheet strength amid sector cyclicality.
Final Verdict: Which stock to choose?
Teradyne, Inc. excels as a cash-generating powerhouse with robust operational efficiency and a pristine balance sheet. Its superpower lies in delivering strong returns and maintaining liquidity, though its premium valuation demands vigilance. It fits best within an aggressive growth portfolio willing to pay for quality and momentum.
Nordson Corporation boasts a strategic moat through steady value creation and a solid recurring revenue base. It offers a more balanced risk profile compared to Teradyne, with a safer leverage position and consistent financial strength. This makes it suitable for a GARP (Growth at a Reasonable Price) investor seeking stability and moderate growth.
If you prioritize high operational efficiency and capital discipline with an appetite for valuation risk, Teradyne outshines as the compelling choice. However, if you seek a more conservative growth approach with stronger capital safety and less valuation premium, Nordson offers better stability and value creation. Both require careful monitoring of their profitability trends.
Disclaimer: Investment carries a risk of loss of initial capital. The past performance is not a reliable indicator of future results. Be sure to understand risks before making an investment decision.
Go Further
I encourage you to read the complete analyses of Teradyne, Inc. and Nordson Corporation to enhance your investment decisions: