Teradyne, Inc. and Kadant Inc. are two prominent players in technology-driven industries that support manufacturing and industrial processes. Teradyne specializes in semiconductor testing and industrial automation, while Kadant focuses on engineered systems for material handling and industrial processing. Comparing these companies reveals insights into their innovation strategies and market positions. In this article, I will help you decide which company holds the most promise for your investment portfolio.
Table of contents
Companies Overview
I will begin the comparison between Teradyne and Kadant by providing an overview of these two companies and their main differences.
Teradyne Overview
Teradyne, Inc. designs, develops, manufactures, sells, and supports automatic test equipment worldwide. It operates through Semiconductor Test, System Test, Industrial Automation, and Wireless Test segments, serving diverse markets including automotive, industrial, communications, and consumer electronics. Teradyne holds a strong position in the semiconductor industry, with a market cap of $33.3B and 6,500 employees, headquartered in North Reading, Massachusetts.
Kadant Overview
Kadant Inc. supplies technologies and engineered systems globally, with three business segments: Flow Control, Industrial Processing, and Material Handling. Its products serve packaging, tissue, wood products, and alternative fuel industries. Kadant, with a market cap of $3.4B and 3,500 employees, is headquartered in Westford, Massachusetts, and focuses on industrial machinery solutions and fluid-handling systems.
Key similarities and differences
Both Teradyne and Kadant are US-based companies headquartered in Massachusetts, but Teradyne operates primarily in technology and semiconductors while Kadant focuses on industrial machinery. Teradyne’s diverse segments include test equipment and automation, contrasting with Kadant’s engineered systems for industrial processing and material handling. Market capitalization and employee count also differ significantly, reflecting their scale and industry focus.
Income Statement Comparison
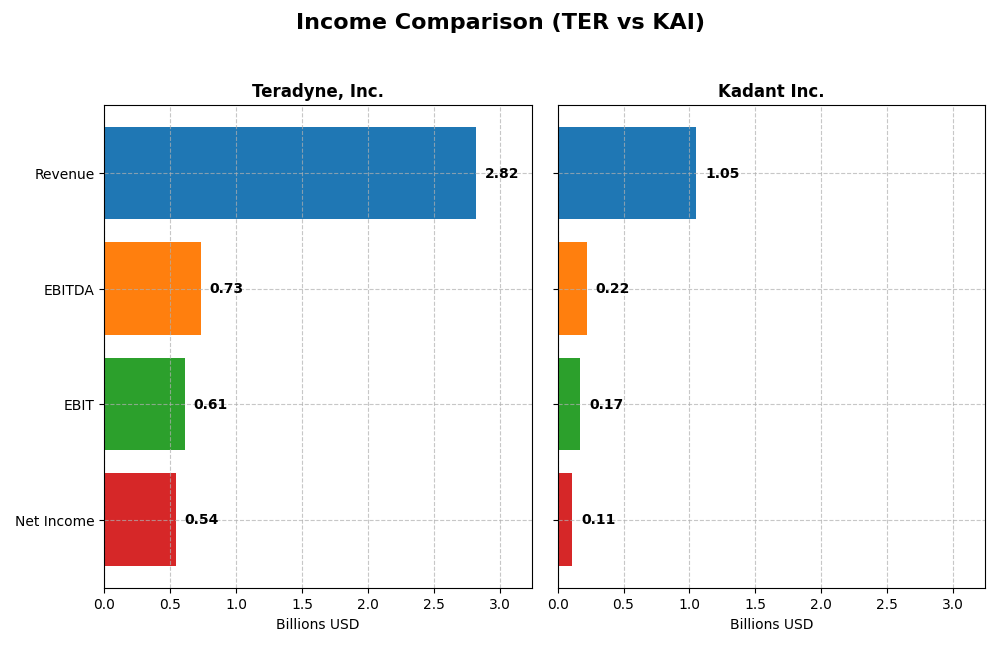
The table below compares key income statement metrics for Teradyne, Inc. and Kadant Inc. for the fiscal year 2024, providing a snapshot of their financial performance.
| Metric | Teradyne, Inc. | Kadant Inc. |
|---|---|---|
| Market Cap | 33.34B | 3.37B |
| Revenue | 2.82B | 1.05B |
| EBITDA | 732M | 223M |
| EBIT | 613M | 173M |
| Net Income | 542M | 112M |
| EPS | 3.41 | 9.51 |
| Fiscal Year | 2024 | 2024 |
Income Statement Interpretations
Teradyne, Inc.
Teradyne’s revenue declined overall by 9.66% from 2020 to 2024, with net income decreasing by 30.83% over the same period. Margins remained strong, highlighted by a 58.48% gross margin and a 19.23% net margin in 2024. The most recent year showed moderate revenue growth of 5.36%, improved EBIT margin, and a favorable 21.61% increase in EPS, signaling operational efficiency gains.
Kadant Inc.
Kadant experienced robust growth with revenue up 65.88% and net income more than doubling (+102.18%) over 2020-2024. Margins improved steadily, with a 44.25% gross margin and 10.59% net margin in 2024. Despite a 9.99% revenue increase last year, net margin and EPS declined by 12.59% and 4.24%, respectively, indicating margin pressure despite top-line expansion.
Which one has the stronger fundamentals?
Kadant shows stronger long-term growth in revenue, net income, and margins, supported by a higher proportion of favorable income statement indicators (71.43%). Teradyne maintains superior profitability margins but faces unfavorable overall declines in revenue and net income. Both companies have favorable income statement opinions, yet Kadant’s sustained growth contrasts with Teradyne’s recent rebound after a downward trend.
Financial Ratios Comparison
This table presents the most recent key financial ratios for Teradyne, Inc. and Kadant Inc., reflecting their latest fiscal year performance for straightforward comparison.
| Ratios | Teradyne, Inc. (TER) | Kadant Inc. (KAI) |
|---|---|---|
| ROE | 19.2% | 13.2% |
| ROIC | 17.2% | 10.1% |
| P/E | 36.9 | 36.9 |
| P/B | 7.11 | 4.86 |
| Current Ratio | 2.91 | 2.31 |
| Quick Ratio | 1.84 | 1.55 |
| D/E | 0.027 | 0.381 |
| Debt-to-Assets | 2.07% | 22.6% |
| Interest Coverage | 165.5 | 8.55 |
| Asset Turnover | 0.76 | 0.74 |
| Fixed Asset Turnover | 4.88 | 6.18 |
| Payout ratio | 14.1% | 13.1% |
| Dividend yield | 0.38% | 0.36% |
Interpretation of the Ratios
Teradyne, Inc.
Teradyne shows mostly strong financial ratios with favorable net margin (19.23%), ROE (19.24%), and ROIC (17.25%), indicating solid profitability and capital efficiency. The company maintains a healthy liquidity position and low debt levels. However, higher valuation multiples (PE 36.93, PB 7.11) and WACC (12.44%) are points of caution. Dividend yield is low at 0.38%, with consistent dividend payments supported by free cash flow, suggesting cautious but steady shareholder returns.
Kadant Inc.
Kadant presents a mixed ratio profile with a favorable net margin (10.59%) and ROIC (10.08%), though ROE is neutral at 13.17%, reflecting moderate profitability. Liquidity and leverage ratios are sound, supported by interest coverage of 8.64. Valuation multiples remain elevated (PE 36.9, PB 4.86). Dividend yield is similarly low at 0.36%, with dividends paid despite a smaller market cap, indicating steady shareholder compensation but limited yield.
Which one has the best ratios?
Teradyne exhibits a higher proportion of favorable ratios (64.29% vs. 57.14%) and stronger profitability metrics like ROE and ROIC, balanced by low leverage and robust liquidity. Kadant’s ratios are generally positive but show more neutrality and slightly higher debt levels. Overall, Teradyne’s financial metrics suggest a more consistent performance across key indicators, while Kadant offers moderate strengths with some cautionary signals.
Strategic Positioning
This section compares the strategic positioning of Teradyne, Inc. and Kadant Inc., including market position, key segments, and exposure to technological disruption:
Teradyne, Inc.
- Leading semiconductor test equipment provider facing competition in semiconductors and automation.
- Operates in Semiconductor Test, System Test, Industrial Automation, and Wireless Test segments.
- Exposed to technological shifts in semiconductor testing, wireless tech, and industrial automation.
Kadant Inc.
- Mid-sized industrial machinery supplier with competitive pressure in fluid handling and processing.
- Focused on Flow Control, Industrial Processing, and Material Handling segments with diverse applications.
- Exposure to industrial automation and processed materials, less driven by rapid tech disruption.
Teradyne, Inc. vs Kadant Inc. Positioning
Teradyne has a diversified technology-driven approach spanning semiconductor and automation sectors, while Kadant concentrates on industrial machinery for fluid control and material handling. Teradyne benefits from broader tech exposure; Kadant relies on industrial market niches.
Which has the best competitive advantage?
Teradyne shows a slightly favorable moat with value creation despite declining profitability, indicating some competitive advantage. Kadant’s profitability is rising but currently sheds value, reflecting a weaker competitive position.
Stock Comparison
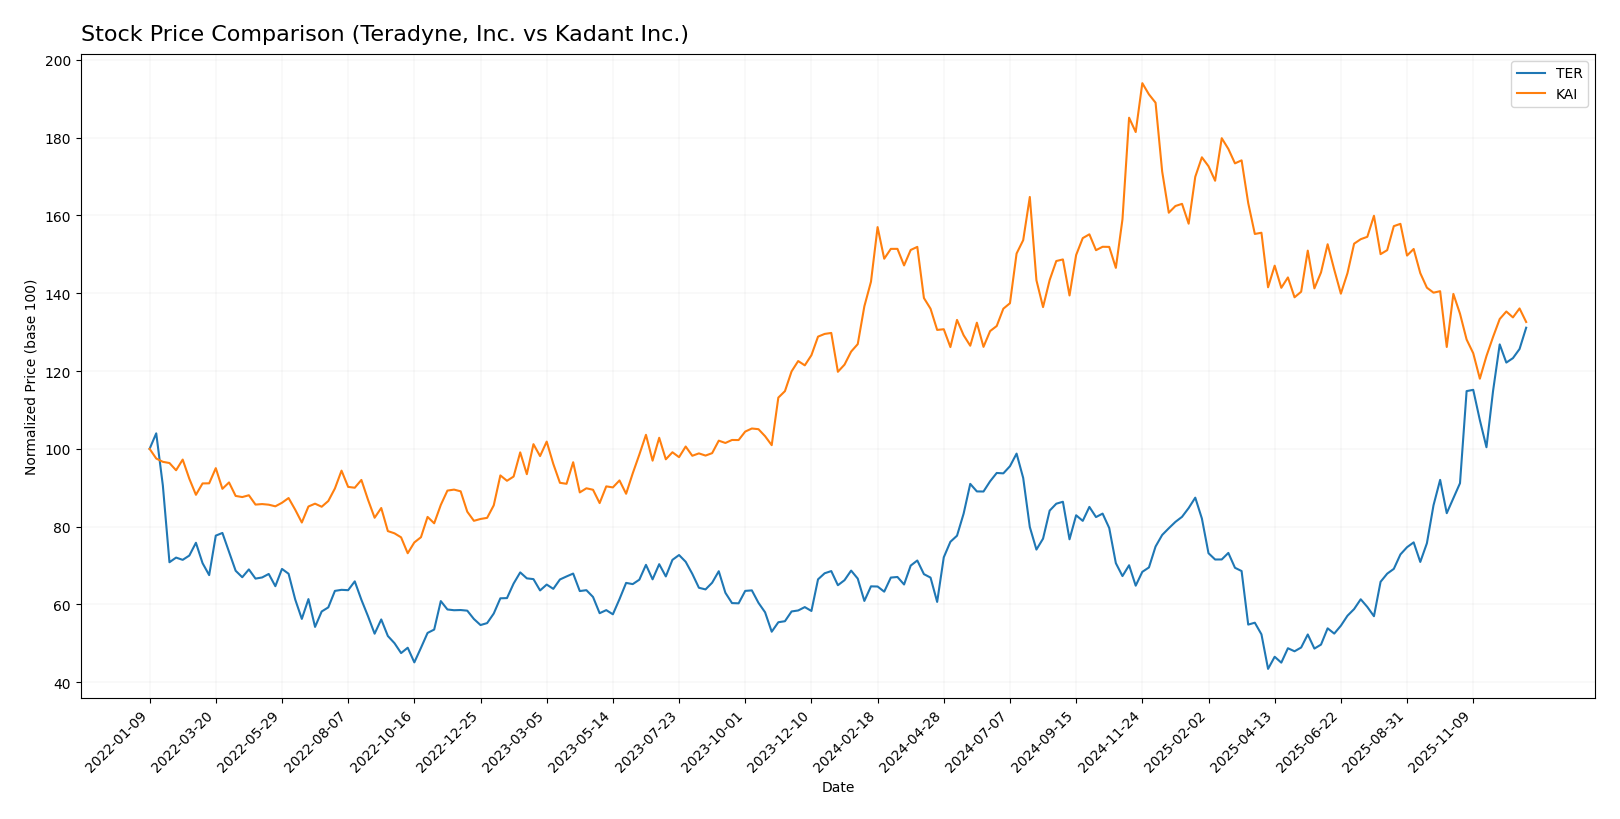
The stock price movements of Teradyne, Inc. (TER) and Kadant Inc. (KAI) over the past year reveal contrasting trends, with TER showing substantial gains and KAI experiencing declines amid varying trading volumes and buyer behaviors.
Trend Analysis
Teradyne, Inc. (TER) exhibited a strong bullish trend over the past 12 months with a remarkable 102.87% price increase, marked by acceleration and a high volatility level (std deviation 30.21). The stock reached a peak price of 207.56 and a low of 68.72.
Kadant Inc. (KAI) showed a bearish trend with a 7.24% price decline over the same period, also under acceleration and higher volatility (std deviation 34.46). Its highest and lowest prices were 419.01 and 254.91 respectively.
Comparing the two, Teradyne delivered the highest market performance with a significant positive trend, whereas Kadant faced a declining trend, reflecting opposite market dynamics.
Target Prices
Analysts present a clear consensus on target prices for Teradyne, Inc. and Kadant Inc., reflecting moderate upside potential.
| Company | Target High | Target Low | Consensus |
|---|---|---|---|
| Teradyne, Inc. | 240 | 136 | 200.22 |
| Kadant Inc. | 410 | 275 | 342.5 |
For Teradyne, the consensus target price of 200.22 is slightly below the current price of 207.56, suggesting limited near-term upside. Kadant’s target consensus at 342.5 is significantly above its current price of 286.4, indicating stronger expected growth potential.
Analyst Opinions Comparison
This section compares analysts’ ratings and grades for Teradyne, Inc. and Kadant Inc.:
Rating Comparison
TER Rating
- Rating: B, considered very favorable.
- Discounted Cash Flow Score: 3, moderate.
- ROE Score: 4, favorable efficiency.
- ROA Score: 5, very favorable asset use.
- Debt To Equity Score: 3, moderate risk.
- Overall Score: 3, moderate financial standing.
KAI Rating
- Rating: B+, considered very favorable.
- Discounted Cash Flow Score: 4, favorable.
- ROE Score: 3, moderate efficiency.
- ROA Score: 4, favorable asset use.
- Debt To Equity Score: 3, moderate risk.
- Overall Score: 3, moderate financial standing.
Which one is the best rated?
Kadant holds a slightly better rating (B+) than Teradyne (B) and scores higher in Discounted Cash Flow and ROA. Teradyne excels in ROE and ROA but has lower valuation scores. Overall, Kadant is somewhat better rated based on provided data.
Scores Comparison
The scores comparison between Teradyne, Inc. and Kadant Inc. highlights their financial stability and strength:
TER Scores
- Altman Z-Score: 14.74, indicating a safe zone with very low bankruptcy risk.
- Piotroski Score: 5, reflecting average financial strength and investment quality.
KAI Scores
- Altman Z-Score: 5.59, also in the safe zone with low bankruptcy risk.
- Piotroski Score: 7, showing strong financial health and value potential.
Which company has the best scores?
Kadant has a lower Altman Z-Score than Teradyne but remains in the safe zone; its Piotroski Score is higher, indicating stronger financial health compared to Teradyne’s average score.
Grades Comparison
The grades from reputable financial institutions for Teradyne, Inc. and Kadant Inc. are as follows:
Teradyne, Inc. Grades
This table summarizes recent stock grades and actions by major grading companies for Teradyne, Inc.
| Grading Company | Action | New Grade | Date |
|---|---|---|---|
| Goldman Sachs | Upgrade | Buy | 2025-12-16 |
| Stifel | Upgrade | Buy | 2025-12-02 |
| Citigroup | Maintain | Buy | 2025-11-12 |
| Goldman Sachs | Maintain | Sell | 2025-10-30 |
| UBS | Maintain | Buy | 2025-10-30 |
| Evercore ISI Group | Maintain | Outperform | 2025-10-30 |
| JP Morgan | Maintain | Neutral | 2025-10-30 |
| Evercore ISI Group | Maintain | Outperform | 2025-10-28 |
| Stifel | Maintain | Hold | 2025-10-28 |
| UBS | Maintain | Buy | 2025-10-20 |
Teradyne’s grades show a mix of positive upgrades to Buy and Outperform, with some Hold and Sell ratings maintained, indicating a generally favorable but somewhat cautious outlook.
Kadant Inc. Grades
The following table shows the stock grades from recognized research firms for Kadant Inc.
| Grading Company | Action | New Grade | Date |
|---|---|---|---|
| Barrington Research | Maintain | Outperform | 2025-10-30 |
| Barrington Research | Maintain | Outperform | 2025-10-29 |
| Barrington Research | Maintain | Outperform | 2025-10-27 |
| Barrington Research | Maintain | Outperform | 2025-10-10 |
| Barrington Research | Maintain | Outperform | 2025-09-23 |
| DA Davidson | Maintain | Neutral | 2025-08-04 |
| Barrington Research | Maintain | Outperform | 2025-07-30 |
| Barrington Research | Maintain | Outperform | 2025-07-29 |
| Barrington Research | Maintain | Outperform | 2025-05-01 |
| DA Davidson | Maintain | Neutral | 2025-05-01 |
Kadant’s ratings predominantly feature consistent Outperform grades maintained by Barrington Research, with neutral ratings from DA Davidson, reflecting steady confidence in the stock.
Which company has the best grades?
Kadant Inc. has consistently received Outperform ratings, reflecting strong confidence from its main grading company, while Teradyne, Inc. shows a more varied rating profile including upgrades to Buy but also some Holds and a Sell. This difference may influence investor perception of stability and growth prospects.
Strengths and Weaknesses
Below is a comparative overview of the key strengths and weaknesses for Teradyne, Inc. (TER) and Kadant Inc. (KAI), based on their latest financial and operational data.
| Criterion | Teradyne, Inc. (TER) | Kadant Inc. (KAI) |
|---|---|---|
| Diversification | Moderate product and service mix; strong in industrial automation and semiconductor test segments | Focused product range with capital equipment and parts and consumables; less diversified |
| Profitability | High net margin (19.23%), ROIC (17.25%) significantly above WACC (12.44%); creating value despite declining ROIC trend | Moderate net margin (10.59%), ROIC (10.08%) slightly above WACC (9.24%); increasing profitability trend but still shedding value |
| Innovation | Strong innovation in semiconductor and systems testing, maintaining competitive edge | Moderate innovation focus with steady growth in capital equipment and consumables |
| Global presence | Extensive global footprint supported by diversified product lines | More niche market presence with steady expansion |
| Market Share | Leading market position in semiconductor test equipment | Smaller market share but showing growth potential |
Key takeaways: Teradyne demonstrates robust profitability and a diversified product portfolio, though its profitability shows signs of decline. Kadant is improving its profitability with a growing ROIC, but it currently lacks a strong economic moat. Both companies maintain favorable financial health, making them viable but distinct investment options.
Risk Analysis
Below is a comparison of key risks for Teradyne, Inc. (TER) and Kadant Inc. (KAI) based on the most recent 2024 data and market conditions in 2026:
| Metric | Teradyne, Inc. (TER) | Kadant Inc. (KAI) |
|---|---|---|
| Market Risk | High beta at 1.85 implies elevated volatility and sensitivity to market swings. | Moderate beta at 1.26 indicates less volatility but still exposed to market fluctuations. |
| Debt level | Very low debt-to-equity (0.03) and debt-to-assets (2.07%), minimal financial leverage risk. | Moderate debt-to-equity (0.38) and debt-to-assets (22.57%), manageable but higher leverage. |
| Regulatory Risk | Moderate, tied to semiconductor industry compliance and export controls. | Moderate, industrial machinery sector subject to environmental and safety regulations. |
| Operational Risk | Diversified segments reduce risk; reliance on semiconductor cycle impacts production demand. | Exposure to industrial processing complexities and supply chain volatility. |
| Environmental Risk | Moderate, with increasing pressure for sustainability in manufacturing processes. | Moderate to elevated, given material handling and industrial processing impacts. |
| Geopolitical Risk | Elevated due to global semiconductor supply chain tensions and trade restrictions. | Moderate, with some exposure to international markets but less sensitive than semiconductors. |
Teradyne faces the most impactful risks from its high market volatility and geopolitical tensions affecting semiconductor supply chains. Kadant’s risks center more on moderate leverage and operational challenges within industrial markets. Both companies maintain sound debt profiles, but Teradyne’s exposure to global trade issues warrants caution.
Which Stock to Choose?
Teradyne, Inc. (TER) shows a generally favorable income evolution with strong profitability metrics including a 19.23% net margin and 19.24% ROE, supported by low debt levels and a very favorable rating of B. Its ROIC exceeds WACC, indicating value creation despite a declining profitability trend.
Kadant Inc. (KAI) presents favorable income growth over the long term, though recent net margin growth is weaker. Financial ratios are mostly favorable with moderate profitability (10.59% net margin, 13.17% ROE) and manageable debt, earning a very favorable B+ rating. Its ROIC is below WACC but trending upward, suggesting improving profitability.
Investors seeking growth might find Kadant’s improving ROIC and income growth attractive, while those prioritizing consistent profitability and low debt might view Teradyne’s strong margins and value creation as more favorable. The ultimate choice could depend on the investor’s risk tolerance and preference for stability versus growth potential.
Disclaimer: Investment carries a risk of loss of initial capital. The past performance is not a reliable indicator of future results. Be sure to understand risks before making an investment decision.
Go Further
I encourage you to read the complete analyses of Teradyne, Inc. and Kadant Inc. to enhance your investment decisions: