Teradyne, Inc. and indie Semiconductor, Inc. both operate in the semiconductor industry, yet they target distinct market niches with overlapping innovation in automotive and wireless technology. Teradyne focuses on test equipment and automation, while indie Semiconductor develops automotive chips and software solutions. Comparing these companies reveals their growth potential and risk profiles. This article will guide you in deciding which company deserves a place in your investment portfolio.
Table of contents
Companies Overview
I will begin the comparison between Teradyne and indie Semiconductor by providing an overview of these two companies and their main differences.
Teradyne Overview
Teradyne, Inc. is a leading provider of automatic test equipment globally, with a focus on semiconductor, system, industrial automation, and wireless test segments. The company serves diverse markets including automotive, communications, consumer electronics, and cloud computing. Headquartered in North Reading, Massachusetts, Teradyne supports integrated device manufacturers, fabless companies, foundries, and test subcontractors with advanced testing platforms and robotic automation solutions.
indie Semiconductor Overview
indie Semiconductor, Inc. specializes in automotive semiconductors and software for driver assistance, connected car systems, and electrification applications. Its products include ultrasound sensors, in-cabin wireless charging, infotainment, LED lighting, and telematics. Based in Aliso Viejo, California, indie also develops photonic components for optical communication and sensing markets, targeting advanced technology platforms in the automotive sector.
Key similarities and differences
Both Teradyne and indie Semiconductor operate in the semiconductor industry but focus on distinct segments. Teradyne emphasizes testing equipment and automation solutions across broad electronics markets, while indie concentrates on automotive semiconductor devices and software. Teradyne is a larger, more diversified company with a market cap of 36.6B and 6,500 employees, compared to indie’s niche automotive focus, 857M market cap, and 920 employees, reflecting different scales and market approaches.
Income Statement Comparison
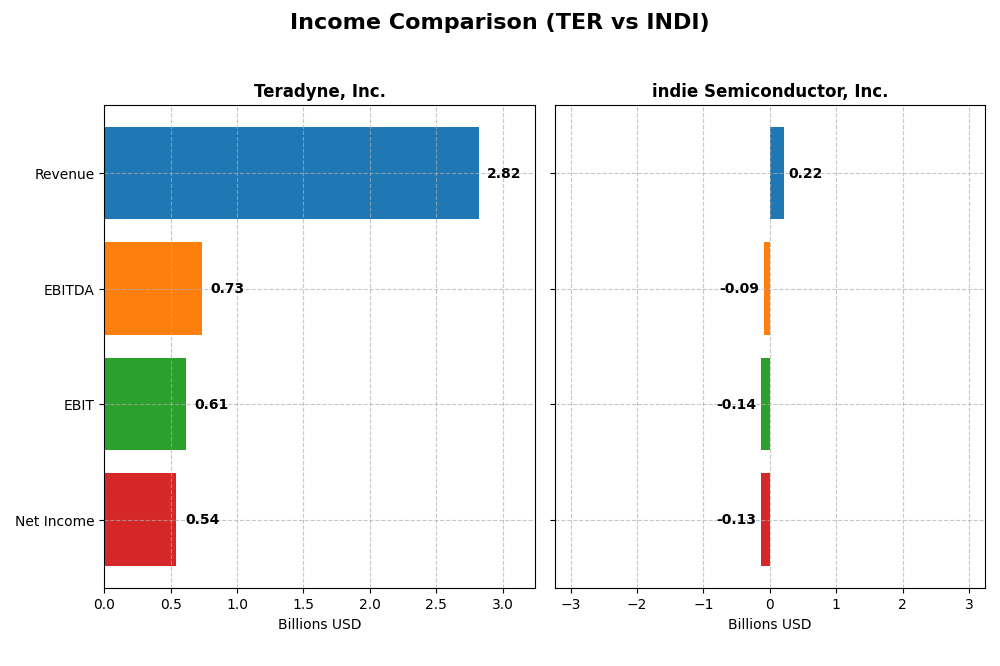
This table summarizes key income statement metrics for Teradyne, Inc. and indie Semiconductor, Inc. for the 2024 fiscal year, providing a clear side-by-side financial snapshot.
| Metric | Teradyne, Inc. (TER) | indie Semiconductor, Inc. (INDI) |
|---|---|---|
| Market Cap | 36.6B | 857M |
| Revenue | 2.82B | 217M |
| EBITDA | 732M | -94M |
| EBIT | 613M | -137M |
| Net Income | 542M | -133M |
| EPS | 3.41 | -0.76 |
| Fiscal Year | 2024 | 2024 |
Income Statement Interpretations
Teradyne, Inc.
Teradyne’s revenue declined by 9.66% over 2020-2024, with net income decreasing 30.83% during the same period. Despite this, gross and net margins remain favorable at 58.48% and 19.23%, respectively. In 2024, revenue grew modestly by 5.36%, while net margin and EPS improved significantly, reflecting enhanced profitability and operational efficiency.
indie Semiconductor, Inc.
indie Semiconductor experienced strong revenue growth of 858.35% over the 2020-2024 period, but net income declined by 36.01%. Gross margin stood at 41.68%, while EBIT and net margins were negative, highlighting ongoing profitability challenges. In 2024, revenue slightly decreased by 2.91%, with a notable gross profit increase but worsening EBIT and net margin figures.
Which one has the stronger fundamentals?
Teradyne displays stronger fundamentals with consistently favorable margins, positive net income, and improving profitability metrics in the most recent year. indie Semiconductor shows rapid top-line growth but faces persistent losses and negative margins, reflecting higher risk. Teradyne’s stable earnings and margin improvements outweigh indie’s volatile performance despite its revenue surge.
Financial Ratios Comparison
The table below compares key financial ratios for Teradyne, Inc. and indie Semiconductor, Inc. based on their latest available fiscal year data (2024).
| Ratios | Teradyne, Inc. (TER) | indie Semiconductor, Inc. (INDI) |
|---|---|---|
| ROE | 19.2% | -31.7% |
| ROIC | 17.2% | -19.3% |
| P/E | 36.9 | -5.35 |
| P/B | 7.11 | 1.70 |
| Current Ratio | 2.91 | 4.82 |
| Quick Ratio | 1.84 | 4.23 |
| D/E (Debt-to-Equity) | 0.027 | 0.95 |
| Debt-to-Assets | 2.07% | 42.3% |
| Interest Coverage | 166 | -18.4 |
| Asset Turnover | 0.76 | 0.23 |
| Fixed Asset Turnover | 4.88 | 4.30 |
| Payout ratio | 14.1% | 0% |
| Dividend yield | 0.38% | 0% |
Interpretation of the Ratios
Teradyne, Inc.
Teradyne shows predominantly strong financial ratios with favorable net margin (19.23%), ROE (19.24%), and ROIC (17.25%), supported by a solid current ratio (2.91) and low debt levels. However, the company has some unfavorable valuations like a high PE of 36.93 and PB of 7.11, and a low dividend yield of 0.38%. Teradyne pays dividends with a modest yield, indicating cautious shareholder returns supported by sustainable free cash flow and manageable payout risks.
indie Semiconductor, Inc.
indie Semiconductor displays weak ratios, including a negative net margin (-61.2%), ROE (-31.73%), and ROIC (-19.25%), reflecting ongoing losses and operational challenges. The company has a high current ratio (4.82) but unfavorable interest coverage (-14.8) and low asset turnover (0.23). indie Semiconductor does not pay dividends, likely due to negative earnings and a focus on reinvestment in R&D and growth initiatives, as indicated by high research and development expenses.
Which one has the best ratios?
Teradyne holds the advantage with a majority of favorable ratios, healthy profitability, and controlled leverage, despite some valuation concerns. indie Semiconductor faces significant financial challenges, marked by negative profitability and cash flow metrics, rendering its ratios globally unfavorable. Based on the available metrics, Teradyne offers a more stable financial profile relative to indie Semiconductor.
Strategic Positioning
This section compares the strategic positioning of Teradyne, Inc. and indie Semiconductor, Inc., focusing on market position, key segments, and exposure to technological disruption:
Teradyne, Inc.
- Established leader in semiconductor test equipment with diversified segments facing competitive pressure.
- Operates across semiconductor test, system test, industrial automation, and wireless test segments.
- Exposed to technological disruption via evolving semiconductor test and wireless communication technologies.
indie Semiconductor, Inc.
- Smaller player focused on automotive semiconductors, competing in a specialized and evolving market segment.
- Concentrates on automotive semiconductors and software for driver assistance, connectivity, and electrification.
- Faces disruption risks in automotive semiconductor innovation and photonic component technologies.
Teradyne, Inc. vs indie Semiconductor, Inc. Positioning
Teradyne benefits from a diversified business model across multiple test and automation segments, offering stability but facing broad industry competition. indie Semiconductor’s concentrated focus on automotive applications allows specialization but limits diversification and increases exposure to market shifts.
Which has the best competitive advantage?
Teradyne shows a slightly favorable moat with value creation despite declining profitability, while indie Semiconductor’s very unfavorable moat reflects value destruction and declining returns, indicating Teradyne holds the stronger competitive advantage.
Stock Comparison
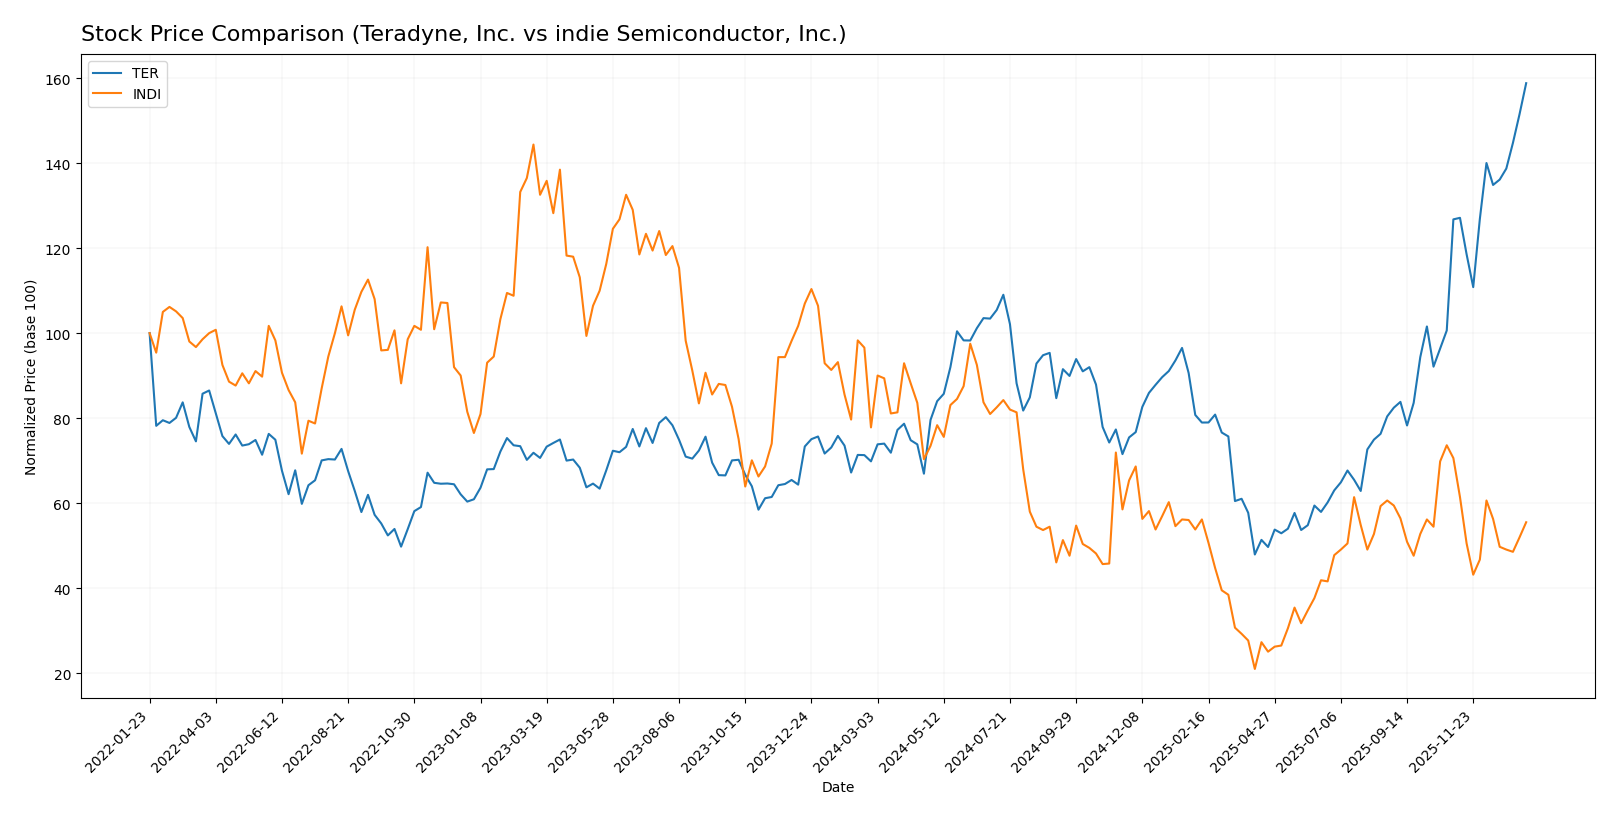
The stock price chart over the past year highlights Teradyne, Inc.’s strong upward momentum contrasted with indie Semiconductor, Inc.’s notable decline, reflecting divergent trading dynamics and investor sentiment.
Trend Analysis
Teradyne, Inc. displayed a bullish trend with a 127.38% price increase over the past 12 months, showing acceleration and considerable volatility with a standard deviation of 33.24. The stock reached a high of 227.7 and a low of 68.72.
indie Semiconductor, Inc. experienced a bearish trend, dropping 28.67% over the same period. The trend decelerated with low volatility, a standard deviation of 1.35, and price fluctuating between 1.6 and 7.43.
Comparing both, Teradyne, Inc. delivered the highest market performance with strong buyer dominance, whereas indie Semiconductor, Inc. faced sustained selling pressure and a declining price trend.
Target Prices
The current analyst consensus reveals a range of expectations for these semiconductor companies.
| Company | Target High | Target Low | Consensus |
|---|---|---|---|
| Teradyne, Inc. | 275 | 136 | 212.7 |
| indie Semiconductor, Inc. | 8 | 8 | 8 |
Analysts project Teradyne’s stock to trade below its target consensus of 212.7, though its current price of 227.7 is slightly above this level. indie Semiconductor’s consensus target price of 8 is significantly higher than its current price of 4.23, suggesting potential upside.
Analyst Opinions Comparison
This section compares analysts’ ratings and grades for Teradyne, Inc. and indie Semiconductor, Inc.:
Rating Comparison
TER Rating
- Rating: B+ indicating a very favorable overall rating.
- Discounted Cash Flow Score: 3, a moderate valuation.
- ROE Score: 4, favorable efficiency in profit generation.
- ROA Score: 5, very favorable asset utilization.
- Debt To Equity Score: 4, favorable financial stability.
- Overall Score: 3, moderate financial standing.
INDI Rating
- Rating: C- indicating a very unfavorable overall rating.
- Discounted Cash Flow Score: 1, very unfavorable valuation.
- ROE Score: 1, very unfavorable efficiency.
- ROA Score: 1, very unfavorable asset utilization.
- Debt To Equity Score: 1, very unfavorable financial risk.
- Overall Score: 1, very unfavorable financial standing.
Which one is the best rated?
Teradyne, Inc. is better rated than indie Semiconductor, Inc. across all key financial scores, showing stronger profitability, asset use, and financial stability based on the provided data.
Scores Comparison
Here is a comparison of the financial scores for Teradyne, Inc. and indie Semiconductor, Inc.:
TER Scores
- Altman Z-Score: 19.49, indicating a safe zone with low bankruptcy risk.
- Piotroski Score: 5, reflecting average financial strength.
INDI Scores
- Altman Z-Score: 0.12, indicating distress zone with high bankruptcy risk.
- Piotroski Score: 2, reflecting very weak financial strength.
Which company has the best scores?
Teradyne, Inc. has significantly stronger financial scores, with a high Altman Z-Score in the safe zone and an average Piotroski Score. indie Semiconductor, Inc. shows distress in its Altman Z-Score and a very weak Piotroski Score.
Grades Comparison
The following section compares the recent grades and rating trends for Teradyne, Inc. and indie Semiconductor, Inc.:
Teradyne, Inc. Grades
This table summarizes the latest grades issued by notable grading companies for Teradyne, Inc.:
| Grading Company | Action | New Grade | Date |
|---|---|---|---|
| Stifel | Maintain | Buy | 2026-01-14 |
| B of A Securities | Maintain | Buy | 2026-01-13 |
| Goldman Sachs | Upgrade | Buy | 2025-12-16 |
| Stifel | Upgrade | Buy | 2025-12-02 |
| Citigroup | Maintain | Buy | 2025-11-12 |
| JP Morgan | Maintain | Neutral | 2025-10-30 |
| UBS | Maintain | Buy | 2025-10-30 |
| Goldman Sachs | Maintain | Sell | 2025-10-30 |
| Evercore ISI Group | Maintain | Outperform | 2025-10-30 |
| Stifel | Maintain | Hold | 2025-10-28 |
Teradyne, Inc. exhibits a generally positive rating trend with multiple upgrades to Buy and sustained Buy ratings, though some diversity exists with Neutral, Hold, and Sell grades reflecting varying analyst views.
indie Semiconductor, Inc. Grades
This table presents the most recent grades from recognized grading companies for indie Semiconductor, Inc.:
| Grading Company | Action | New Grade | Date |
|---|---|---|---|
| UBS | Maintain | Neutral | 2025-11-10 |
| Benchmark | Maintain | Buy | 2025-06-25 |
| Benchmark | Maintain | Buy | 2025-06-11 |
| Benchmark | Maintain | Buy | 2025-05-21 |
| Benchmark | Maintain | Buy | 2025-05-13 |
| Craig-Hallum | Maintain | Buy | 2025-05-13 |
| Keybanc | Maintain | Overweight | 2025-05-13 |
| Benchmark | Maintain | Buy | 2025-04-09 |
| Benchmark | Maintain | Buy | 2025-02-21 |
| Keybanc | Maintain | Overweight | 2025-02-21 |
indie Semiconductor, Inc. shows consistent Buy and Overweight ratings, mostly from Benchmark and Keybanc, with a single Neutral rating by UBS, indicating a generally favorable outlook.
Which company has the best grades?
Teradyne, Inc. and indie Semiconductor, Inc. both carry a consensus “Buy” rating, but Teradyne’s grades exhibit a broader range of analyst opinions, including some Holds and a Sell, while indie Semiconductor maintains a more uniformly positive rating profile. This difference may influence investor perception of risk and confidence in each company’s outlook.
Strengths and Weaknesses
Below is a comparison table highlighting the key strengths and weaknesses of Teradyne, Inc. (TER) and indie Semiconductor, Inc. (INDI) based on the most recent financial and operational data.
| Criterion | Teradyne, Inc. (TER) | indie Semiconductor, Inc. (INDI) |
|---|---|---|
| Diversification | Broad product and service segments, including industrial automation and semiconductor test, with over $2.8B total revenue in 2024. | Less diversified, primarily focused on semiconductors and related services, with $216M total revenue in 2024. |
| Profitability | Strong profitability: 19.2% net margin, 17.25% ROIC, and favorable ROE; creates value with positive ROIC vs. WACC gap. | Negative profitability: -61.2% net margin, -19.25% ROIC, shedding value with ROIC far below WACC. |
| Innovation | Established player with consistent investment in technology; slightly declining ROIC trend suggests challenges in sustaining growth. | Early-stage with heavy losses and declining ROIC, indicating difficulties in turning innovation into profitability. |
| Global presence | Large global footprint supported by diverse industrial and semiconductor markets. | Smaller scale and likely limited global reach compared to TER. |
| Market Share | Significant market share in semiconductor test equipment and industrial automation sectors. | Niche player with limited market share and scale. |
In summary, Teradyne demonstrates solid profitability and a diversified portfolio, though it faces a declining ROIC trend signaling caution. indie Semiconductor struggles with profitability and scale, presenting higher risk but potential for growth if it can improve efficiency and market position. Investors should weigh these factors carefully considering risk tolerance.
Risk Analysis
Below is a comparative table of key risks for Teradyne, Inc. (TER) and indie Semiconductor, Inc. (INDI) based on the most recent data from 2024.
| Metric | Teradyne, Inc. (TER) | indie Semiconductor, Inc. (INDI) |
|---|---|---|
| Market Risk | Beta 1.835, exposed to semiconductor cyclicality and tech demand fluctuations | Beta 2.54, higher volatility reflecting smaller market cap and emerging status |
| Debt level | Very low debt-to-equity (0.03), strong interest coverage (170.8) | High debt-to-equity (0.95), negative interest coverage (-14.8), financial strain |
| Regulatory Risk | Moderate, operating globally with standard tech regulatory compliance | Elevated, automotive semiconductor sector faces strict safety and emission regulations |
| Operational Risk | Diversified segments reduce single-point failure risk | Concentrated in automotive semiconductors, risk from supply chain and tech adoption delays |
| Environmental Risk | Moderate, industrial automation and manufacturing impact | Potentially higher due to automotive electrification supply chain and materials sourcing |
| Geopolitical Risk | Moderate, global supply chain exposure but diversified | High, reliance on global automotive markets and chip supply amid geopolitical tensions |
Synthesis: Teradyne’s most impactful risks stem from market cyclicality and moderate regulatory challenges, yet its strong financial health and low debt mitigate bankruptcy risk. indie Semiconductor faces higher financial distress with significant debt and operational concentration, making market volatility and geopolitical factors the most critical risks for investors to monitor.
Which Stock to Choose?
Teradyne, Inc. (TER) shows a generally favorable income evolution with a 5.36% revenue growth in 2024, strong profitability indicators, and a robust financial profile including a current ratio of 2.91, low debt, and a very favorable rating of B+. Its ROIC exceeds WACC, signaling value creation despite a declining trend.
Indie Semiconductor, Inc. (INDI) presents mixed income results with negative net margin and declining revenues in 2024, unfavorable profitability metrics, and higher leverage. The company’s financial ratios are mostly unfavorable, reflected in a very unfavorable rating of C-. Its ROIC is below WACC, indicating value destruction and decreasing profitability.
Investors with a risk-tolerant or growth-oriented profile might find Indie Semiconductor’s high R&D focus and potential for turnaround appealing, while those prioritizing financial stability and consistent value creation may view Teradyne’s strong ratios and favorable rating as more aligned with quality investing preferences.
Disclaimer: Investment carries a risk of loss of initial capital. The past performance is not a reliable indicator of future results. Be sure to understand risks before making an investment decision.
Go Further
I encourage you to read the complete analyses of Teradyne, Inc. and indie Semiconductor, Inc. to enhance your investment decisions: