Investors seeking growth and stability often weigh options across diverse industrial sectors. Teradyne, Inc. (TER) excels in semiconductor testing and automation, driving innovation in technology hardware, while Hillenbrand, Inc. (HI) operates as a diversified industrial machinery company with a broad portfolio spanning process solutions and consumer products. This comparison highlights their unique market positions and innovation approaches to help you decide which company could best enhance your investment portfolio.
Table of contents
Companies Overview
I will begin the comparison between Teradyne, Inc. and Hillenbrand, Inc. by providing an overview of these two companies and their main differences.
Teradyne, Inc. Overview
Teradyne, Inc. designs, develops, manufactures, and supports automatic test equipment globally. Operating in semiconductor test, system test, industrial automation, and wireless test segments, it serves diverse markets including automotive, communications, and consumer electronics. With a market cap of 31.4B USD and 6,500 employees, Teradyne is positioned as a key player in the technology sector focused on testing and automation solutions.
Hillenbrand, Inc. Overview
Hillenbrand, Inc. is a diversified industrial company operating in advanced process solutions, molding technology, and funeral services. It provides equipment and systems for industries such as plastics, food, automotive, and medical, along with burial and cremation products. Headquartered in Batesville, Indiana, Hillenbrand has a market cap of 2.2B USD and employs 10,450 staff, reflecting its broad industrial footprint.
Key similarities and differences
Both companies operate internationally and are listed on major US exchanges, but Teradyne focuses on technology-driven test equipment and automation, while Hillenbrand is diversified across industrial machinery and funeral services. Teradyne’s business centers on high-tech semiconductor and wireless testing, contrasting with Hillenbrand’s emphasis on process equipment and consumer-oriented memorial products, reflecting distinct industry sectors and market approaches.
Income Statement Comparison
The table below presents the most recent full fiscal year income statement metrics for Teradyne, Inc. and Hillenbrand, Inc., enabling a straightforward financial comparison.
| Metric | Teradyne, Inc. (2024) | Hillenbrand, Inc. (2025) |
|---|---|---|
| Market Cap | 31.4B | 2.2B |
| Revenue | 2.82B | 2.67B |
| EBITDA | 732M | 231M |
| EBIT | 613M | 92M |
| Net Income | 542M | 43M |
| EPS | 3.41 | 0.74 |
| Fiscal Year | 2024 | 2025 |
Income Statement Interpretations
Teradyne, Inc. experienced a general decline in revenue from 2021 to 2024, dropping from 3.7B to 2.82B, yet its net income also decreased from 1.01B to 542M over the same period. Margins showed favorable trends, with gross margin at 58.48% in 2024 and net margin improving to 19.23%. The 2024 year displayed moderate revenue growth of 5.36%, with strong margin expansion and EPS growth of 21.61%.
Hillenbrand, Inc. posted fluctuating revenue between 2021 and 2025, peaking at 3.18B in 2024 before falling to 2.67B in 2025. Net income swung dramatically from 250M in 2021, to a loss of 211M in 2024, then back to 43M in 2025. Margins varied, with a gross margin around 33.69% in 2025 and net margin near 1.61%. Despite a revenue decline of 15.99% in 2025, EBIT and net margin showed strong recovery and EPS growth over 124%.
Which one has the stronger fundamentals?
Teradyne demonstrates stronger fundamentals with mostly favorable income statement indicators, including consistent margin improvements and EPS growth, reflecting solid operational efficiency. Hillenbrand shows mixed signals, with volatile net income and revenue declines offset by recent margin recovery and significant EPS rebound. The overall stability and margin strength favor Teradyne’s financial footing.
Financial Ratios Comparison
The table below presents a side-by-side comparison of key financial ratios for Teradyne, Inc. and Hillenbrand, Inc. based on the most recent fiscal data available.
| Ratios | Teradyne, Inc. (TER) | Hillenbrand, Inc. (HI) |
|---|---|---|
| ROE | 19.2% | 3.7% |
| ROIC | 17.2% | -32.6% |
| P/E | 36.9 | 36.7 |
| P/B | 7.1 | 1.34 |
| Current Ratio | 2.91 | 1.22 |
| Quick Ratio | 1.84 | 0.88 |
| D/E | 0.027 | 1.12 |
| Debt-to-Assets | 2.1% | 35.9% |
| Interest Coverage | 166.0 | 0.55 |
| Asset Turnover | 0.76 | 0.60 |
| Fixed Asset Turnover | 4.88 | 7.80 |
| Payout ratio | 14.1% | 121.7% |
| Dividend yield | 0.38% | 3.32% |
Interpretation of the Ratios
Teradyne, Inc. shows generally strong financial ratios with favorable net margin (19.23%), ROE (19.24%), and ROIC (17.25%), supported by a solid current ratio (2.91) and low debt levels. Concerns include a high P/E ratio (36.93) and price-to-book (7.11). The company pays dividends with a modest yield of 0.38%, indicating cautious shareholder returns amidst these valuations.
Hillenbrand, Inc. displays weaker ratios, with low net margin (1.95%) and ROE (3.66%), and a negative ROIC (-32.6%). Its debt/equity ratio is high (1.12), and interest coverage is poor (0.97). Dividend yield is higher at 3.32%, but financial stress and uneven cash flow raise concerns about sustainability despite a favorable price-to-book of 1.34.
Which one has the best ratios?
Teradyne clearly outperforms Hillenbrand in profitability, liquidity, and leverage metrics, reflecting stronger operational efficiency and financial health. Hillenbrand’s unfavorable returns and debt position weigh heavily. While Teradyne’s valuation ratios appear stretched, its overall profile is more robust, resulting in a favorable ratio assessment compared to Hillenbrand’s unfavorable evaluation.
Strategic Positioning
I will now compare Teradyne and Hillenbrand’s positioning to understand their respective business strategies better.
Teradyne Positioning
Teradyne leads in semiconductor automatic test equipment with a dominant market share in semiconductor and wireless testing, facing technological disruption from evolving chip technologies. Its segments include Semiconductor Test, System Test, Industrial Automation, and Wireless Test, with the semiconductor test segment driving revenue. Recent performance shows product revenue rebounding in 2024 after prior fluctuations, while service revenue slightly declined, indicating margin and concentration risks.
Hillenbrand Positioning
Hillenbrand operates in diversified industrial machinery with three main segments: Advanced Process Solutions, Molding Technology Solutions, and Batesville funeral products. The Process Equipment Group dominates revenue, but the company has faced volatility, with recent declines in Milacron sales and shifts in segment contributions. The 2025 period shows a reduction in Milacron revenue, suggesting competitive pressure and possible margin impacts.
Teradyne vs Hillenbrand Positioning
Teradyne pursues a concentrated portfolio focused on high-tech test equipment and industrial automation, benefiting from specialization but facing technological disruption risks. Hillenbrand offers a diversified portfolio across industrial machinery and funeral services, reducing sector risk but potentially diluting focus and facing varied competitive pressures.
Stock Comparison
Over the past year, Teradyne, Inc. experienced a strong bullish trend marked by significant price appreciation and accelerating momentum, while Hillenbrand, Inc. faced a pronounced bearish trend despite recent signs of recovery in trading dynamics.
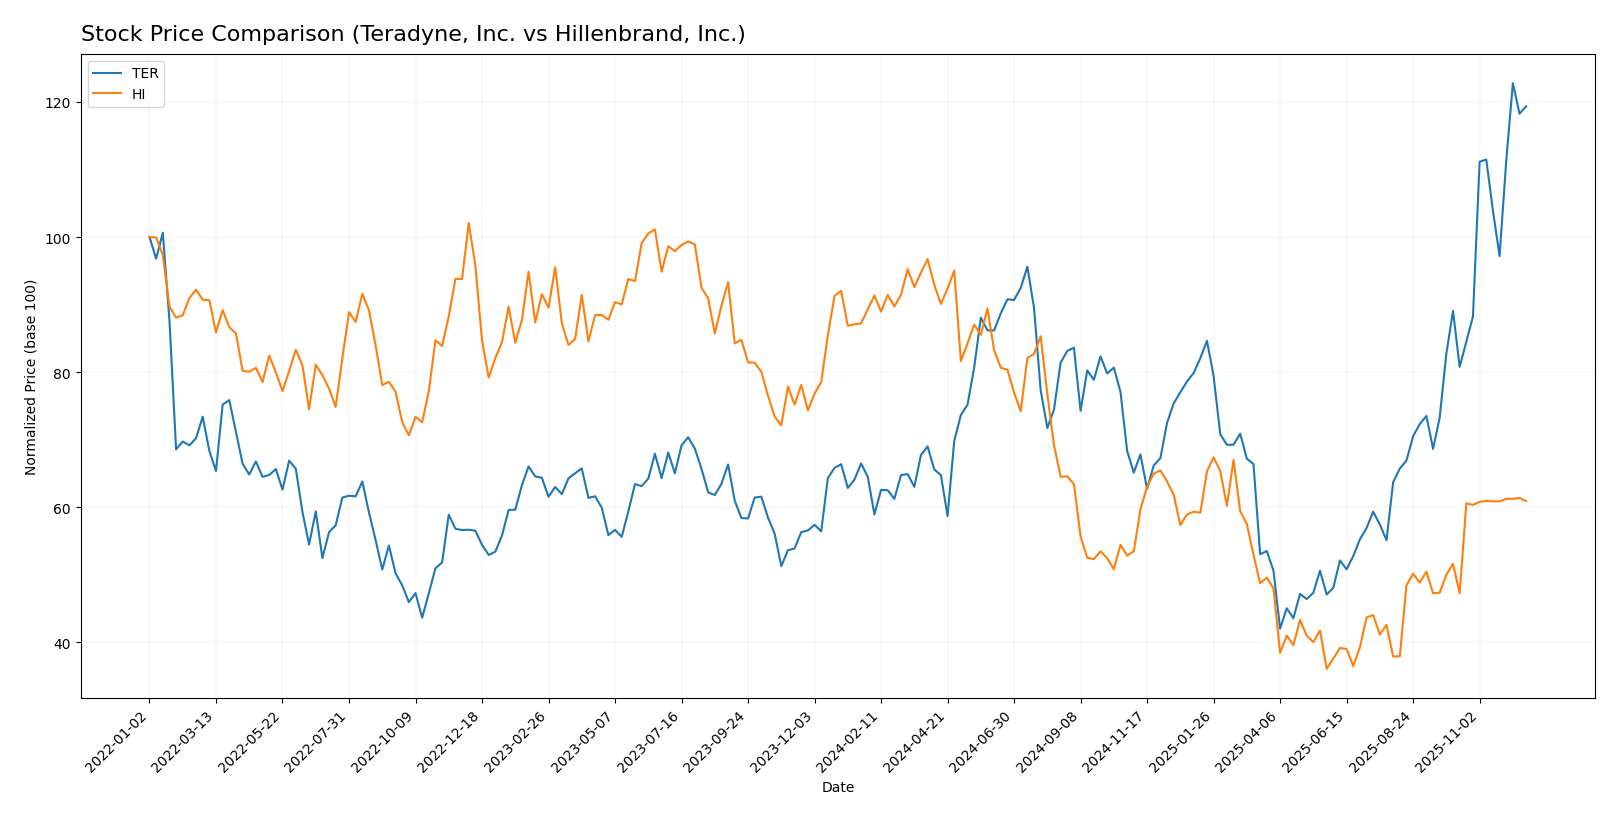
Trend Analysis
Teradyne, Inc. showed a robust 85.07% price increase over the past 12 months, indicating a bullish trend with accelerating momentum and high volatility, reaching a peak price of 200.77 and a low of 68.72. Hillenbrand, Inc. recorded a -31.81% price decline over the same period, reflecting a bearish trend with acceleration, lower volatility, and a price range between 18.75 and 50.29. Comparing the two, Teradyne delivered the highest market performance with substantial gains, while Hillenbrand’s stock underperformed despite recent upward movement.
Analyst Opinions Comparison
I will now compare Teradyne and Hillenbrand’s ratings, grades, and price targets to gauge analysts’ opinions.
Teradyne Rating
Teradyne holds a B+ rating with an overall score of 3, excelling in return on assets (5) and return on equity (4), but scoring lower on price to book (1) and price to earnings (2).
Hillenbrand Rating
Hillenbrand also has a B+ rating with an overall score of 3, showing strength in discounted cash flow (4) and price to book (4), while facing challenges in debt to equity (1) and return on equity (2).
Which one is the best rated?
Both Teradyne and Hillenbrand share an identical B+ rating and overall score of 3, with differing strengths and weaknesses, making them equally rated by analysts at this time.
Teradyne, Inc. Grades
The table below shows recent grades and rating changes from well-known financial institutions for Teradyne, Inc.
| Grading Company | Action | New Grade | Date |
|---|---|---|---|
| Goldman Sachs | Upgrade | Buy | 2025-12-16 |
| Stifel | Upgrade | Buy | 2025-12-02 |
| Citigroup | Maintain | Buy | 2025-11-12 |
| Goldman Sachs | Maintain | Sell | 2025-10-30 |
| UBS | Maintain | Buy | 2025-10-30 |
| Evercore ISI Group | Maintain | Outperform | 2025-10-30 |
| JP Morgan | Maintain | Neutral | 2025-10-30 |
| Evercore ISI Group | Maintain | Outperform | 2025-10-28 |
| Stifel | Maintain | Hold | 2025-10-28 |
| UBS | Maintain | Buy | 2025-10-20 |
Teradyne’s grades show a positive trend with multiple upgrades to Buy and consistent Outperform ratings from reliable firms.
Hillenbrand, Inc. Grades
The following table summarizes recent grades and changes from recognized grading companies for Hillenbrand, Inc.
| Grading Company | Action | New Grade | Date |
|---|---|---|---|
| DA Davidson | Maintain | Neutral | 2025-11-20 |
| DA Davidson | Maintain | Neutral | 2025-10-16 |
| CJS Securities | Downgrade | Market Perform | 2025-10-16 |
| Keybanc | Downgrade | Sector Weight | 2025-05-08 |
| DA Davidson | Maintain | Neutral | 2025-05-01 |
| DA Davidson | Maintain | Neutral | 2024-11-15 |
| Keybanc | Maintain | Overweight | 2024-11-14 |
| DA Davidson | Downgrade | Neutral | 2024-08-12 |
| DA Davidson | Maintain | Buy | 2021-02-08 |
| DA Davidson | Maintain | Buy | 2021-02-07 |
Hillenbrand’s ratings indicate a more cautious outlook with neutral and downgrades dominating recent activity.
Grades Comparison of Teradyne, Inc. and Hillenbrand, Inc.
Teradyne has received stronger and more favorable grades recently, highlighted by multiple Buy upgrades and Outperform ratings. Hillenbrand’s grades trend more towards Neutral and downgrades, suggesting a more conservative market view. Investors may perceive Teradyne as having better growth potential based on these grading patterns.
Target Prices
The current analyst target consensus presents a moderately optimistic outlook for both Teradyne, Inc. and Hillenbrand, Inc.
| Company | Target High | Target Low | Consensus |
|---|---|---|---|
| Teradyne, Inc. | 240 | 136 | 200.22 |
| Hillenbrand, Inc. | 32 | 32 | 32 |
Analysts expect Teradyne’s stock to rise modestly above its current price of $195.18, while Hillenbrand’s target is closely aligned with its current price of $31.66, indicating limited expected movement.
Strengths and Weaknesses
Below is a comparative overview of key strengths and weaknesses of Teradyne, Inc. (TER) and Hillenbrand, Inc. (HI) based on the most recent data available.
| Criterion | Teradyne, Inc. (TER) | Hillenbrand, Inc. (HI) |
|---|---|---|
| Diversification | Operates across Semiconductor Test, System Test, Industrial Automation, and Wireless Test segments, serving various industries including automotive, industrial, communications, and defense. | Diversified industrial company with segments in Advanced Process Solutions, Molding Technology Solutions, and funeral services (Batesville). |
| Profitability | Strong profitability with a net profit margin around 19.2% (2024), consistent positive margins, and solid EBIT margin (~21.7%). | Weaker profitability with fluctuating margins; net profit margin recently around 1.95% (2025 Q3) and some negative pretax margins. |
| Innovation | High innovation focus in automation and testing technologies, including advanced robotic arms and wireless test solutions. | Moderate innovation in industrial machinery and molding technologies, less focus on cutting-edge tech compared to TER. |
| Global presence | Worldwide operations with customers in various high-growth sectors globally. | International presence but primarily industrial-focused markets; less exposure to high-tech sectors. |
| Market Share | Market cap of approx. $31.4B reflects strong market positioning in semiconductor testing and automation. | Market cap around $2.2B, indicating smaller scale and market share in industrial machinery and services. |
| Debt level | Very low debt with debt-to-equity ratio ~0.03 and debt-to-assets ~2%, indicating strong balance sheet and low financial risk. | High debt levels with debt-to-equity ratio >1.1 and debt-to-assets >35%, signaling higher financial leverage and risk. |
Teradyne stands out for its strong profitability, broad technological diversification, and very low debt, making it a relatively lower-risk investment in tech-driven sectors. Hillenbrand offers diversification in industrial markets but faces challenges with profitability and carries significantly higher debt, increasing its risk profile. Investors should weigh growth potential against financial stability when considering these stocks.
Risk Analysis
Below is a comparative table outlining key risks for Teradyne, Inc. (TER) and Hillenbrand, Inc. (HI) based on the latest data available for 2025:
| Metric | Teradyne, Inc. (TER) | Hillenbrand, Inc. (HI) |
|---|---|---|
| Market Risk | High beta (1.85) indicates significant volatility in the semiconductor sector. | Moderate beta (1.40) with exposure to industrial machinery cyclicality. |
| Regulatory Risk | Moderate, driven by global semiconductor trade policies and export controls. | Moderate, affected by industry regulations and environmental compliance. |
| Operational Risk | Medium, linked to supply chain disruptions and technological innovation demands. | Medium to high, due to complex manufacturing and service segments. |
| Environmental Risk | Low to moderate, some exposure via manufacturing processes but manageable. | Moderate, with potential impact from industrial waste and sustainability mandates. |
| Geopolitical Risk | High, semiconductor supply chains sensitive to US-China tensions. | Moderate, with some international operations impacted by trade policies. |
Teradyne faces the most impactful risks from geopolitical tensions affecting semiconductor supply chains and market volatility, heightened by its high beta. Hillenbrand’s higher leverage and operational complexity increase its vulnerability to operational and environmental risks. Both require careful monitoring of regulatory developments.
Which Stock to Choose?
Teradyne, Inc. (TER) shows steady income growth with a 5.36% revenue increase and strong profitability, including a 19.23% net margin and 19.24% ROE. Its financial ratios are largely favorable, supported by low debt levels and a robust B+ rating.
Hillenbrand, Inc. (HI) faces declining income with a -15.99% revenue drop but exhibits some positive earnings growth metrics. Its financial ratios are mixed, with high debt and weaker profitability, reflected in an overall B+ rating but less favorable ratio evaluations.
Investors seeking growth might find TER’s consistent income improvement and strong profitability ratios appealing, while those tolerant of higher risk and focusing on potential turnaround scenarios could consider HI, given its mixed financials and elevated debt.
Disclaimer: Investment carries a risk of loss of initial capital. The past performance is not a reliable indicator of future results. Be sure to understand risks before making an investment decision.
Go Further
I encourage you to read the complete analyses of Teradyne, Inc. and Hillenbrand, Inc. to enhance your investment decisions: