Investors seeking growth in the technology sector often compare companies that drive innovation in software infrastructure. Wix.com Ltd. specializes in cloud-based website development platforms, enabling millions worldwide to build online presences effortlessly. Teradata Corporation offers advanced multi-cloud data analytics solutions, helping enterprises unlock value from complex data ecosystems. This article will explore both companies’ strengths to identify which offers the most compelling investment opportunity in 2026.

Table of contents
Companies Overview
I will begin the comparison between Wix.com Ltd. and Teradata Corporation by providing an overview of these two companies and their main differences.
Wix.com Ltd. Overview
Wix.com Ltd. develops and markets a cloud-based platform that enables users worldwide to create websites and web applications. Its offerings include a drag-and-drop editor, AI-driven website creation, payment solutions, and a suite of business management tools. With approximately 222M registered users and 6M premium subscriptions, Wix positions itself as a leading provider in digital infrastructure for online presence and commerce.
Teradata Corporation Overview
Teradata Corporation provides a connected multi-cloud data platform designed for enterprise analytics. Its flagship product, Teradata Vantage, integrates diverse data sources to simplify ecosystems and support cloud migration efforts. Serving clients across multiple sectors, Teradata also offers consulting and maintenance services to optimize analytical infrastructure and deliver data-driven value, operating globally from its headquarters in San Diego.
Key similarities and differences
Both Wix and Teradata operate within the software infrastructure industry, focusing on cloud-based solutions. Wix emphasizes website creation and business tools for a broad user base, while Teradata specializes in enterprise data analytics and multi-cloud integration for large organizations. The companies differ in market scale, user focus, and service scope, with Wix targeting individual and small business customers and Teradata concentrating on enterprise-level data strategies.
Income Statement Comparison
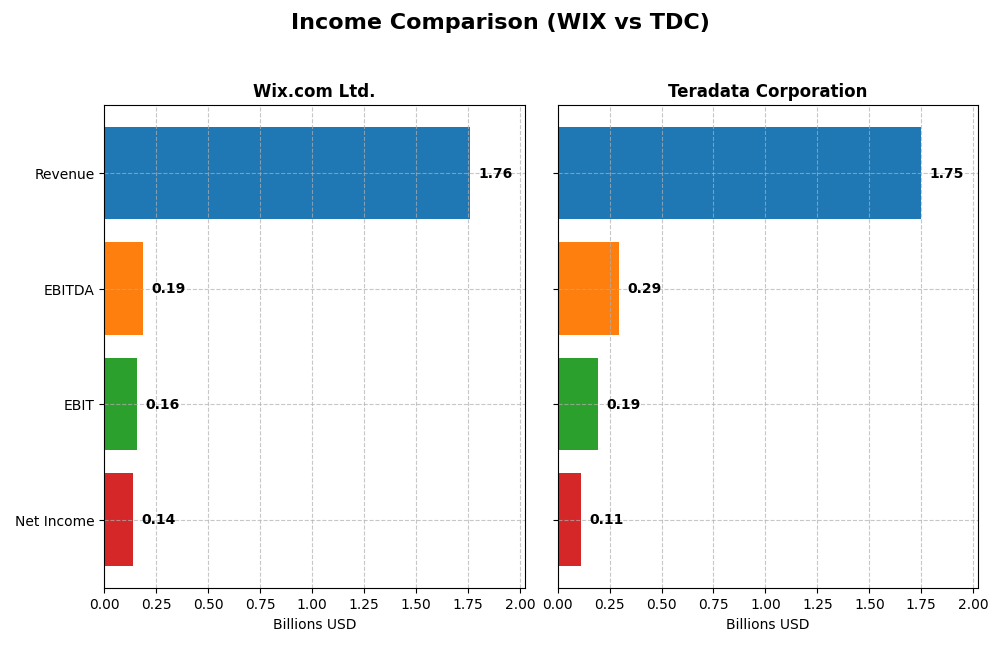
The table below presents a side-by-side comparison of key income statement metrics for Wix.com Ltd. and Teradata Corporation for the fiscal year 2024.
| Metric | Wix.com Ltd. (WIX) | Teradata Corporation (TDC) |
|---|---|---|
| Market Cap | 4.46B | 2.81B |
| Revenue | 1.76B | 1.75B |
| EBITDA | 186.2M | 293.0M |
| EBIT | 155.1M | 193.0M |
| Net Income | 138.3M | 114.0M |
| EPS | 2.49 | 1.18 |
| Fiscal Year | 2024 | 2024 |
Income Statement Interpretations
Wix.com Ltd.
Wix.com Ltd. has shown a strong upward trend in revenue, growing from 984M in 2020 to 1.76B in 2024, with net income improving from a loss of 167M in 2020 to a profit of 138M in 2024. Gross margins remained favorable around 68%, while EBIT margins stayed neutral near 8.8%. The latest year saw robust growth across revenue, EBIT, and net margin, indicating improving profitability.
Teradata Corporation
Teradata’s revenue exhibited a slight decline overall, from 1.84B in 2020 to 1.75B in 2024, with net income fluctuating but ending at 114M in 2024 down from 147M in 2021. Margins were generally stable, with gross margin at 60.5% and EBIT margin favorable at 11%. The most recent year showed a revenue decrease but improved EBIT and net margin growth, reflecting operational efficiency gains.
Which one has the stronger fundamentals?
Wix.com Ltd. demonstrates stronger fundamentals with consistent revenue and net income growth over the period, alongside favorable margin expansion and positive earnings momentum. Teradata, while maintaining solid margins, faces challenges with declining revenue and net income over the same timeframe. Wix’s higher proportion of favorable income statement metrics suggests more robust financial health.
Financial Ratios Comparison
The table below presents a side-by-side comparison of key financial ratios for Wix.com Ltd. (WIX) and Teradata Corporation (TDC) based on their most recent fiscal year data as of 2024.
| Ratios | Wix.com Ltd. (WIX) | Teradata Corporation (TDC) |
|---|---|---|
| ROE | -1.76 | 0.86 |
| ROIC | 9.13% | 16.89% |
| P/E | 86.2 | 26.3 |
| P/B | -151.4 | 22.6 |
| Current Ratio | 0.84 | 0.81 |
| Quick Ratio | 0.84 | 0.79 |
| D/E | -12.31 | 4.33 |
| Debt-to-Assets | 50.7% | 33.8% |
| Interest Coverage | 25.9 | 7.21 |
| Asset Turnover | 0.92 | 1.03 |
| Fixed Asset Turnover | 3.33 | 9.07 |
| Payout Ratio | 0 | 0 |
| Dividend Yield | 0 | 0 |
Interpretation of the Ratios
Wix.com Ltd.
Wix.com Ltd. shows a mixed ratio profile with neutral net margin (7.86%) and return on invested capital (9.13%), but an unfavorable return on equity at -175.57%, indicating struggles in generating shareholder returns. The company has a low current ratio of 0.84, suggesting liquidity concerns. Wix does not pay dividends, likely prioritizing reinvestment and growth over payouts.
Teradata Corporation
Teradata presents a stronger set of ratios with favorable return on equity (85.71%) and return on invested capital (16.89%), reflecting efficient capital use. However, it has unfavorable price-to-earnings (26.34) and price-to-book (22.58) ratios, indicating high valuation. Liquidity ratios are weak (current ratio 0.81). Teradata also does not pay dividends, focusing on growth and reinvestment.
Which one has the best ratios?
Teradata’s ratios are generally more favorable, especially in profitability and capital efficiency metrics. Wix faces challenges with negative equity returns and liquidity issues. Both lack dividend payouts, but Teradata’s stronger returns and asset turnover suggest a more robust financial position despite some valuation concerns.
Strategic Positioning
This section compares the strategic positioning of Wix.com Ltd. and Teradata Corporation, focusing on Market position, Key segments, and Exposure to technological disruption:
Wix.com Ltd.
- Market position and competitive pressure: Operates a cloud-based website and app creation platform globally, facing competitive pressure in software infrastructure.
- Key segments and business drivers: Revenue mainly from Creative Subscription and Business Solutions, serving individual and small business users worldwide.
- Exposure to technological disruption: Provides AI tools and integrated services to adapt; faces ongoing cloud and analytics technology evolution risks.
Teradata Corporation
- Market leader in multi-cloud data platforms for enterprise analytics, competing in a mature software infrastructure market.
- Revenue driven by Consulting Services, Recurring Product and Service segments, serving large enterprises across multiple industries.
- Focuses on multi-cloud analytics and ecosystem simplification; exposed to rapid changes in enterprise data technology.
Wix.com Ltd. vs Teradata Corporation Positioning
Wix.com Ltd. focuses on diversified services for individual creators and small businesses, leveraging AI and user-friendly tools. Teradata concentrates on enterprise analytics with consulting and multi-cloud platforms, targeting large organizations and complex data needs. Wix’s broad consumer base contrasts with Teradata’s specialized enterprise focus.
Which has the best competitive advantage?
Teradata shows a very favorable moat with ROIC well above WACC and growing profitability, indicating a durable competitive advantage. Wix.com Ltd. has a slightly unfavorable moat, shedding value despite improving profitability, suggesting weaker competitive defensibility.
Stock Comparison
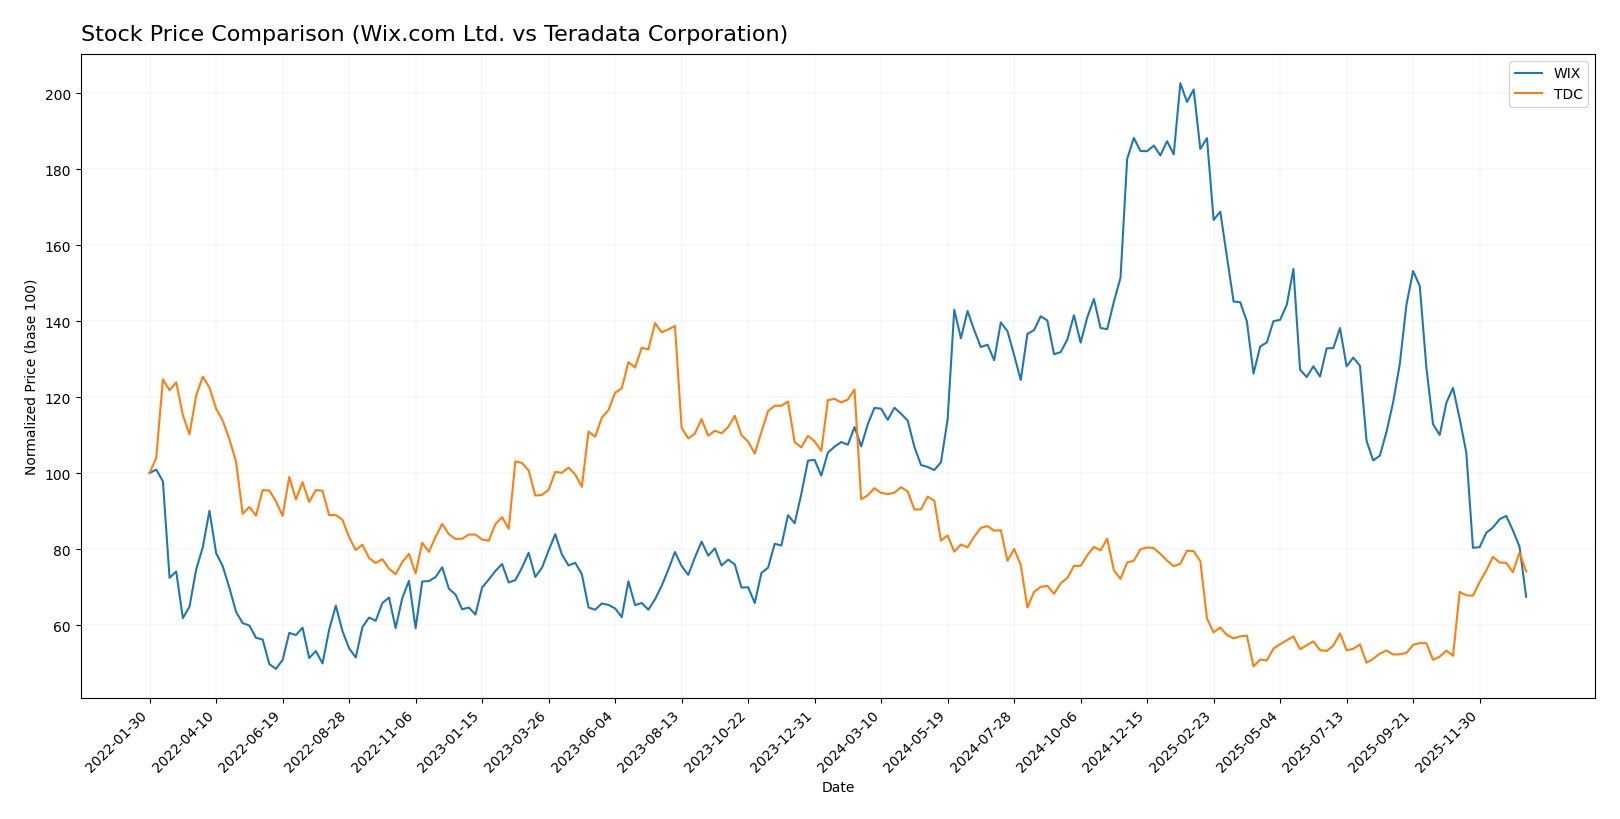
The stock price movements of Wix.com Ltd. and Teradata Corporation over the past 12 months reveal contrasting bearish trends, with Wix experiencing sharper declines and higher volatility compared to Teradata’s more moderate losses and recent recovery.
Trend Analysis
Wix.com Ltd. shows a bearish trend with a -40.28% price change over the past year, marked by deceleration and high volatility (std deviation 34.39). The stock peaked at 240.89 and bottomed at 80.16.
Teradata Corporation also experienced a bearish trend with a -21.26% price change over the year but shows acceleration and less volatility (std deviation 5.63). The stock ranged between 38.67 and 19.73, with a recent bullish reversal of +42.78%.
Comparing both, Wix’s stock delivered the lowest market performance with a steeper decline, while Teradata’s trend shows recovery, resulting in relatively better returns over the analyzed period.
Target Prices
Analysts present a clear consensus on target prices for Wix.com Ltd. and Teradata Corporation, indicating potential upside from current levels.
| Company | Target High | Target Low | Consensus |
|---|---|---|---|
| Wix.com Ltd. | 210 | 70 | 160.27 |
| Teradata Corporation | 35 | 27 | 31 |
Wix.com Ltd.’s consensus target price of 160.27 USD is about double its current price of 80.16 USD, suggesting strong growth expectations. Teradata’s consensus at 31 USD is slightly above its current price of 29.77 USD, indicating modest upside potential.
Analyst Opinions Comparison
This section compares analysts’ ratings and financial scores for Wix.com Ltd. and Teradata Corporation:
Rating Comparison
WIX Rating
- Rating: C, assessed as Very Favorable overall.
- Discounted Cash Flow Score: 3, considered Moderate.
- ROE Score: 1, marked Very Unfavorable for efficiency.
- ROA Score: 4, judged Favorable for asset utilization.
- Debt To Equity Score: 1, identified as Very Unfavorable.
TDC Rating
- Rating: B+, assessed as Very Favorable overall.
- Discounted Cash Flow Score: 4, evaluated as Favorable.
- ROE Score: 5, regarded as Very Favorable for profitability.
- ROA Score: 4, also regarded Favorable for asset utilization.
- Debt To Equity Score: 1, also identified as Very Unfavorable.
Which one is the best rated?
Teradata Corporation (TDC) holds a higher overall rating (B+) and stronger scores in discounted cash flow and return on equity compared to Wix.com Ltd. (WIX), indicating a generally more favorable analyst assessment based on the provided data.
Scores Comparison
Here is a comparison of the Altman Z-Score and Piotroski Score for Wix.com Ltd. and Teradata Corporation:
WIX Scores
- Altman Z-Score: 1.83, indicating a grey zone risk.
- Piotroski Score: 6, reflecting average financial health.
TDC Scores
- Altman Z-Score: 0.81, indicating distress zone risk.
- Piotroski Score: 8, reflecting very strong financial health.
Which company has the best scores?
Teradata shows a lower Altman Z-Score, indicating higher bankruptcy risk, but has a stronger Piotroski Score than Wix. Wix’s Altman score is better, while Teradata’s Piotroski score is superior.
Grades Comparison
An overview of recent grades and rating trends for Wix.com Ltd. and Teradata Corporation reveals the following:
Wix.com Ltd. Grades
The table below summarizes recent grades assigned by reputable grading companies for Wix.com Ltd.:
| Grading Company | Action | New Grade | Date |
|---|---|---|---|
| Morgan Stanley | Maintain | Overweight | 2026-01-15 |
| Wells Fargo | Maintain | Overweight | 2025-12-19 |
| Cantor Fitzgerald | Maintain | Overweight | 2025-12-11 |
| Wells Fargo | Maintain | Overweight | 2025-11-20 |
| Barclays | Maintain | Overweight | 2025-11-20 |
| Citizens | Maintain | Market Outperform | 2025-11-20 |
| Citigroup | Maintain | Buy | 2025-11-20 |
| Scotiabank | Maintain | Sector Outperform | 2025-11-20 |
| Needham | Maintain | Buy | 2025-11-20 |
| Evercore ISI Group | Maintain | Outperform | 2025-11-20 |
Overall, Wix.com Ltd. shows a consistent pattern of positive ratings, mainly “Overweight,” “Buy,” and “Outperform,” indicating a generally favorable analyst outlook.
Teradata Corporation Grades
The table below summarizes recent grades assigned by reputable grading companies for Teradata Corporation:
| Grading Company | Action | New Grade | Date |
|---|---|---|---|
| Barclays | Maintain | Underweight | 2026-01-12 |
| RBC Capital | Maintain | Sector Perform | 2026-01-05 |
| Morgan Stanley | Maintain | Overweight | 2025-12-17 |
| Citizens | Upgrade | Market Outperform | 2025-11-10 |
| Barclays | Maintain | Underweight | 2025-11-05 |
| TD Cowen | Maintain | Hold | 2025-11-05 |
| Evercore ISI Group | Maintain | Outperform | 2025-11-05 |
| UBS | Maintain | Neutral | 2025-08-06 |
| Guggenheim | Maintain | Buy | 2025-05-07 |
| Barclays | Maintain | Underweight | 2025-04-21 |
Teradata Corporation exhibits a mixed rating profile, with several “Underweight” grades offset by some “Buy,” “Outperform,” and “Market Outperform” ratings, reflecting a more cautious analyst sentiment.
Which company has the best grades?
Wix.com Ltd. has consistently received more favorable grades, predominantly “Overweight,” “Buy,” and “Outperform,” compared to Teradata Corporation’s mixed ratings including several “Underweight” assessments. This suggests a stronger analyst confidence in Wix.com Ltd., which could influence investor perceptions and portfolio decisions accordingly.
Strengths and Weaknesses
Below is a comparison table highlighting key strengths and weaknesses of Wix.com Ltd. (WIX) and Teradata Corporation (TDC) based on their latest financial and operational data.
| Criterion | Wix.com Ltd. (WIX) | Teradata Corporation (TDC) |
|---|---|---|
| Diversification | Moderate: Business Solutions (495.7M) and Creative Subscription (1.26B) revenue streams | High: Multiple recurring revenue streams including Consulting (248M), Product & Services (1.48B), and Subscription Software Licenses (289M) |
| Profitability | Neutral net margin (7.9%), negative ROE (-175.6%), ROIC near WACC (9.13% vs. 9.35%) | Neutral net margin (6.5%), strong ROE (85.7%), ROIC well above WACC (16.9% vs. 5.85%) |
| Innovation | Growing ROIC trend (+159%), slightly unfavorable moat due to value destruction | Strong growing ROIC (+370%), very favorable moat indicating durable competitive advantage |
| Global presence | Moderate, primarily digital platform-based | Extensive, with significant international revenue streams and consulting services |
| Market Share | Leading in creative subscription space but limited by high valuation (PE 86.2) | Strong in data analytics market, reasonable valuation (PE 26.3), though some unfavorable debt ratios |
Key takeaways: Teradata shows a more robust value creation profile with favorable profitability and durable competitive advantages. Wix demonstrates growth potential but faces challenges in profitability and capital efficiency. Investors should weigh innovation and market positioning against financial health and valuation risks.
Risk Analysis
Below is a comparative table outlining key risks for Wix.com Ltd. (WIX) and Teradata Corporation (TDC) based on the most recent data from 2024.
| Metric | Wix.com Ltd. (WIX) | Teradata Corporation (TDC) |
|---|---|---|
| Market Risk | High beta (1.42) indicates higher volatility and sensitivity to market swings. | Lower beta (0.57) suggests more stability against market fluctuations. |
| Debt level | Elevated debt-to-assets ratio at 50.7%, signaling higher leverage risk. | Moderate debt-to-assets at 33.8%, more balanced leverage position. |
| Regulatory Risk | Moderate, given international operations and tech sector compliance demands. | Moderate, due to global presence and data regulations in multiple sectors. |
| Operational Risk | Exposure from platform and cloud service reliability, plus competition. | Risks tied to cloud migration success and integration of multi-cloud services. |
| Environmental Risk | Low direct impact; minimal environmental footprint typical for software firms. | Low; similar software infrastructure profile with limited environmental exposure. |
| Geopolitical Risk | Based in Israel, with potential regional geopolitical tensions. | US-based, subject to trade and geopolitical policies affecting technology exports. |
In synthesis, Wix.com faces significant market volatility and high leverage, with its beta and debt ratios indicating elevated financial risk. Teradata shows stronger financial stability but must manage operational complexities in cloud services. Geopolitical risks are more pronounced for Wix due to its regional base. Investors should weigh Wix’s growth potential against these risks, while Teradata’s steadier profile may appeal to more risk-averse portfolios.
Which Stock to Choose?
Wix.com Ltd. (WIX) shows a favorable income evolution with 12.74% revenue growth in 2024 and a strong 182.89% net income increase over five years. Financial ratios are slightly unfavorable overall, with a negative ROE of -175.57% and a high PE ratio of 86.21. Profitability margins are mostly favorable, but the company carries significant debt at 50.7% debt-to-assets. Its rating is very favorable, though some key financial scores are moderate or unfavorable.
Teradata Corporation (TDC) displays a mixed income evolution, with a slight revenue decline of -4.53% in 2024 and an overall negative net income growth of -11.63% over five years. Financial ratios present a neutral global opinion, supported by a favorable ROE of 85.71% and ROIC of 16.89%. Profitability is solid with an 11.03% EBIT margin, and debt levels are moderate at 33.8% debt-to-assets. TDC holds a very favorable rating, with strong return scores but some unfavorable valuation metrics.
For investors prioritizing value creation and financial strength, TDC’s very favorable moat with ROIC well above WACC and strong return ratios might appear more attractive. Conversely, WIX’s impressive income growth and improving profitability could be seen as suitable for growth-oriented profiles despite its higher financial risk. The choice could depend on whether the investor prefers a stable, value-creating company or one with higher growth potential but greater financial challenges.
Disclaimer: Investment carries a risk of loss of initial capital. The past performance is not a reliable indicator of future results. Be sure to understand risks before making an investment decision.
Go Further
I encourage you to read the complete analyses of Wix.com Ltd. and Teradata Corporation to enhance your investment decisions: