In today’s fast-evolving technology landscape, selecting the right software infrastructure company is crucial for investors aiming to capitalize on data-driven innovation. Teradata Corporation and Veritone, Inc. stand out as key players, each offering advanced platforms focused on enterprise analytics and artificial intelligence. Their overlapping markets and distinct innovation strategies make them worthy of comparison. Join me as we explore which company holds the most promise for your investment portfolio in 2026.
Table of contents
Companies Overview
I will begin the comparison between Teradata Corporation and Veritone, Inc. by providing an overview of these two companies and their main differences.
Teradata Corporation Overview
Teradata Corporation provides a connected multi-cloud data platform aimed at enterprise analytics, enabling companies to leverage and integrate data across various sources. Its flagship product, Teradata Vantage, supports businesses in cloud migration and ecosystem simplification. Established in 1979 and headquartered in San Diego, Teradata serves multiple sectors including financial services, government, healthcare, and telecommunications, employing approximately 5,700 people.
Veritone, Inc. Overview
Veritone, Inc. offers artificial intelligence computing solutions through its aiWARE platform, which utilizes machine learning and cognitive processes to extract insights from structured and unstructured data. Founded in 2014 and based in Denver, the company targets verticals such as media, government, legal, and energy. Veritone also provides media advertising services, leveraging AI to support campaign strategy and analytics, with a workforce of about 470 employees.
Key similarities and differences
Both Teradata and Veritone operate in the technology sector focusing on software infrastructure, but their core offerings differ: Teradata specializes in multi-cloud data platforms for enterprise analytics, while Veritone centers on AI-driven insights and media services. Teradata’s business model is enterprise-focused with a broad sector reach, whereas Veritone targets specific vertical markets with AI applications. The companies also differ significantly in scale, with Teradata having a larger market capitalization and workforce compared to Veritone.
Income Statement Comparison
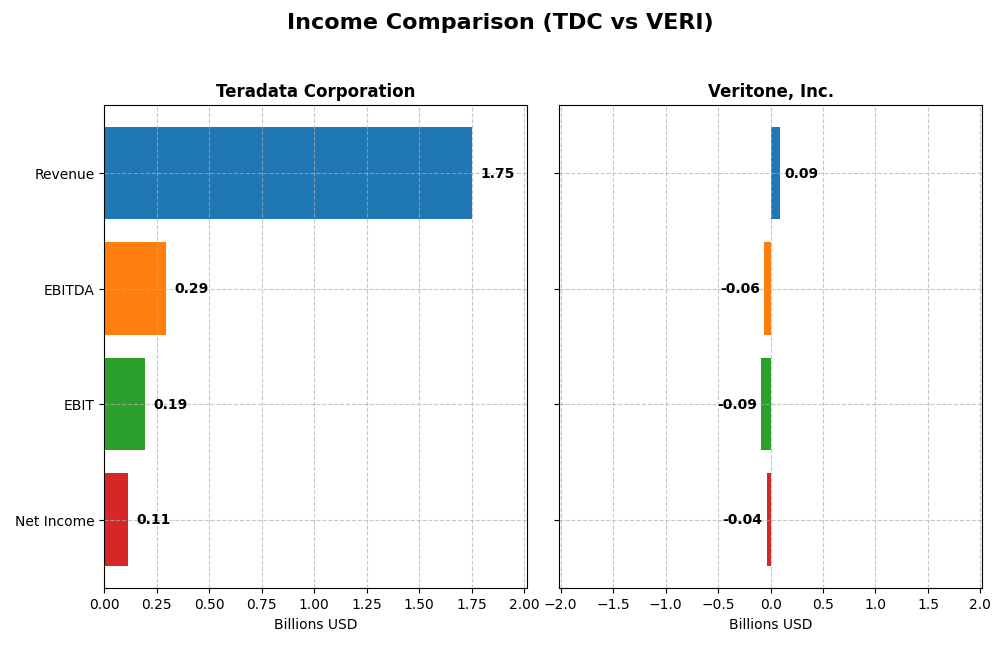
Below is a side-by-side comparison of key income statement metrics for Teradata Corporation and Veritone, Inc. for the fiscal year 2024.
| Metric | Teradata Corporation (TDC) | Veritone, Inc. (VERI) |
|---|---|---|
| Market Cap | 2.81B | 225M |
| Revenue | 1.75B | 93M |
| EBITDA | 293M | -59M |
| EBIT | 193M | -88M |
| Net Income | 114M | -37M |
| EPS | 1.18 | -0.98 |
| Fiscal Year | 2024 | 2024 |
Income Statement Interpretations
Teradata Corporation
Teradata’s revenue declined slightly from $1.92B in 2021 to $1.75B in 2024, with net income also fluctuating, peaking at $147M in 2021 and settling at $114M in 2024. Margins remained stable, with a gross margin around 60% and improving EBIT and net margins in the latest year. The 2024 performance showed slower revenue but stronger profitability and EPS growth.
Veritone, Inc.
Veritone’s revenue grew significantly over the period, from $58M in 2020 to $93M in 2024, despite a recent 7.35% decline. Net losses narrowed from -$48M in 2020 to -$37M in 2024. While gross margin remained high above 70%, EBIT and net margins stayed negative. The latest year showed margin improvement and EPS growth, although profitability remains a challenge.
Which one has the stronger fundamentals?
Teradata demonstrates stronger fundamentals with consistent profitability, stable margins, and positive net income despite revenue contraction. Veritone shows promising revenue growth and margin improvements but remains unprofitable with negative EBIT and net margins. Teradata’s favorable interest expense and net margin metrics contrast with Veritone’s higher financial costs and losses.
Financial Ratios Comparison
The table below compares the latest available financial ratios for Teradata Corporation and Veritone, Inc. as of fiscal year 2024.
| Ratios | Teradata Corporation (TDC) | Veritone, Inc. (VERI) |
|---|---|---|
| ROE | 85.7% | -277.9% |
| ROIC | 16.9% | -58.3% |
| P/E | 26.3 | -3.34 |
| P/B | 22.6 | 9.27 |
| Current Ratio | 0.81 | 0.97 |
| Quick Ratio | 0.79 | 0.97 |
| D/E | 4.33 | 8.91 |
| Debt-to-Assets | 33.8% | 60.5% |
| Interest Coverage | 7.21 | -7.31 |
| Asset Turnover | 1.03 | 0.47 |
| Fixed Asset Turnover | 9.07 | 8.51 |
| Payout ratio | 0 | 0 |
| Dividend yield | 0 | 0 |
Interpretation of the Ratios
Teradata Corporation
Teradata’s 2024 ratios show strengths in return on equity (85.71%) and return on invested capital (16.89%), supported by favorable interest coverage and asset turnover, indicating efficient use of capital and manageable debt. However, the company faces concerns with a low current ratio (0.81) and high price-to-book (22.58) and price-to-earnings (26.34) ratios. Teradata does not pay dividends, likely focusing on reinvestment and growth strategies instead.
Veritone, Inc.
Veritone’s 2024 ratios reveal significant weaknesses, including a deeply negative net margin (-40.36%), return on equity (-277.91%), and return on invested capital (-58.27%), accompanied by poor interest coverage and high debt levels. Asset turnover is low despite a favorable fixed asset turnover. The current ratio below 1 (0.97) also signals liquidity risks. Veritone does not pay dividends, reflecting ongoing losses and a focus on development or acquisitions.
Which one has the best ratios?
Teradata exhibits a more balanced financial profile with several favorable ratios, particularly in profitability and capital returns, despite some liquidity and valuation drawbacks. Conversely, Veritone’s ratios are predominantly unfavorable, highlighting operational challenges and financial instability. Overall, Teradata’s ratios present a more neutral and stable position compared to Veritone’s very unfavorable assessment.
Strategic Positioning
This section compares the strategic positioning of Teradata Corporation and Veritone, Inc. regarding market position, key segments, and exposure to technological disruption:
Teradata Corporation
- Established global player in enterprise analytics with steady demand; moderate competitive pressure.
- Focuses on multi-cloud data platforms, consulting, and recurring services across diverse sectors.
- Operates a mature data platform business with incremental cloud integration; moderate disruption risks.
Veritone, Inc.
- Smaller market cap with higher volatility; competes in AI computing solutions with intense competition.
- Specializes in AI operating systems and media advertising services, targeting media, government, and energy.
- Exposed to rapid AI advancements; relies heavily on evolving machine learning technologies and media services.
Teradata Corporation vs Veritone, Inc. Positioning
Teradata pursues a diversified strategy with broad industry coverage and multi-cloud solutions, offering stable revenues and consulting services. Veritone focuses narrowly on AI-driven platforms and media advertising, facing higher market volatility but positioned in a fast-evolving tech niche.
Which has the best competitive advantage?
Teradata shows a very favorable MOAT with growing ROIC and value creation, indicating durable competitive advantage. Veritone exhibits a very unfavorable MOAT with declining ROIC and value destruction, suggesting weaker competitive positioning.
Stock Comparison
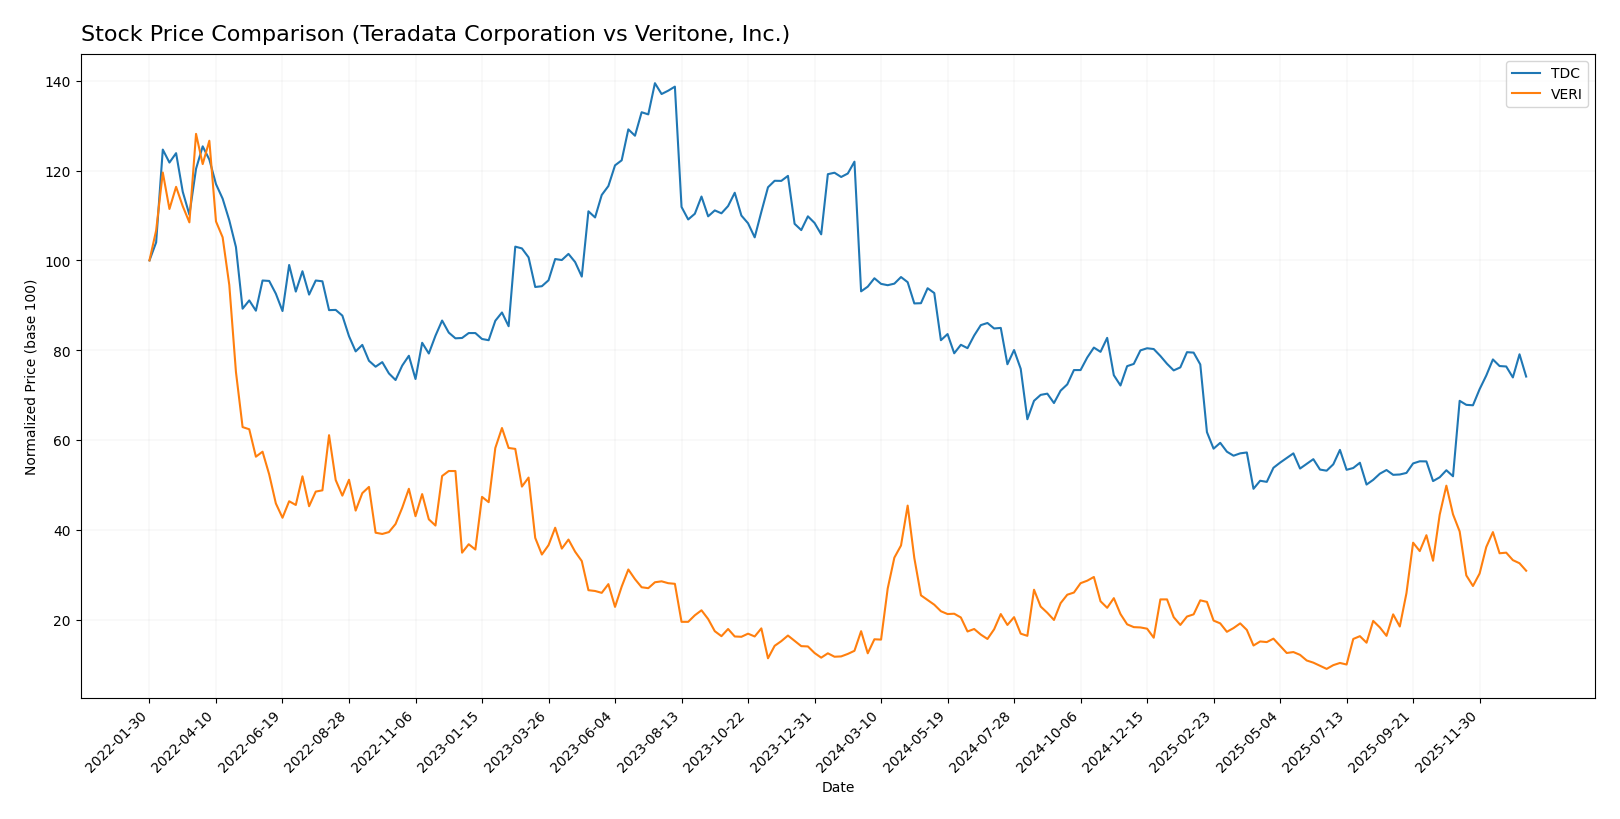
The stock price chart highlights contrasting dynamics over the past year, with Teradata Corporation showing an overall decline but recent recovery, while Veritone, Inc. demonstrates strong growth despite recent setbacks.
Trend Analysis
Teradata Corporation’s stock experienced a bearish trend over the past 12 months with a -21.26% price change and accelerating decline, hitting a low of 19.73 and a high of 38.67. However, a recent 42.78% bullish rebound from November 2025 to January 2026 indicates a potential recovery phase.
Veritone, Inc. maintained a bullish trend with a substantial 147.22% gain over the last year but showed deceleration in momentum. Recently, it faced a -28.91% decline in the same November 2025 to January 2026 period, suggesting short-term volatility amid an overall upward trajectory.
Comparing both, Veritone, Inc. delivered the highest market performance over the year with a 147.22% gain, outperforming Teradata’s overall bearish trend despite Teradata’s recent positive momentum.
Target Prices
The current analyst consensus for Teradata Corporation and Veritone, Inc. suggests moderate upside potential.
| Company | Target High | Target Low | Consensus |
|---|---|---|---|
| Teradata Corporation | 35 | 27 | 31 |
| Veritone, Inc. | 10 | 9 | 9.5 |
Analysts expect Teradata’s stock to rise modestly from its current price of $29.77 to around $31. Veritone shows a higher target relative to its current $4.45 price, indicating significant upside potential.
Analyst Opinions Comparison
This section compares analysts’ ratings and grades for Teradata Corporation and Veritone, Inc.:
Rating Comparison
Teradata Corporation Rating
- Rating: B+, categorized as Very Favorable.
- Discounted Cash Flow Score: 4, indicating a Favorable outlook.
- ROE Score: 5, considered Very Favorable for profitability.
- ROA Score: 4, considered Favorable for asset utilization.
- Debt To Equity Score: 1, classified as Very Unfavorable risk.
- Overall Score: 3, indicating a Moderate overall financial standing.
Veritone, Inc. Rating
- Rating: C, categorized as Very Favorable.
- Discounted Cash Flow Score: 5, indicating a Very Favorable outlook.
- ROE Score: 1, considered Very Unfavorable for profitability.
- ROA Score: 1, considered Very Unfavorable for asset utilization.
- Debt To Equity Score: 1, classified as Very Unfavorable risk.
- Overall Score: 2, indicating a Moderate overall financial standing.
Which one is the best rated?
Teradata is better rated overall with a B+ rating and higher scores in ROE, ROA, and discounted cash flow compared to Veritone’s C rating and lower profitability and asset use scores, despite both sharing a very unfavorable debt-to-equity score.
Scores Comparison
Here is the comparison of the Altman Z-Score and Piotroski Score for the two companies:
TDC Scores
- Altman Z-Score: 0.81, indicating distress zone, high bankruptcy risk.
- Piotroski Score: 8, classified as very strong financial health.
VERI Scores
- Altman Z-Score: -0.07, indicating distress zone, very high bankruptcy risk.
- Piotroski Score: 3, classified as very weak financial health.
Which company has the best scores?
Based on the provided data, TDC shows a higher Piotroski Score indicating stronger financial health, while both are in the distress zone for Altman Z-Score. TDC’s scores suggest comparatively better financial stability than VERI.
Grades Comparison
The following presents a detailed comparison of the latest grades assigned to Teradata Corporation and Veritone, Inc.:
Teradata Corporation Grades
This table summarizes the recent grades and actions from major grading companies for Teradata Corporation.
| Grading Company | Action | New Grade | Date |
|---|---|---|---|
| Barclays | Maintain | Underweight | 2026-01-12 |
| RBC Capital | Maintain | Sector Perform | 2026-01-05 |
| Morgan Stanley | Maintain | Overweight | 2025-12-17 |
| Citizens | Upgrade | Market Outperform | 2025-11-10 |
| Barclays | Maintain | Underweight | 2025-11-05 |
| TD Cowen | Maintain | Hold | 2025-11-05 |
| Evercore ISI Group | Maintain | Outperform | 2025-11-05 |
| UBS | Maintain | Neutral | 2025-08-06 |
| Guggenheim | Maintain | Buy | 2025-05-07 |
| Barclays | Maintain | Underweight | 2025-04-21 |
Teradata’s grades show a mixed outlook, with a range from Underweight to Overweight, reflecting cautious to moderately positive views.
Veritone, Inc. Grades
This table presents the consistent buy ratings maintained by grading companies for Veritone, Inc.
| Grading Company | Action | New Grade | Date |
|---|---|---|---|
| D. Boral Capital | Maintain | Buy | 2025-12-09 |
| D. Boral Capital | Maintain | Buy | 2025-12-04 |
| Needham | Maintain | Buy | 2025-12-02 |
| D. Boral Capital | Maintain | Buy | 2025-12-02 |
| D. Boral Capital | Maintain | Buy | 2025-11-07 |
| D. Boral Capital | Maintain | Buy | 2025-10-28 |
| HC Wainwright & Co. | Maintain | Buy | 2025-10-20 |
| D. Boral Capital | Maintain | Buy | 2025-10-15 |
| D. Boral Capital | Maintain | Buy | 2025-09-24 |
| D. Boral Capital | Maintain | Buy | 2025-09-09 |
Veritone displays a strong consensus of buy ratings, consistently maintained by several grading firms over recent months.
Which company has the best grades?
Veritone, Inc. has received predominantly buy ratings, indicating stronger analyst confidence compared to Teradata Corporation’s mixed grades centered around hold and underweight. This contrast may influence investors seeking growth potential versus more cautious exposure.
Strengths and Weaknesses
Below is a comparison table summarizing key strengths and weaknesses of Teradata Corporation (TDC) and Veritone, Inc. (VERI) based on their recent financial and operational metrics.
| Criterion | Teradata Corporation (TDC) | Veritone, Inc. (VERI) |
|---|---|---|
| Diversification | High: Diverse revenue streams including recurring product/service revenue (~$1.48B) and consulting services ($248M) | Low: Concentrated in software products, managed services, and licenses with smaller total revenues (~$61M software products) |
| Profitability | Favorable: ROIC 16.9%, ROE 85.7%, positive net margin 6.51% | Unfavorable: Negative ROIC (-58%), ROE (-278%), and net margin (-40%) |
| Innovation | Strong: Consistent growth in subscription software licenses and services | Moderate: Focus on AI platform and SaaS solutions but with declining profitability |
| Global presence | Established: Significant international data and analytics revenues | Limited: Primarily focused on US market segments |
| Market Share | Solid: Large recurring revenue base and strong asset turnover (1.03) | Small: Lower asset turnover (0.47) and limited market penetration |
Key takeaways: Teradata demonstrates a durable competitive advantage with strong profitability, diverse revenue, and global reach. Veritone struggles with declining profitability and limited diversification, indicating higher risk for investors. Risk-conscious investors should favor Teradata for stability and value creation.
Risk Analysis
Below is a comparison table highlighting key risks for Teradata Corporation (TDC) and Veritone, Inc. (VERI) based on the latest data from 2024.
| Metric | Teradata Corporation (TDC) | Veritone, Inc. (VERI) |
|---|---|---|
| Market Risk | Beta 0.57 (low volatility) | Beta 2.05 (high volatility) |
| Debt level | Debt/Equity 4.33 (high) | Debt/Equity 8.91 (very high) |
| Regulatory Risk | Moderate (tech sector) | Moderate (tech + AI regulations) |
| Operational Risk | Moderate (multi-cloud platform) | High (AI solutions, evolving tech) |
| Environmental Risk | Low | Low |
| Geopolitical Risk | Moderate (global client base) | Moderate (US/UK operations) |
The most impactful risks are Veritone’s high debt load and operational challenges in a fast-evolving AI market, combined with its distressed financial health indicated by a negative Altman Z-score and weak profitability. Teradata shows lower market volatility and better operational stability but carries a significant debt burden and some liquidity concerns. Investors should weigh Veritone’s growth potential against its financial instability, while Teradata offers a more stable but moderately risky profile.
Which Stock to Choose?
Teradata Corporation (TDC) shows a favorable income statement with improving profitability, including a 6.51% net margin and strong ROE at 85.71%. Despite a slight revenue decline, it maintains a solid debt level with net debt to EBITDA at 0.53 and a very favorable rating of B+.
Veritone, Inc. (VERI) has a mixed income profile with a high gross margin of 70.58% but negative net margin at -40.36% and declining profitability metrics. It carries high debt with net debt to EBITDA at -1.75 and receives a rating of C, reflecting very unfavorable financial ratios overall.
For investors, TDC’s very favorable rating and durable competitive advantage with growing ROIC suggest it might appeal to those seeking quality and stability. VERI’s profile, marked by challenging profitability and financial distress indicators, could appear more suitable for risk-tolerant investors focused on potential turnaround or growth opportunities.
Disclaimer: Investment carries a risk of loss of initial capital. The past performance is not a reliable indicator of future results. Be sure to understand risks before making an investment decision.
Go Further
I encourage you to read the complete analyses of Teradata Corporation and Veritone, Inc. to enhance your investment decisions: