Home > Comparison > Technology > VRSN vs TDC
The strategic rivalry between VeriSign, Inc. and Teradata Corporation shapes the future of technology infrastructure. VeriSign operates as a specialized internet infrastructure provider, securing critical domain name services. Teradata delivers a connected multi-cloud data platform, enabling enterprise analytics at scale. This head-to-head pits a niche infrastructure stalwart against a broad data analytics enabler. This analysis will determine which trajectory offers superior risk-adjusted returns for a diversified portfolio in the evolving tech landscape.
Table of contents
Companies Overview
VeriSign and Teradata stand as pivotal players in the software infrastructure arena, shaping digital ecosystems globally.
VeriSign, Inc.: Guardian of Internet Navigation
VeriSign dominates the domain name registry market, securing internet navigation for .com and .net domains. Its core revenue stems from authoritative domain registration and root server operations, ensuring internet stability. In 2026, VeriSign’s strategic focus remains on enhancing security and resiliency of global internet infrastructure, underlining its critical role in e-commerce and digital trust.
Teradata Corporation: Multi-Cloud Data Platform Leader
Teradata specializes in enterprise analytics through its connected multi-cloud data platform, Teradata Vantage. It drives revenue by enabling companies to unify data sources and simplify their cloud ecosystems. Its 2026 strategy prioritizes advancing integrated migration and operationalizing analytics, supporting diverse sectors from financial services to telecommunications with a strong consulting arm.
Strategic Collision: Similarities & Divergences
Both companies operate in software infrastructure but diverge in focus—VeriSign secures foundational internet services, while Teradata enables data-driven decision-making via analytics platforms. Their competitive battleground is digital infrastructure, with VeriSign securing connectivity and Teradata optimizing data utilization. This distinction creates unique investment profiles: VeriSign offers stable internet backbone services while Teradata targets growth in enterprise cloud analytics.
Income Statement Comparison
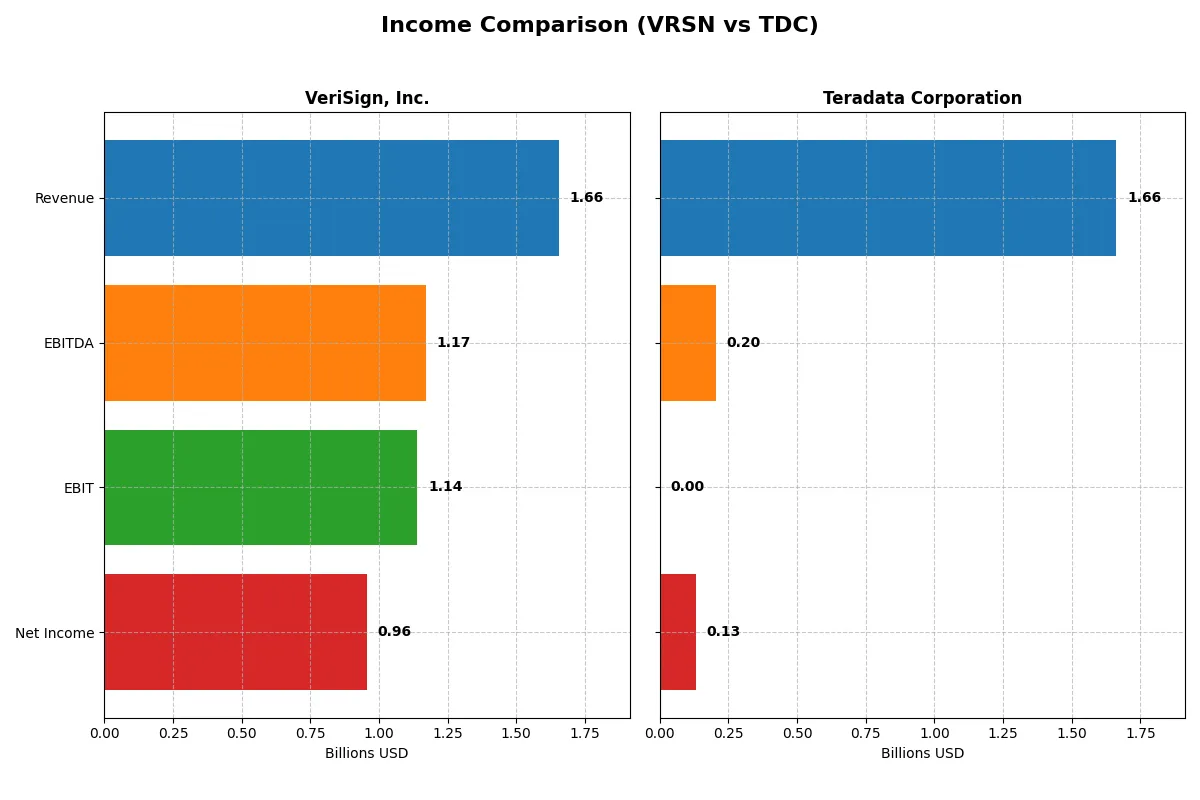
The following data dissects the core profitability and scalability of both corporate engines to reveal who dominates the bottom line:
| Metric | VeriSign, Inc. (VRSN) | Teradata Corporation (TDC) |
|---|---|---|
| Revenue | 1.66B | 1.66B |
| Cost of Revenue | 196M | 676M |
| Operating Expenses | 339M | 782M |
| Gross Profit | 1.46B | 987M |
| EBITDA | 1.17B | 205M |
| EBIT | 1.14B | 0 |
| Interest Expense | 77M | 0 |
| Net Income | 956M | 130M |
| EPS | 8.83 | 1.38 |
| Fiscal Year | 2025 | 2025 |
Income Statement Analysis: The Bottom-Line Duel
The income statement comparison reveals which company runs a more efficient and profitable business engine amid their respective market environments.
VeriSign, Inc. Analysis
VeriSign’s revenue climbed steadily to $1.66B in 2025, with net income reaching $955M, reflecting strong growth momentum. Gross margin remains robust at 88.15%, and net margin impresses at 57.68%, signaling exceptional profitability. The company sustains high operational efficiency, with EBIT margin at 68.83%, demonstrating its ability to convert revenue into earnings consistently.
Teradata Corporation Analysis
Teradata reports $1.66B in revenue for 2025 but with net income only $130M, showing a much thinner profit margin. Gross margin sits at 59.35%, healthy but far below VeriSign’s. EBIT margin is zero, indicating operational challenges. Despite a recent slight net margin increase to 7.82%, Teradata’s revenue and profits have generally declined over the past five years, highlighting efficiency and growth headwinds.
High Margin Dominance vs. Scale Struggles
VeriSign clearly outperforms Teradata in profitability and margin health, with consistently growing revenue and superior cost control. Teradata’s scale matches VeriSign’s revenue but fails to deliver comparable earnings or operational leverage. Investors seeking robust profitability and momentum find VeriSign’s profile more compelling; Teradata’s struggles reflect a riskier, less efficient business model.
Financial Ratios Comparison
These vital ratios act as a diagnostic tool to expose the underlying fiscal health, valuation premiums, and capital efficiency of the companies analyzed:
| Ratios | VeriSign, Inc. (VRSN) | Teradata Corporation (TDC) |
|---|---|---|
| ROE | -44.4% | 0.0% |
| ROIC | -716.0% | 0.0% |
| P/E | 23.5 | 22.1 |
| P/B | -10.4 | 0.0 |
| Current Ratio | 0.49 | 0.0 |
| Quick Ratio | 0.49 | 0.0 |
| D/E (Debt-to-Equity) | -0.83 | 0.0 |
| Debt-to-Assets | 136% | 0.0 |
| Interest Coverage | 14.6 | 0.0 |
| Asset Turnover | 1.25 | 0.0 |
| Fixed Asset Turnover | 7.41 | 0.0 |
| Payout ratio | 22.5% | 0.0% |
| Dividend yield | 0.96% | 0.0% |
| Fiscal Year | 2025 | 2025 |
Efficiency & Valuation Duel: The Vital Signs
Financial ratios act as a company’s DNA, revealing hidden risks and operational strengths that shape investor confidence and valuation.
VeriSign, Inc.
VeriSign shows a high net margin of 57.68%, signaling strong profitability, but a deeply negative ROE at -44.36% flags shareholder equity concerns. Its P/E ratio of 23.49 is neutral, suggesting fair valuation despite stretched capital returns. A modest 0.96% dividend yield underlines limited shareholder cash returns, with significant reinvestment in R&D driving growth.
Teradata Corporation
Teradata reports a modest 7.82% net margin, reflecting limited profitability, and zero ROE, indicating no shareholder equity return. The P/E ratio at 22.1 aligns with market norms but lacks supportive operational efficiency. Teradata pays no dividend, focusing capital on aggressive R&D (16.8% of revenue) to fuel future expansion, though several key ratios remain unfavorable.
Profitability vs. Growth Focus: Weighing Stability and Potential
VeriSign balances robust profit margins with valuation neutrality but suffers from negative returns on equity, signaling risk. Teradata’s weaker profitability and absence of dividends contrast with its heavy R&D investment, implying growth orientation but higher operational risk. Investors seeking operational efficiency might prefer VeriSign, while those favoring growth could consider Teradata’s profile.
Which one offers the Superior Shareholder Reward?
I see VeriSign (VRSN) pays a modest 0.96% dividend yield with a sustainable 22.5% payout ratio, backed by strong FCF coverage (4.6x). Teradata (TDC) pays no dividend but invests free cash flow in growth. VeriSign’s negligible buybacks contrast with Teradata’s moderate share repurchases implied by its free cash flow use. Historically, VeriSign’s consistent dividend and strong margins suggest a more reliable shareholder return. Teradata’s reinvestment strategy carries higher growth potential but greater risk. I conclude VeriSign offers a superior total return profile in 2026 due to its balanced, sustainable distribution and robust cash flow.
Comparative Score Analysis: The Strategic Profile
The radar chart reveals the fundamental DNA and trade-offs of VeriSign, Inc. and Teradata Corporation, highlighting their financial strengths and vulnerabilities:
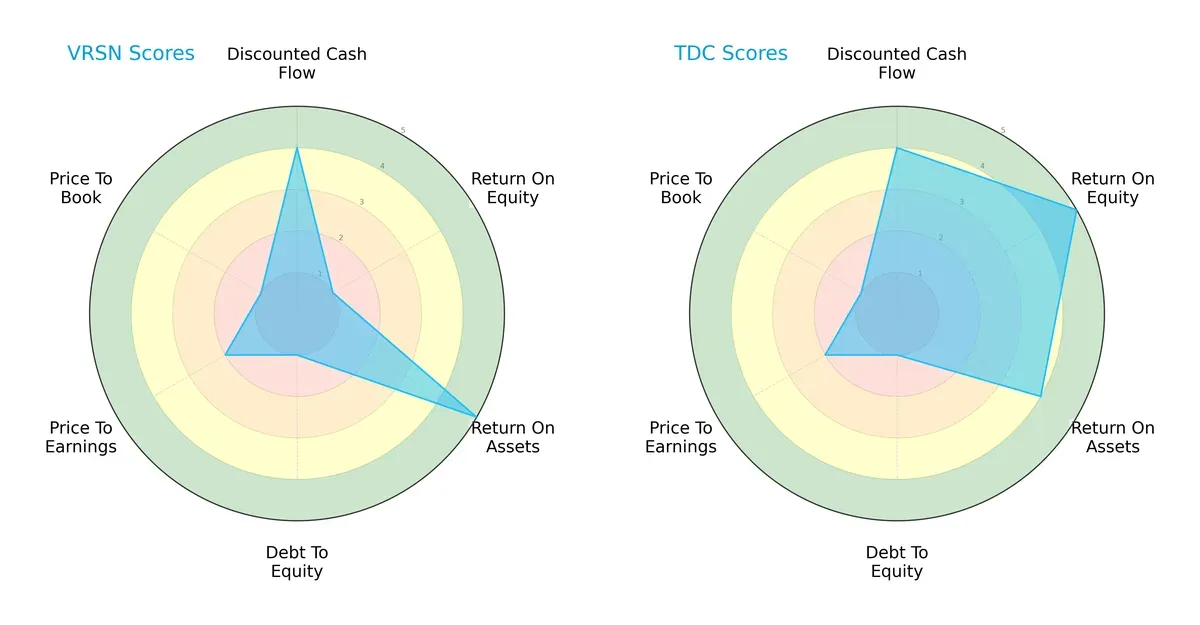
VeriSign shows strength in return on assets (5) and discounted cash flow (4) but struggles with return on equity (1) and debt-to-equity (1). Teradata offers a more balanced profile with strong return on equity (5), solid return on assets (4), and matching discounted cash flow (4). Both suffer from weak valuation scores (P/E and P/B), but Teradata edges VeriSign by delivering better profitability and overall score (3 vs. 2).
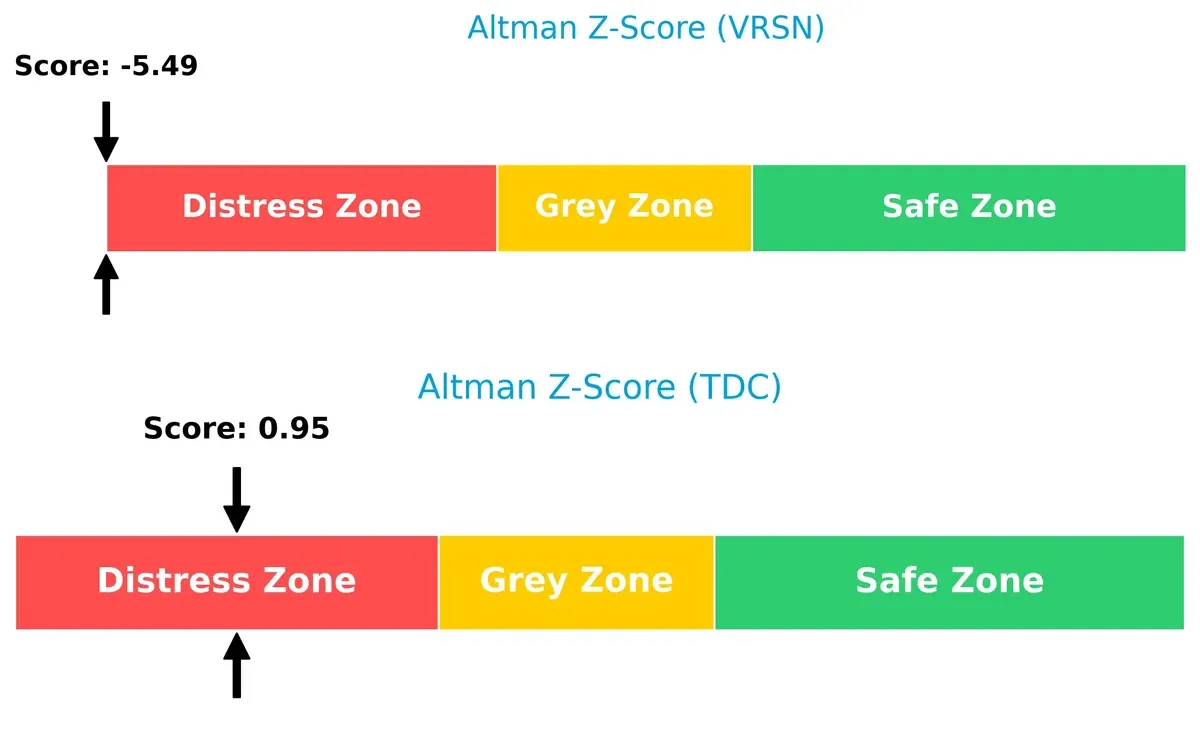
Bankruptcy Risk: Solvency Showdown
Teradata’s Altman Z-Score (0.95) slightly outperforms VeriSign’s (-5.49), yet both remain in distress zones, signaling elevated bankruptcy risk in this cycle:
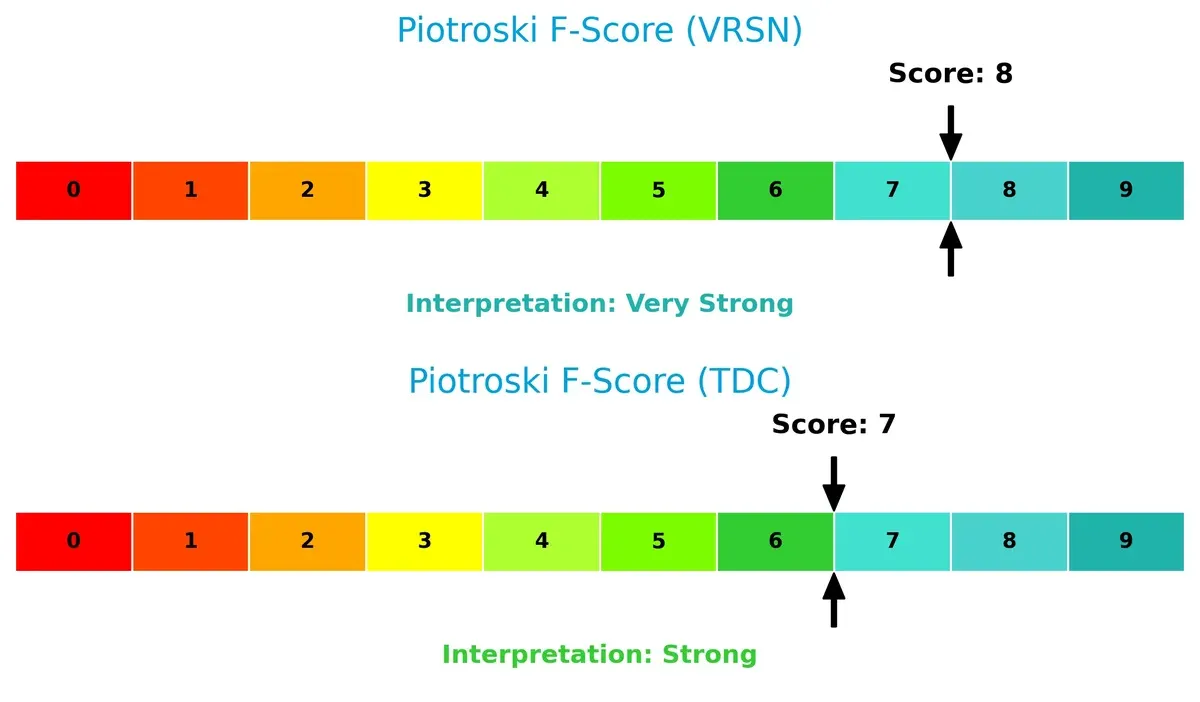
Financial Health: Quality of Operations
VeriSign scores an impressive 8 on the Piotroski F-Score, indicating very strong internal financial health, while Teradata’s 7 suggests strong but slightly less robust fundamentals:
How are the two companies positioned?
This section dissects the operational DNA of VeriSign and Teradata by comparing their revenue distribution by segment and internal dynamics. The goal is to confront their economic moats to identify which model offers the most resilient, sustainable competitive advantage today.
Revenue Segmentation: The Strategic Mix
The following visual comparison dissects how VeriSign, Inc. and Teradata Corporation diversify their income streams and where their primary sector bets lie:
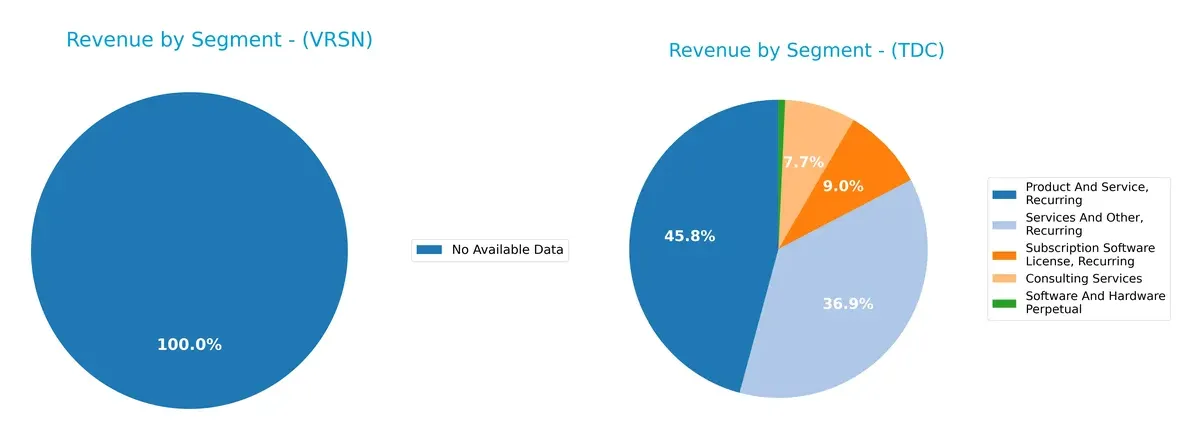
VeriSign lacks disclosed segment data, preventing direct comparison. Teradata displays a diversified revenue mix with $1.48B in Product and Service Recurring, $1.19B in Services and Other Recurring, and $248M Consulting Services. This balance anchors Teradata’s strategy in recurring software and services, reducing concentration risk. The absence of a dominant single segment highlights Teradata’s broad ecosystem, contrasting sharply with VeriSign’s undisclosed segmentation.
Strengths and Weaknesses Comparison
This table compares the Strengths and Weaknesses of VeriSign and Teradata based on diversification, profitability, financial statements, innovation, global presence, and market share:
VeriSign Strengths
- High net margin at 57.68%
- Favorable WACC at 6.88%
- Strong asset turnover and fixed asset turnover
- Solid global presence with diversified revenue across US, EMEA, Asia Pacific
Teradata Strengths
- Diversified revenue streams including consulting and subscription services
- Favorable debt-to-equity and debt-to-assets ratios
- Consistent recurring revenue segments
- Presence across Americas, EMEA, Asia Pacific
VeriSign Weaknesses
- Negative ROE and ROIC indicating poor capital returns
- Low current and quick ratios signal liquidity concerns
- High debt-to-assets ratio at 135.61%
- Negative PB ratio is a red flag
- Low dividend yield
Teradata Weaknesses
- Zero or unavailable profitability metrics (ROE, ROIC, interest coverage)
- Unfavorable asset turnover ratios
- Low or zero current and quick ratios
- Unfavorable dividend yield
- Global revenue less balanced, reliant on Americas
VeriSign shows strong profitability and efficient asset use but struggles with capital returns and liquidity. Teradata has diversified revenue and manageable debt but lacks profitability and efficiency, signaling strategic areas to improve.
The Moat Duel: Analyzing Competitive Defensibility
A structural moat is the only true defense against relentless competition eroding long-term profits. Here’s how VeriSign and Teradata stack up:
VeriSign, Inc.: Intangible Assets Powerhouse
VeriSign’s moat stems from exclusive control of critical internet infrastructure and domain registries. This dominance drives strong margins and high net profitability. Yet, emerging cybersecurity threats and regulatory changes in 2026 could pressure this moat’s stability.
Teradata Corporation: Data Platform Ecosystem
Teradata builds its moat on a connected multi-cloud analytics platform that integrates diverse data sources. Unlike VeriSign, it faces fiercer competition and margin compression. Growth depends on expanding cloud services and consulting, which could disrupt traditional rivals in 2026.
Market Control vs. Ecosystem Integration: The Moat Showdown
VeriSign’s intangible asset moat is deeper, reflected in superior margins and consistent profitability. Teradata’s ecosystem moat is promising but less proven and more vulnerable. VeriSign is better equipped to defend its market share long term.
Which stock offers better returns?
The past year reveals divergent price dynamics: VeriSign, Inc. rallies strongly before recent pullback, while Teradata Corporation declines overall but gains in the latest quarter.
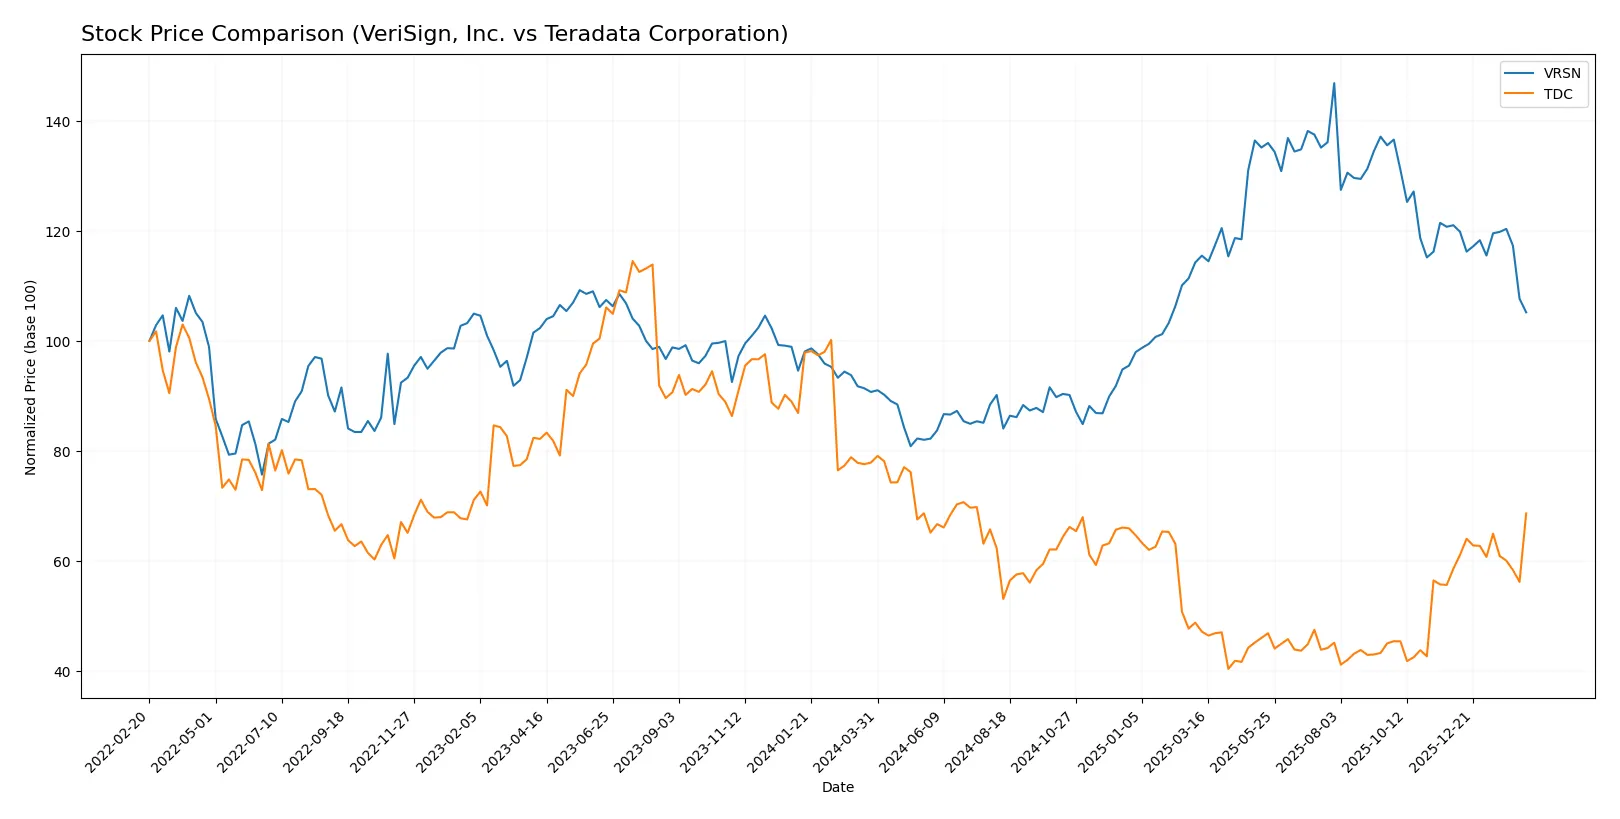
Trend Comparison
VeriSign, Inc. posts a 15.98% gain over 12 months, marking a bullish trend with decelerating momentum. Prices peaked at 305.79 and bottomed at 168.32.
Teradata Corporation suffers an 11.87% loss over 12 months, signaling a bearish trend with accelerating decline. The stock’s range spans 19.73 to 38.67.
VeriSign outperforms Teradata over the year despite recent correction, delivering the highest market return amid contrasting volume trends.
Target Prices
Analysts present a clear consensus on target prices for VeriSign, Inc. and Teradata Corporation.
| Company | Target Low | Target High | Consensus |
|---|---|---|---|
| VeriSign, Inc. | 325 | 325 | 325 |
| Teradata Corporation | 27 | 40 | 35 |
VeriSign’s target consensus of 325 suggests significant upside from its current 219 price. Teradata’s 35 target consensus is modestly above its 33.56 price, indicating cautious optimism.

Don’t Let Luck Decide Your Entry Point
Optimize your entry points with our advanced ProRealTime indicators. You’ll get efficient buy signals with precise price targets for maximum performance. Start outperforming now!
How do institutions grade them?
VeriSign, Inc. Grades
The following table summarizes recent grading actions by major financial institutions for VeriSign, Inc.:
| Grading Company | Action | New Grade | Date |
|---|---|---|---|
| Citigroup | Maintain | Buy | 2026-02-09 |
| JP Morgan | Maintain | Neutral | 2026-01-06 |
| Baird | Maintain | Outperform | 2025-07-01 |
| Baird | Maintain | Outperform | 2025-04-25 |
| Baird | Maintain | Outperform | 2025-04-01 |
| Citigroup | Maintain | Buy | 2025-02-04 |
| Citigroup | Maintain | Buy | 2025-01-03 |
| Baird | Upgrade | Outperform | 2024-12-09 |
| Baird | Maintain | Neutral | 2024-06-27 |
| Baird | Maintain | Neutral | 2024-04-26 |
Teradata Corporation Grades
The following table summarizes recent grading actions by major financial institutions for Teradata Corporation:
| Grading Company | Action | New Grade | Date |
|---|---|---|---|
| Citigroup | Maintain | Buy | 2026-02-12 |
| RBC Capital | Maintain | Sector Perform | 2026-02-11 |
| Citizens | Maintain | Market Outperform | 2026-02-11 |
| Barclays | Maintain | Underweight | 2026-02-11 |
| Evercore ISI Group | Maintain | Outperform | 2026-02-11 |
| Citigroup | Maintain | Buy | 2026-02-04 |
| Barclays | Maintain | Underweight | 2026-01-12 |
| RBC Capital | Maintain | Sector Perform | 2026-01-05 |
| Morgan Stanley | Maintain | Overweight | 2025-12-17 |
| Citizens | Upgrade | Market Outperform | 2025-11-10 |
Which company has the best grades?
VeriSign consistently earns “Buy” and “Outperform” grades from leading firms, reflecting strong institutional confidence. Teradata shows more mixed ratings with “Buy,” “Outperform,” but also “Underweight” and “Sector Perform” grades. VeriSign’s stronger consensus may suggest better market sentiment among analysts.
Risks specific to each company
The following categories identify the critical pressure points and systemic threats facing both firms in the 2026 market environment:
1. Market & Competition
VeriSign, Inc.
- Dominates key internet infrastructure niches with .com/.net domains, but faces tech disruption risks.
Teradata Corporation
- Competes in multi-cloud analytics amid intense cloud platform rivalry and evolving enterprise needs.
2. Capital Structure & Debt
VeriSign, Inc.
- High debt-to-assets ratio (135.6%) signals leverage concerns despite strong interest coverage.
Teradata Corporation
- Low reported debt and favorable debt-to-equity metrics, but lack of interest coverage data raises questions.
3. Stock Volatility
VeriSign, Inc.
- Beta of 0.75 suggests moderate volatility, aligning with tech infrastructure peers.
Teradata Corporation
- Lower beta at 0.54 reflects less price sensitivity but limited volatility may dampen returns.
4. Regulatory & Legal
VeriSign, Inc.
- Operates critical internet infrastructure, exposing it to regulatory scrutiny and compliance risks.
Teradata Corporation
- Faces data privacy and cloud compliance regulations across multiple jurisdictions, increasing legal complexity.
5. Supply Chain & Operations
VeriSign, Inc.
- Runs distributed servers and network systems with operational resilience but hardware reliance remains a risk.
Teradata Corporation
- Relies on cloud service providers and software integration, vulnerable to third-party disruptions.
6. ESG & Climate Transition
VeriSign, Inc.
- Internet infrastructure demands energy efficiency improvements amid rising ESG investor scrutiny.
Teradata Corporation
- Multi-cloud model requires sustainable IT practices; ESG transparency is critical for investor confidence.
7. Geopolitical Exposure
VeriSign, Inc.
- US-based with global domain services; geopolitical tensions could affect internet governance.
Teradata Corporation
- Global client base across sensitive sectors exposes it to trade restrictions and cross-border data laws.
Which company shows a better risk-adjusted profile?
VeriSign’s most impactful risk is its extreme leverage, risking financial distress despite strong operational moats. Teradata’s primary risk lies in its operational and market execution amid intense competition and incomplete financial transparency. Despite VeriSign’s leverage, I see its dominant market position and robust infrastructure as a buffer. Teradata’s weaker profitability and unclear debt servicing metrics weigh more heavily. VeriSign’s stable beta and very strong Piotroski score contrast with Teradata’s moderate score and distress-zone Altman Z-score, confirming VeriSign’s superior risk-adjusted profile.
Final Verdict: Which stock to choose?
VeriSign’s superpower lies in its commanding profitability and cash generation, driving impressive margins that few in its sector match. Yet, its persistently weak liquidity ratios and value destruction signal caution. It suits portfolios targeting aggressive growth with willingness to navigate operational risks.
Teradata leverages a strategic moat in data analytics with steady recurring revenue that underpins its financial safety profile. While it lacks the high profitability of VeriSign, its stronger balance sheet and consistent cash flow favor more conservative investors. It fits well in GARP portfolios seeking stability with growth potential.
If you prioritize rapid profit expansion and market dominance, VeriSign is the compelling choice due to its superior income quality and operating efficiency. However, if you seek better financial stability and moderate growth, Teradata offers a safer harbor with a proven moat and stronger balance sheet discipline. Both present distinct analytical scenarios aligned to investor risk appetite and growth objectives.
Disclaimer: Investment carries a risk of loss of initial capital. The past performance is not a reliable indicator of future results. Be sure to understand risks before making an investment decision.
Go Further
I encourage you to read the complete analyses of VeriSign, Inc. and Teradata Corporation to enhance your investment decisions: