In the evolving landscape of software infrastructure, UiPath Inc. and Teradata Corporation stand out as key players driving innovation in automation and data analytics. Both companies serve enterprise clients across diverse industries with cutting-edge platforms that enhance operational efficiency. Comparing their market strategies and technological strengths offers valuable insight for investors. Join me as we explore which company presents the most compelling opportunity for your portfolio in 2026.
Table of contents
Companies Overview
I will begin the comparison between UiPath Inc. and Teradata Corporation by providing an overview of these two companies and their main differences.
UiPath Inc. Overview
UiPath Inc. specializes in robotic process automation (RPA) software, offering an end-to-end platform that integrates artificial intelligence and automation tools to streamline business processes. Founded in 2005 and headquartered in New York City, UiPath serves industries such as banking, healthcare, and government with a focus on enabling organizations to build, manage, and measure automation at scale.
Teradata Corporation Overview
Teradata Corporation delivers a connected multi-cloud data platform for enterprise analytics, helping clients leverage data across ecosystems and migrate to cloud environments. Founded in 1979 and based in San Diego, Teradata serves sectors including financial services, healthcare, retail, and telecommunications, providing both software and consulting services to optimize data analytics infrastructure globally.
Key similarities and differences
Both UiPath and Teradata operate in the technology sector focusing on software infrastructure with global clientele across multiple industries. UiPath emphasizes automation through RPA and AI-driven process management, whereas Teradata concentrates on data analytics and cloud integration. Additionally, Teradata has a longer corporate history and a larger workforce, while UiPath centers on automation innovation with a relatively smaller team.
Income Statement Comparison
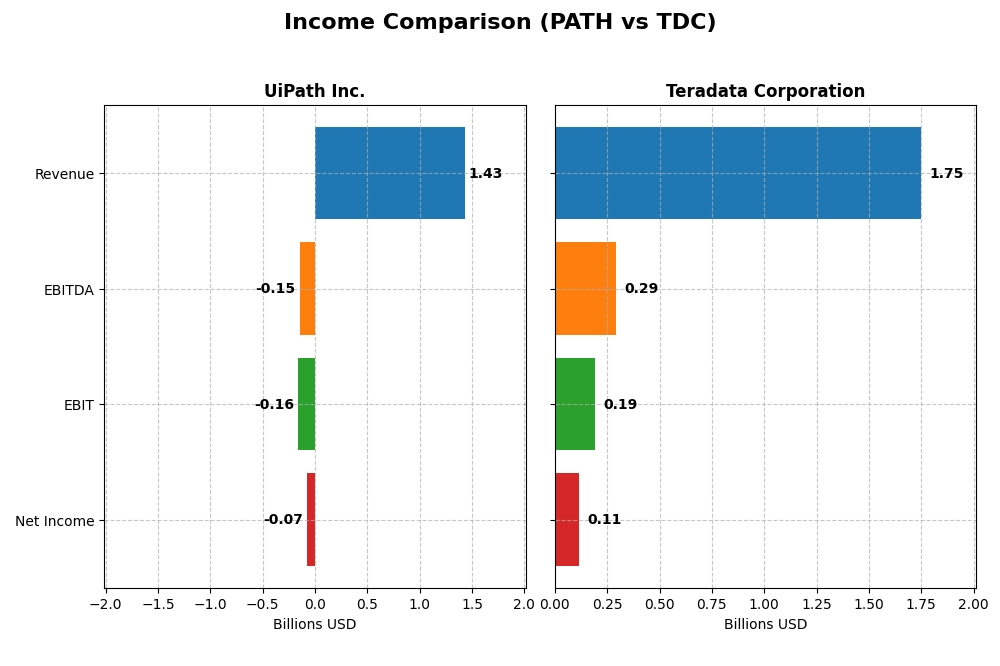
The table below compares the key income statement metrics for UiPath Inc. and Teradata Corporation for their most recent fiscal years, providing a snapshot of their financial performance.
| Metric | UiPath Inc. (PATH) | Teradata Corporation (TDC) |
|---|---|---|
| Market Cap | 7.7B | 2.8B |
| Revenue | 1.43B | 1.75B |
| EBITDA | -145M | 293M |
| EBIT | -163M | 193M |
| Net Income | -74M | 114M |
| EPS | -0.13 | 1.18 |
| Fiscal Year | 2025 | 2024 |
Income Statement Interpretations
UiPath Inc.
UiPath’s revenue showed strong growth from 607M in 2021 to 1.43B in 2025, with net income losses steadily shrinking from -92M to -74M. Gross margins remained robust above 80%, while EBIT margins stayed negative but improved slightly. The 2025 fiscal year saw revenue growth of 9.3%, modest EBIT improvement, and better net margin and EPS growth, signaling operational progress.
Teradata Corporation
Teradata reported relatively stable revenue around 1.75B to 1.91B from 2020 to 2024, with a slight decline of 4.5% in the latest year. Net income fluctuated, reaching 114M in 2024 after a dip in prior years. Margins were positive, with gross margin near 60% and EBIT margin above 11%. Despite a recent revenue decline, EBIT and net margin growth were strong in 2024, reflecting margin expansion.
Which one has the stronger fundamentals?
UiPath demonstrates stronger revenue growth and improving profitability trends despite ongoing net losses, supported by high gross margins and favorable margin growth. Teradata shows consistent profitability and positive net income but faces revenue decline and negative growth over the period. Overall, UiPath exhibits more dynamic growth, while Teradata maintains steadier profitability fundamentals.
Financial Ratios Comparison
The table below presents a side-by-side comparison of key financial ratios for UiPath Inc. and Teradata Corporation based on the most recent fiscal year data available.
| Ratios | UiPath Inc. (PATH) 2025 | Teradata Corporation (TDC) 2024 |
|---|---|---|
| ROE | -3.99% | 85.7% |
| ROIC | -7.41% | 16.9% |
| P/E | -108 | 26.3 |
| P/B | 4.31 | 22.58 |
| Current Ratio | 2.93 | 0.81 |
| Quick Ratio | 2.93 | 0.79 |
| D/E (Debt-to-Equity) | 0.04 | 4.33 |
| Debt-to-Assets | 2.72% | 33.8% |
| Interest Coverage | 0 | 7.21 |
| Asset Turnover | 0.50 | 1.03 |
| Fixed Asset Turnover | 14.41 | 9.07 |
| Payout ratio | 0 | 0 |
| Dividend yield | 0 | 0 |
Interpretation of the Ratios
UiPath Inc.
UiPath’s ratios reveal a mixed financial health with a slightly unfavorable overall evaluation. Key profitability metrics like net margin (-5.15%) and return on equity (-3.99%) are negative, highlighting operational challenges. Liquidity ratios are strong, with a current ratio of 2.93, but interest coverage is zero, indicating risk in servicing debt. The company does not pay dividends, likely due to negative profitability and prioritizing growth and reinvestment.
Teradata Corporation
Teradata shows a more balanced profile with a neutral overall ratio evaluation. Profitability indicators such as return on equity (85.71%) and return on invested capital (16.89%) are strong, though the price-to-earnings ratio (26.34) and price-to-book ratio (22.58) suggest high market valuations. Liquidity ratios are weak, with a current ratio of 0.81, and the company also does not pay dividends, possibly focusing on reinvestment and operational expansion.
Which one has the best ratios?
Comparing the two, Teradata exhibits stronger profitability and operational efficiency ratios, while UiPath has better liquidity and lower leverage. However, Teradata faces unfavorable valuation and liquidity concerns, and UiPath carries negative returns and interest coverage issues. Overall, Teradata’s ratios are assessed as neutral, slightly better than UiPath’s slightly unfavorable profile.
Strategic Positioning
This section compares the strategic positioning of UiPath Inc. and Teradata Corporation, focusing on market position, key segments, and exposure to technological disruption:
UiPath Inc.
- Strong presence in automation software with competitive pressure from innovation and market growth.
- Key segments include license sales, subscription services, and professional services driving growth.
- High exposure to AI and automation technologies driving business transformation and innovation.
Teradata Corporation
- Positioned as a multi-cloud data platform provider facing moderate competitive pressure.
- Diverse revenue streams from consulting, recurring products/services, and subscription licenses.
- Exposure to cloud migration and data analytics technology disruptions in enterprise environments.
UiPath Inc. vs Teradata Corporation Positioning
UiPath focuses on automation software with a concentrated portfolio in licenses and subscriptions, benefiting from AI integration. Teradata offers a diversified multi-cloud data platform and consulting services, supporting broad enterprise analytics needs across sectors.
Which has the best competitive advantage?
Teradata demonstrates a very favorable moat with ROIC exceeding WACC significantly and growing profitability, indicating a durable competitive advantage. UiPath shows a slightly unfavorable moat, shedding value despite improving ROIC trends.
Stock Comparison
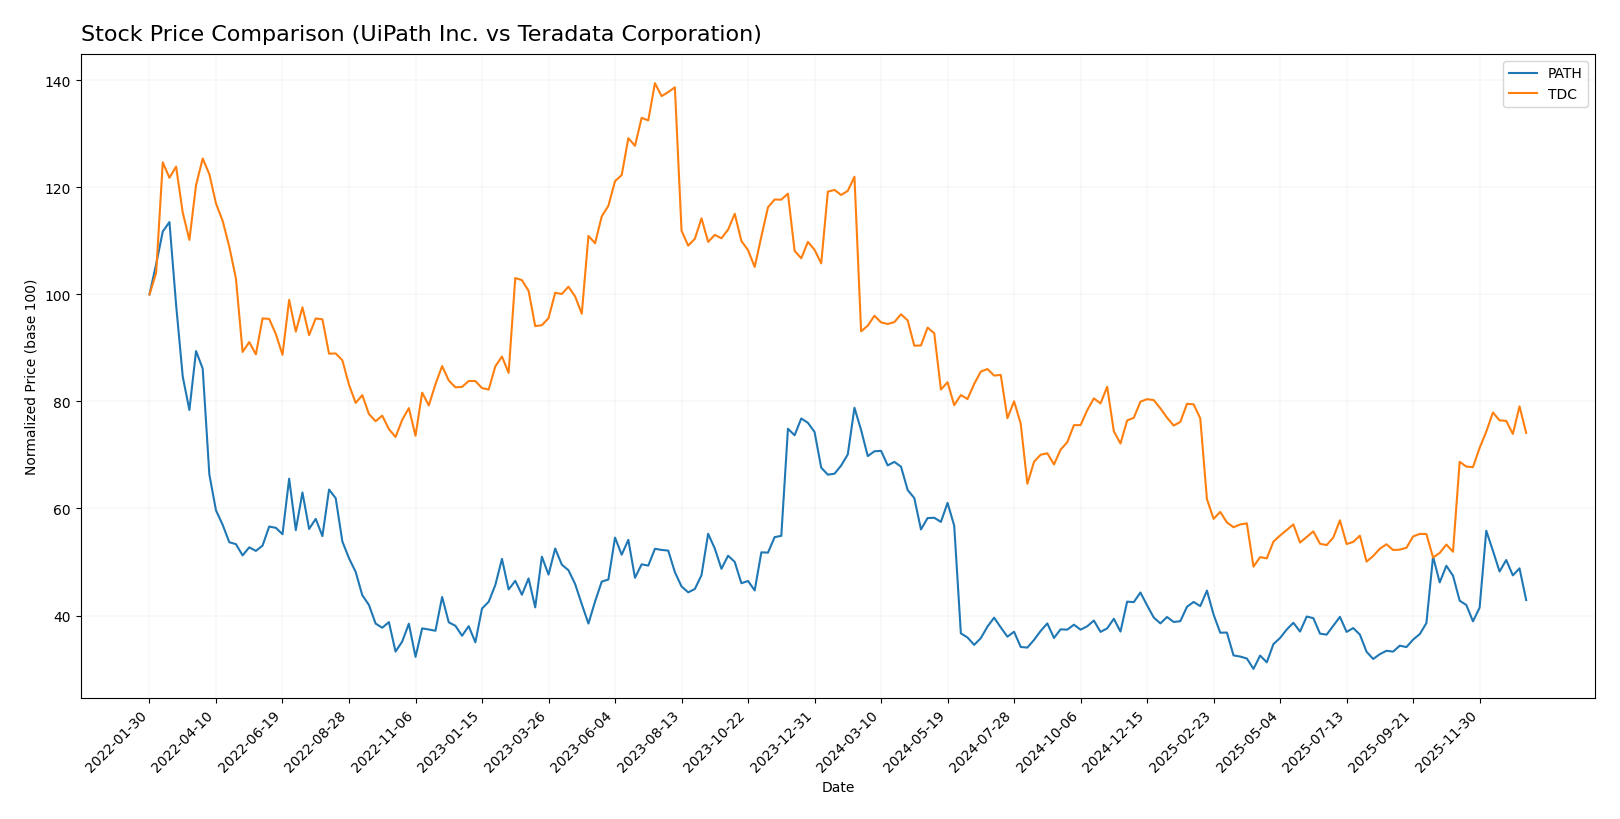
The stock price movements of UiPath Inc. and Teradata Corporation over the past year reveal significant bearish trends with acceleration, punctuated by recent divergent performances in their short-term price changes.
Trend Analysis
UiPath Inc. (PATH) experienced a bearish overall trend with a 38.53% price decline over the past 12 months, showing accelerating downward momentum and a standard deviation of 3.33. The recent period reflected continued weakness with a 9.58% drop.
Teradata Corporation (TDC) also showed a bearish trend over the past year with a 21.26% decline and accelerating trend, accompanied by higher volatility (std deviation 5.63). However, its recent price surged 42.78%, indicating potential short-term recovery.
Comparing the two, Teradata delivered the highest recent market performance despite both companies showing bearish annual trends. Teradata’s recent strong rebound contrasts with UiPath’s continued decline.
Target Prices
The current analyst consensus reflects a positive outlook for both UiPath Inc. and Teradata Corporation.
| Company | Target High | Target Low | Consensus |
|---|---|---|---|
| UiPath Inc. | 19 | 14 | 16.6 |
| Teradata Corporation | 35 | 27 | 31 |
Analysts expect UiPath’s stock price to rise moderately above its current 14.34 USD level, while Teradata’s consensus target of 31 USD suggests upside potential from its present price of 29.77 USD.
Analyst Opinions Comparison
This section compares analysts’ ratings and grades for UiPath Inc. and Teradata Corporation:
Rating Comparison
UiPath Inc. Rating
- Rating: B+, rated as Very Favorable overall.
- Discounted Cash Flow Score: Moderate at 3, indicating a balanced valuation outlook.
- ROE Score: Favorable at 4, showing efficient profit generation from equity.
- ROA Score: Favorable at 4, reflecting effective asset utilization.
- Debt To Equity Score: Favorable at 4, implying a strong balance sheet with low risk.
- Overall Score: Moderate at 3, reflecting a balanced financial standing.
Teradata Corporation Rating
- Rating: B+, rated as Very Favorable overall.
- Discounted Cash Flow Score: Favorable at 4, suggesting better valuation based on cash flows.
- ROE Score: Very Favorable at 5, indicating superior equity profit efficiency.
- ROA Score: Favorable at 4, indicating good asset utilization efficiency.
- Debt To Equity Score: Very Unfavorable at 1, indicating high financial risk from debt.
- Overall Score: Moderate at 3, reflecting a balanced financial standing.
Which one is the best rated?
Both companies share the same overall rating of B+ and an overall score of 3. Teradata leads in discounted cash flow and ROE scores, while UiPath has a much stronger debt-to-equity score, indicating lower financial risk.
Scores Comparison
Here is a comparison of the Altman Z-Score and Piotroski Score for UiPath Inc. and Teradata Corporation:
UiPath Inc. Scores
- Altman Z-Score: 5.27, indicating a safe zone from bankruptcy risk.
- Piotroski Score: 7, reflecting strong financial health.
Teradata Corporation Scores
- Altman Z-Score: 0.81, indicating distress zone and high risk.
- Piotroski Score: 8, reflecting very strong financial health.
Which company has the best scores?
UiPath shows a strong Altman Z-Score in the safe zone, while Teradata’s score is in distress. Teradata’s Piotroski Score is higher, indicating very strong financial health compared to UiPath’s strong rating.
Grades Comparison
The following presents the recent grades and consensus ratings for UiPath Inc. and Teradata Corporation:
UiPath Inc. Grades
This table summarizes recent analyst grades and actions for UiPath Inc.:
| Grading Company | Action | New Grade | Date |
|---|---|---|---|
| Barclays | Maintain | Equal Weight | 2026-01-12 |
| RBC Capital | Maintain | Sector Perform | 2026-01-05 |
| RBC Capital | Maintain | Sector Perform | 2025-12-10 |
| Morgan Stanley | Maintain | Equal Weight | 2025-12-09 |
| DA Davidson | Maintain | Neutral | 2025-12-05 |
| Canaccord Genuity | Maintain | Buy | 2025-12-04 |
| Mizuho | Maintain | Neutral | 2025-12-04 |
| RBC Capital | Maintain | Sector Perform | 2025-12-04 |
| Wells Fargo | Maintain | Equal Weight | 2025-12-04 |
| Evercore ISI Group | Maintain | In Line | 2025-12-04 |
UiPath’s grades consistently show a neutral to moderate outlook with no upgrades or downgrades recently.
Teradata Corporation Grades
This table summarizes recent analyst grades and actions for Teradata Corporation:
| Grading Company | Action | New Grade | Date |
|---|---|---|---|
| Barclays | Maintain | Underweight | 2026-01-12 |
| RBC Capital | Maintain | Sector Perform | 2026-01-05 |
| Morgan Stanley | Maintain | Overweight | 2025-12-17 |
| Citizens | Upgrade | Market Outperform | 2025-11-10 |
| Barclays | Maintain | Underweight | 2025-11-05 |
| TD Cowen | Maintain | Hold | 2025-11-05 |
| Evercore ISI Group | Maintain | Outperform | 2025-11-05 |
| UBS | Maintain | Neutral | 2025-08-06 |
| Guggenheim | Maintain | Buy | 2025-05-07 |
| Barclays | Maintain | Underweight | 2025-04-21 |
Teradata’s grades reveal a mixed but slightly more positive pattern, including an upgrade and several outperform or overweight ratings.
Which company has the best grades?
Teradata Corporation has received a broader range of positive ratings, including upgrades and outperform assessments, unlike UiPath Inc., which predominantly holds neutral to sector perform grades. This suggests Teradata’s outlook may offer a more favorable sentiment, potentially affecting investor perception and portfolio positioning.
Strengths and Weaknesses
Below is a comparison of key strengths and weaknesses for UiPath Inc. and Teradata Corporation based on the latest financial and operational data:
| Criterion | UiPath Inc. (PATH) | Teradata Corporation (TDC) |
|---|---|---|
| Diversification | Moderate: Focuses on License, Subscription, and Professional Services with Subscription Services growing strongly (801M in 2025) | High: Broad product portfolio including Consulting, Recurring Products & Services, Software & Hardware Licenses |
| Profitability | Weak: Negative net margin (-5.15%), ROIC -7.41% indicating value destruction | Strong: Positive net margin (6.51%), high ROIC (16.89%), creating value with durable competitive advantage |
| Innovation | Moderate: Improving ROIC trend (+65%) but still shedding value, reflecting ongoing efforts | High: Very favorable moat with strong ROIC growth (+370%), signaling solid innovation and market positioning |
| Global presence | Moderate: Growing subscription base but less diversified geographically | High: Significant international and US revenue streams, with over 33% debt-to-assets ratio reflecting scale |
| Market Share | Growing but challenged: asset turnover low (0.5), indicating less efficient asset use | Established: asset turnover 1.03 and strong interest coverage, indicating efficient operations and market control |
Key takeaways: Teradata demonstrates a stronger financial position with clear profitability, efficient operations, and a wide product base. UiPath shows promise with improving ROIC and growth in subscription services but faces profitability challenges and less diversification. Investors should weigh growth potential against current value destruction when considering UiPath.
Risk Analysis
The table below summarizes key risks for UiPath Inc. and Teradata Corporation based on their latest financial and market data.
| Metric | UiPath Inc. (PATH) | Teradata Corporation (TDC) |
|---|---|---|
| Market Risk | High beta (1.08), software sector volatility | Lower beta (0.57), more stable market presence |
| Debt Level | Low debt/equity (0.04), low debt-to-assets (2.7%) | High debt/equity (4.33), moderate debt-to-assets (33.8%) |
| Regulatory Risk | Moderate, US and international markets exposure | Moderate, global data privacy and cloud regulations |
| Operational Risk | Negative net margin (-5.15%), operational inefficiencies | Positive net margin (6.51%), but liquidity concerns |
| Environmental Risk | Low direct impact, typical for software sector | Low direct impact, but higher scale operations |
| Geopolitical Risk | Exposure to US, Romania, Japan | Exposure across Americas, EMEA, Asia Pacific |
UiPath faces notable operational risks with negative profitability and moderate market volatility, though low debt mitigates financial risk. Teradata’s high leverage and weaker liquidity ratios heighten financial risk despite strong profitability and a very strong Piotroski score. Investors should weigh UiPath’s business growth potential against Teradata’s financial distress risk.
Which Stock to Choose?
UiPath Inc. (PATH) shows a favorable income evolution with 9.3% revenue growth in 2025 and a strong gross margin of 82.73%. However, profitability ratios remain unfavorable, including a -5.15% net margin and negative returns on equity and capital. PATH’s debt levels are low with a debt-to-equity ratio of 0.04, and it holds a strong liquidity position. The rating is very favorable (B+), but the global financial ratios evaluation is slightly unfavorable, reflecting mixed financial health.
Teradata Corporation (TDC) has a stable income statement with a 6.51% net margin and positive EBIT margin of 11.03%. Revenue growth is negative overall (-4.68%), yet profitability ratios appear strong, including an 85.71% ROE and 16.89% ROIC. Debt is higher relative to equity (debt-to-equity 4.33), and liquidity ratios are below 1, indicating tighter working capital. Its rating is also very favorable (B+), with a neutral global ratios evaluation, suggesting balanced financial standing.
Investors with a growth focus might see potential in UiPath’s improving income growth and strong liquidity despite current unprofitable metrics. Conversely, risk-tolerant or value-oriented investors could be more interested in Teradata’s strong profitability and value creation demonstrated by ROIC exceeding WACC, albeit with higher leverage and weaker liquidity. The contrasting profiles suggest the choice depends on risk tolerance and investment strategy.
Disclaimer: Investment carries a risk of loss of initial capital. The past performance is not a reliable indicator of future results. Be sure to understand risks before making an investment decision.
Go Further
I encourage you to read the complete analyses of UiPath Inc. and Teradata Corporation to enhance your investment decisions: