Home > Comparison > Technology > TDC vs MSTR
The strategic rivalry between Teradata Corporation and Strategy Inc defines the current trajectory of the technology sector. Teradata operates as a capital-intensive software infrastructure provider focused on multi-cloud data platforms. In contrast, Strategy Inc combines bitcoin treasury exposure with high-margin AI-powered application software. This analysis compares their corporate strategies to identify which offers a superior risk-adjusted return for diversified portfolios amid evolving digital transformation trends.

Table of contents
Companies Overview
Teradata Corporation and Strategy Inc stand as influential players in the technology sector’s software landscape.
Teradata Corporation: Connected Multi-Cloud Data Platform Leader
Teradata Corporation specializes in enterprise analytics via its Teradata Vantage platform. It generates revenue by enabling clients to integrate and analyze data across multi-cloud environments. In 2026, Teradata prioritizes ecosystem simplification and supports cloud migration to enhance customer data infrastructure value globally.
Strategy Inc: Bitcoin Treasury and AI Analytics Pioneer
Strategy Inc operates at the intersection of bitcoin treasury management and AI-powered enterprise analytics. It monetizes through bitcoin-related securities and software like Strategy One and Strategy Mosaic, which deliver actionable insights. Its 2026 strategy focuses on expanding international bitcoin exposure and advancing AI analytics for non-technical users.
Strategic Collision: Similarities & Divergences
Teradata embraces an open multi-cloud ecosystem, while Strategy Inc blends closed bitcoin treasury operations with AI software. They compete primarily in analytics platforms but diverge sharply in market focus—Teradata targets broad enterprise data integration; Strategy Inc leverages cryptocurrency and AI innovation. This contrast shapes distinct risk and growth profiles for investors monitoring tech diversification.
Income Statement Comparison
The following data dissects the core profitability and scalability of both corporate engines to reveal who dominates the bottom line:
| Metric | Teradata Corporation (TDC) | Strategy Inc (MSTR) |
|---|---|---|
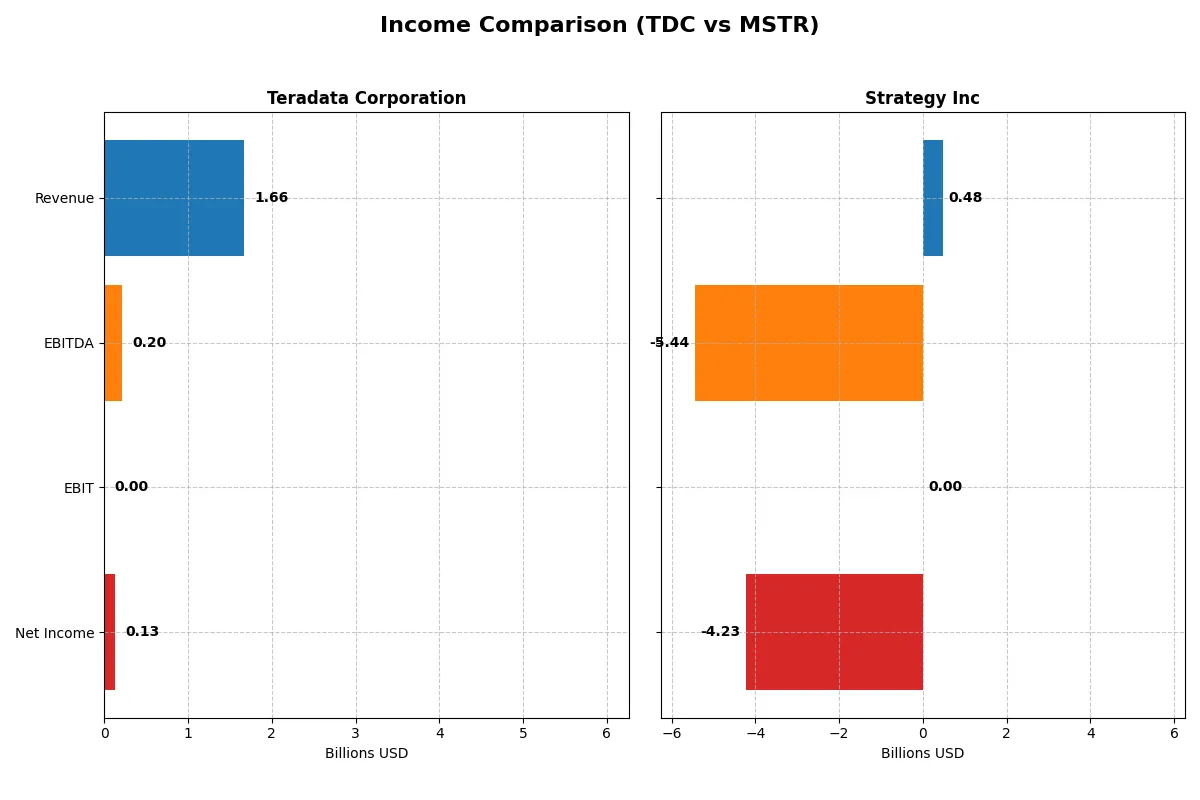
| Revenue | 1.66B | 477M |
| Cost of Revenue | 676M | 149M |
| Operating Expenses | 782M | 5.62B |
| Gross Profit | 987M | 328M |
| EBITDA | 205M | -5.44B |
| EBIT | 0 | 0 |
| Interest Expense | 0 | -65M |
| Net Income | 130M | -4.23B |
| EPS | 1.38 | -15.23 |
| Fiscal Year | 2025 | 2025 |
Income Statement Analysis: The Bottom-Line Duel
This income statement comparison reveals which company demonstrates superior operational efficiency and bottom-line control in a challenging market environment.
Teradata Corporation Analysis
Teradata’s revenue declined from 1.92B in 2021 to 1.66B in 2025, while net income contracted from 147M to 130M. Despite the revenue dip, the company maintains a strong gross margin above 59%, signaling effective cost management. The 2025 net margin improved to 7.82%, reflecting better bottom-line discipline despite a 5% revenue slide year-over-year.
Strategy Inc Analysis
Strategy Inc’s revenue hovered around 477M in 2025, slightly up from 463M in 2024, but net income plunged to a -4.23B loss from a -1.17B loss, illustrating severe profitability deterioration. The gross margin remains healthy near 69%, yet massive other expenses and operating losses wiped out earnings. The negative net margin of -886% starkly highlights ongoing structural challenges.
Margin Resilience vs. Deep Losses
Teradata shows resilience with stable margins and modest net income growth, while Strategy Inc struggles with large losses despite stable revenues. Teradata’s controlled expenses and positive net margin make it the fundamental winner here. Investors seeking operational stability will likely favor Teradata’s more sustainable profitability profile over Strategy Inc’s volatile earnings.
Financial Ratios Comparison
These vital ratios act as a diagnostic tool to expose the underlying fiscal health, valuation premiums, and capital efficiency of the companies compared below:
| Ratios | Teradata Corporation (TDC) | Strategy Inc (MSTR) |
|---|---|---|
| ROE | 0.86 | -0.08 |
| ROIC | 0.17 | -0.06 |
| P/E | 22.1 | -9.98 |
| P/B | 22.58 | 0.83 |
| Current Ratio | 0.81 | 5.62 |
| Quick Ratio | 0.79 | 5.62 |
| D/E | 4.33 | 0.16 |
| Debt-to-Assets | 0.34 | 0.13 |
| Interest Coverage | 7.21 | 83.80 |
| Asset Turnover | 1.03 | 0.008 |
| Fixed Asset Turnover | 9.07 | 6.29 |
| Payout ratio | 0 | 0 |
| Dividend yield | 0 | 0 |
| Fiscal Year | 2025 | 2025 |
Efficiency & Valuation Duel: The Vital Signs
Financial ratios act as a company’s DNA, revealing hidden risks and operational excellence that underpin stock valuation and future performance.
Teradata Corporation
Teradata posts a neutral net margin of 7.82% but an unfavorable ROE and ROIC at zero, signaling weak profitability efficiency. Its P/E of 22.1 reflects a fairly valued stock, supported by a favorable debt-to-equity position. The lack of dividends suggests reinvestment into R&D, with 16.8% of revenue allocated there, aiming for growth despite operational headwinds.
Strategy Inc
Strategy Inc suffers deep profitability losses, with net margin at -886% and negative ROE and ROIC, indicating severe operational challenges. Yet, its P/E is negative but marked favorable due to valuation metrics like a low P/B of 0.83 and strong quick ratio of 5.62. No dividends are paid; capital allocation focuses on high R&D spending at 19.7%, seeking innovation-driven recovery.
Valuation Discipline vs. Profitability Struggles
Teradata offers a more balanced profile with moderate valuation and reinvestment in innovation, despite weak profitability ratios. Strategy Inc’s valuation appears cheap but is weighed down by severe losses and high operational risk. Investors seeking stability might prefer Teradata, while those chasing turnaround potential may consider Strategy Inc’s riskier proposition.
Which one offers the Superior Shareholder Reward?
Teradata Corporation (TDC) pays no dividends but generates strong free cash flow of 3.2/share in 2025, supporting sustainable buybacks. Strategy Inc (MSTR) also pays no dividends and currently posts negative free cash flow and large net losses. Teradata’s consistent cash generation and modest leverage contrast with Strategy’s volatile margins and high long-term debt. I see Teradata’s buyback-fueled shareholder return as more sustainable and compelling in 2026. Strategy’s reinvestment gamble faces high execution risk, making Teradata the superior total return choice.
Comparative Score Analysis: The Strategic Profile
The radar chart reveals the fundamental DNA and trade-offs of Teradata Corporation and Strategy Inc, highlighting their core financial strengths and weaknesses:
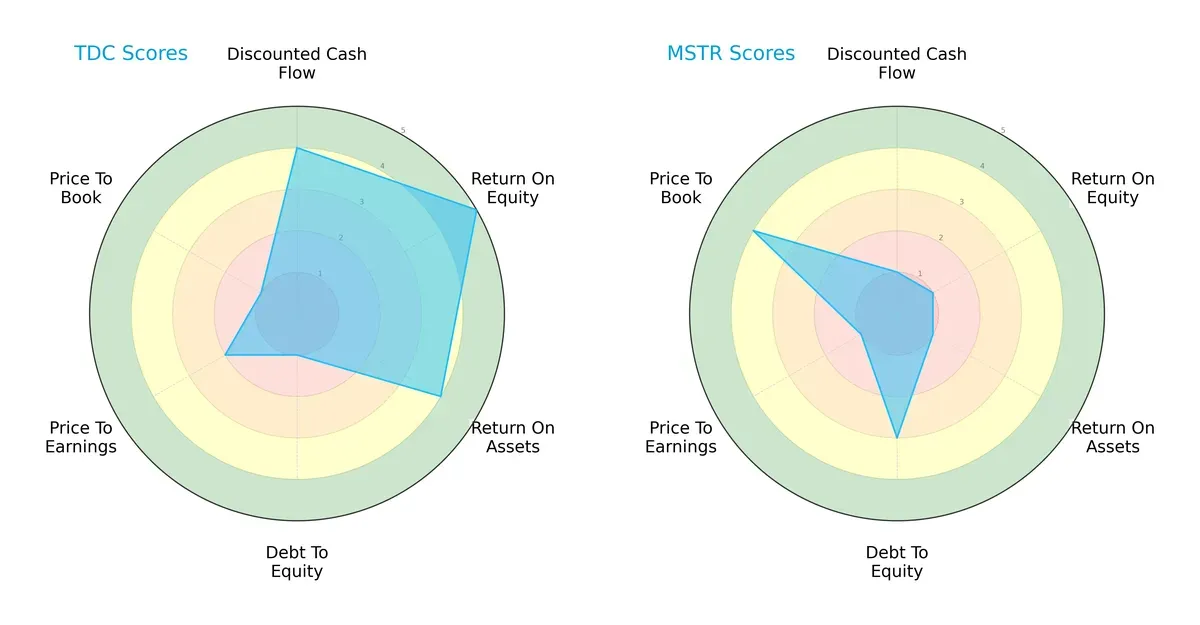
Teradata shows a more balanced profile with strong ROE (5) and ROA (4) scores, signaling efficient profitability and asset use. However, its heavy debt load (Debt/Equity score 1) is a red flag. Strategy Inc relies on a moderate debt position (score 3) and a favorable Price-to-Book valuation (4), but suffers from weak operational metrics, reflected in low ROE and ROA scores (both 1). Teradata’s edge lies in operational efficiency, while Strategy Inc leans on valuation appeal.
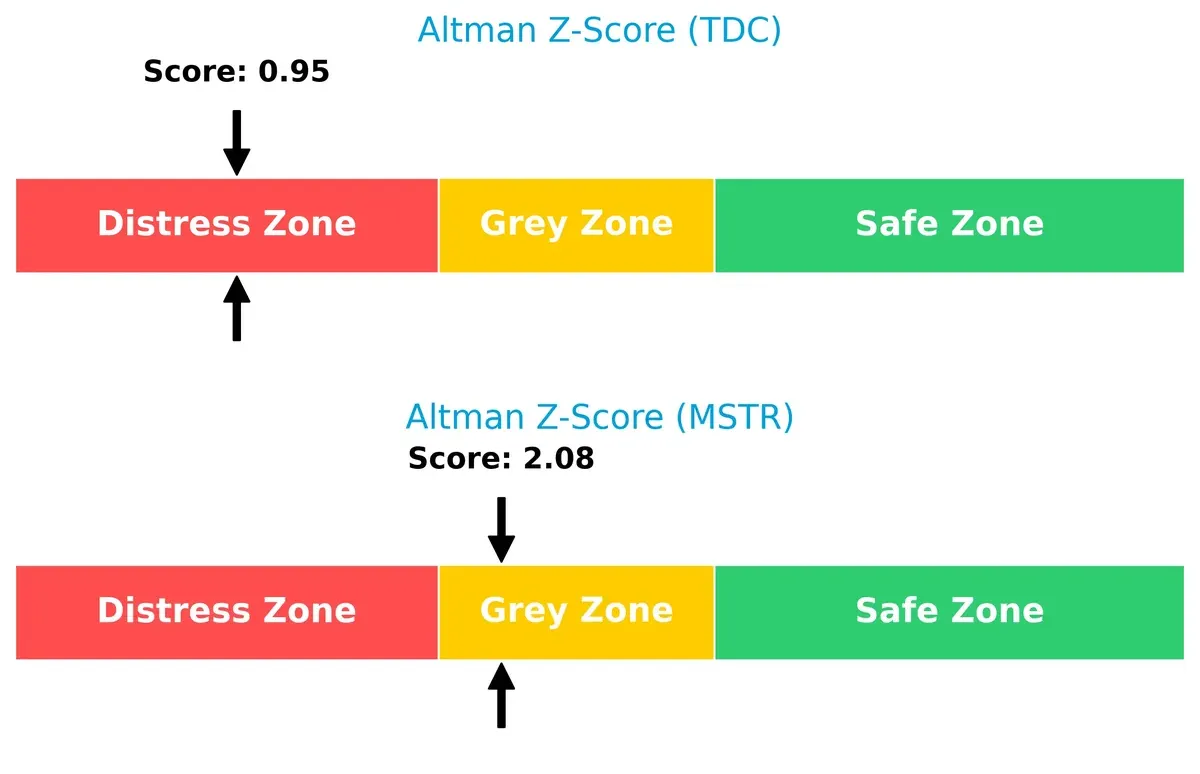
Bankruptcy Risk: Solvency Showdown
Teradata’s Altman Z-Score of 0.95 places it in the distress zone. Strategy Inc’s 2.08 score situates it in the grey zone, implying a moderate risk of bankruptcy in this cycle:
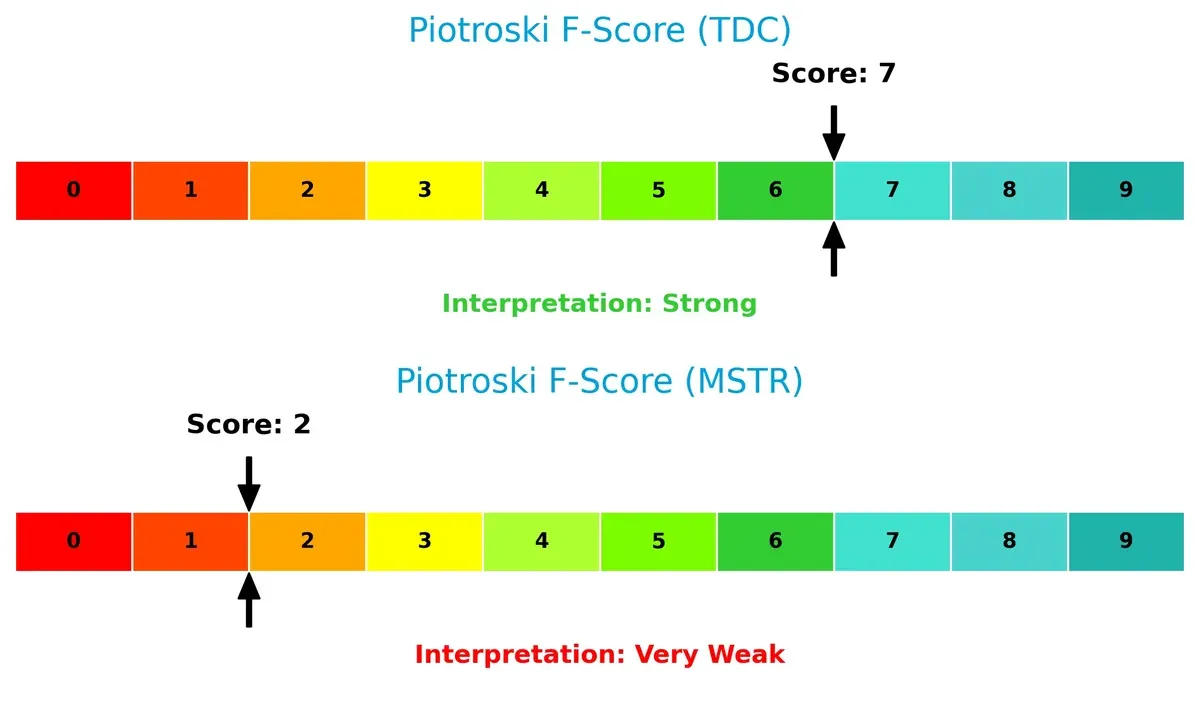
Financial Health: Quality of Operations
Teradata’s Piotroski F-Score of 7 signals strong financial health and solid internal metrics. Strategy Inc’s score of 2 flags serious red flags and operational weaknesses:
How are the two companies positioned?
This section dissects the operational DNA of Teradata and Strategy by comparing revenue distribution and internal dynamics. The goal is to confront their economic moats to reveal which model delivers the most resilient competitive advantage today.
Revenue Segmentation: The Strategic Mix
This visual comparison dissects how Teradata Corporation and Strategy Inc diversify their income streams and reveals their primary sector bets:
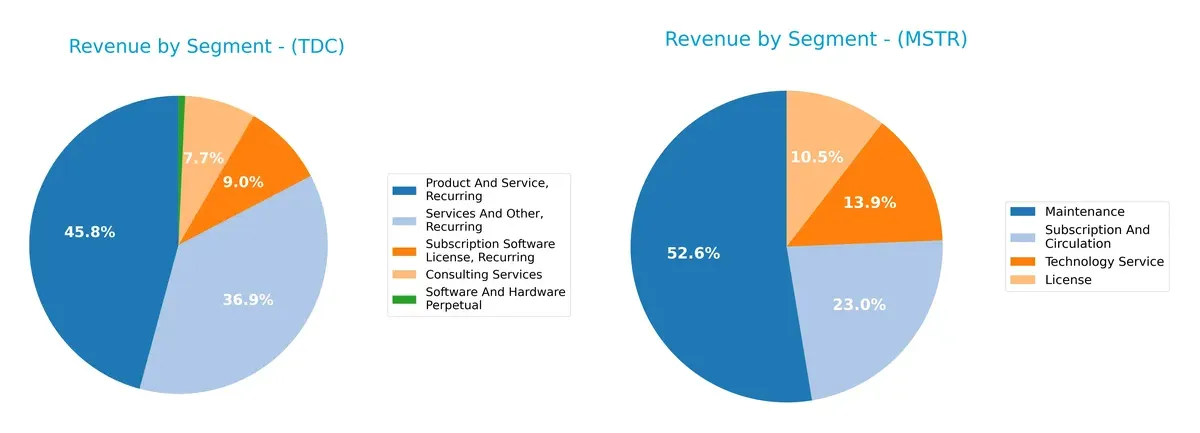
Teradata anchors its revenue in recurring products and services, totaling about 2.68B in 2024, supplemented by consulting at 248M. Strategy Inc’s revenue centers heavily on maintenance at 244M, dwarfing its license and technology service streams. Teradata’s diversified recurring base suggests ecosystem lock-in and steady cash flow. In contrast, Strategy Inc’s reliance on maintenance signals concentration risk but stable legacy revenue. Teradata’s broader mix offers stronger resilience in volatile markets.
Strengths and Weaknesses Comparison
This table compares the strengths and weaknesses of Teradata Corporation and Strategy Inc based on diversification, profitability, financials, innovation, global presence, and market share:
Teradata Corporation Strengths
- Diverse revenue streams: consulting 248M, recurring services 2.6B, subscription 289M
- Strong global presence with Americas 1.01B, EMEA 484M, Asia Pacific 255M
- Favorable debt metrics with zero debt and low debt-to-assets ratio
Strategy Inc Strengths
- Diversified revenue: license 49M, maintenance 244M, subscription 107M, tech services 64M
- Strong quick ratio (5.62) and favorable debt-to-assets (13.44%)
- Favorable fixed asset turnover (6.29) indicates efficient asset use
Teradata Corporation Weaknesses
- Unfavorable profitability metrics: ROE and ROIC at 0%
- Poor liquidity ratios: current and quick ratios at 0
- Unfavorable asset turnover and interest coverage
- Neutral net margin (7.82%) and PE (22.1) limit upside
Strategy Inc Weaknesses
- Negative profitability: net margin -886%, ROE -8.29%, ROIC -6.19%
- Unfavorable WACC (17%) and interest coverage
- Negative PE (-9.98) despite favorable PB
- Current ratio high (5.62) but flagged as unfavorable
Teradata shows solid diversification and conservative leverage but struggles with profitability and liquidity. Strategy Inc demonstrates asset efficiency and strong liquidity but suffers from severe profitability and cost of capital issues. Both companies face challenges that could impact growth and capital allocation strategies.
The Moat Duel: Analyzing Competitive Defensibility
A structural moat is the core safeguard preserving long-term profits against relentless competitive pressures. Let’s examine how each company defends its turf:
Teradata Corporation: Enterprise Data Integration Moat
Teradata’s moat stems from its integrated multi-cloud analytics platform, creating high switching costs. This manifests in stable gross margins near 59%, though revenue has declined. Expansion into cloud ecosystems remains critical in 2026 to sustain relevance.
Strategy Inc: Bitcoin Treasury & AI Analytics Moat
Strategy’s unique dual moat combines bitcoin treasury holdings with AI-powered analytics software. Unlike Teradata, it faces volatile net margins and negative ROIC, yet its growing ROIC trend signals improving capital efficiency. Market disruption depends on successful AI adoption.
Verdict: Integrated Cloud Ecosystem vs. Crypto-Analytics Innovation
Teradata boasts a wider moat through entrenched client ecosystems and margin stability, despite recent revenue pressure. Strategy’s moat is narrower but deepening due to rising ROIC and innovation. Teradata is better positioned to defend its market share long term.
Which stock offers better returns?
Over the past 12 months, Teradata Corporation and Strategy Inc experienced notable price shifts with contrasting trading behaviors and trend dynamics.
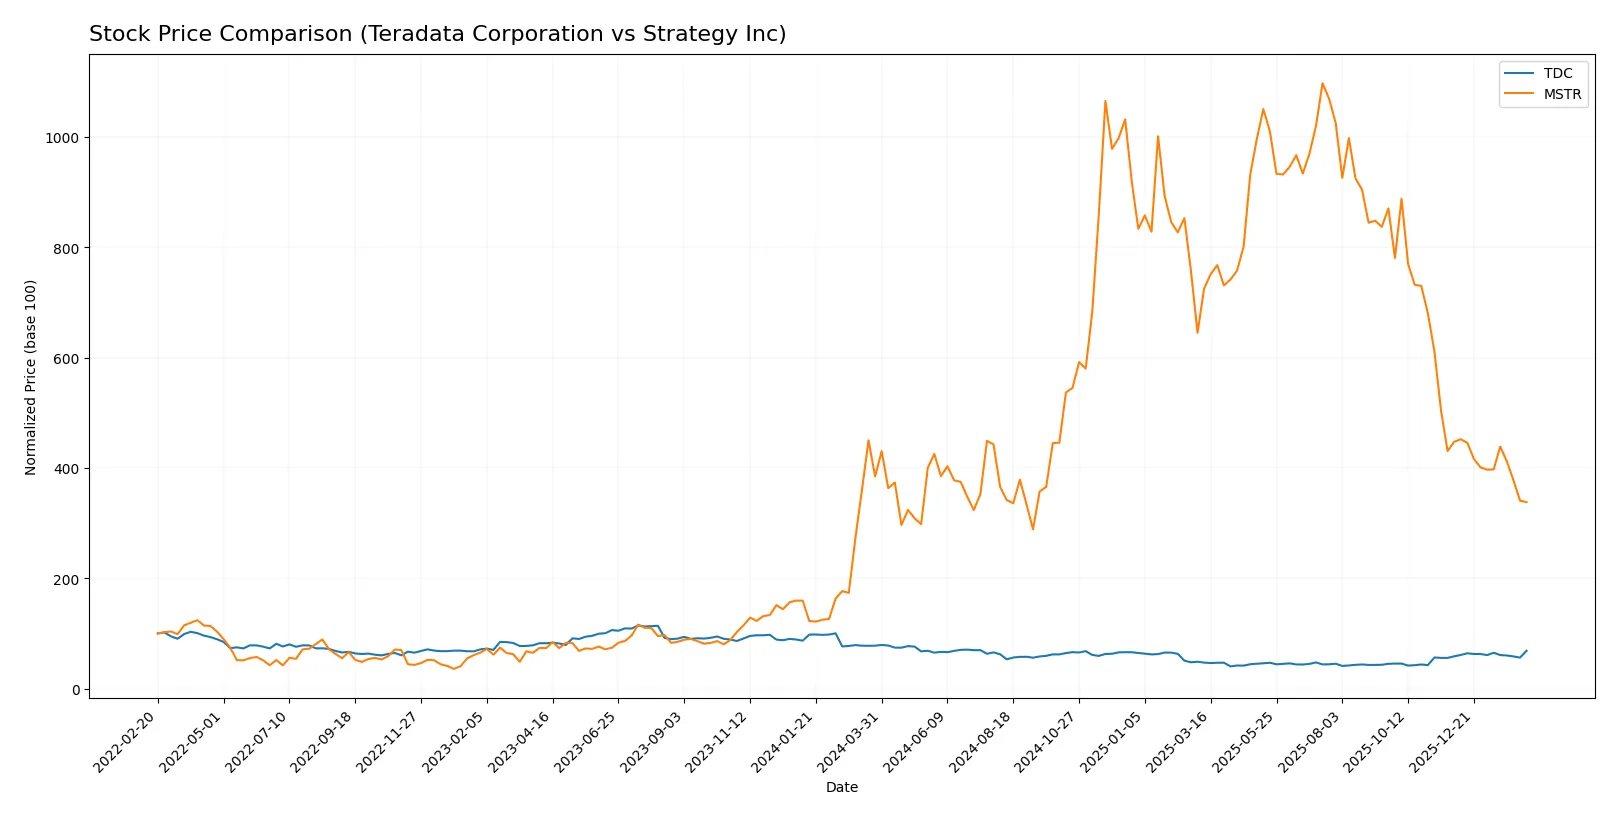
Trend Comparison
Teradata Corporation’s stock declined by 11.87% over the past year, marking a bearish trend with accelerating downward momentum and moderate volatility (5.29 std deviation).
Strategy Inc’s stock fell 12.09% over the same period, also bearish but with decelerating downward pressure and extremely high volatility (101.79 std deviation).
Teradata shows a recent rebound with a 17.18% gain, while Strategy Inc continues to weaken, losing 24.44% recently, placing Teradata ahead in short-term market performance.
Target Prices
Analysts present a mixed but insightful target consensus for Teradata Corporation and Strategy Inc.
| Company | Target Low | Target High | Consensus |
|---|---|---|---|
| Teradata Corporation | 27 | 40 | 35 |
| Strategy Inc | 175 | 705 | 374.5 |
Teradata’s consensus target of 35 slightly exceeds its current 33.56 price, signaling moderate upside. Strategy Inc’s consensus at 374.5 far surpasses its 133.88 price, reflecting high volatility and bullish expectations despite wide target ranges.

Don’t Let Luck Decide Your Entry Point
Optimize your entry points with our advanced ProRealTime indicators. You’ll get efficient buy signals with precise price targets for maximum performance. Start outperforming now!
How do institutions grade them?
The following tables summarize recent institutional grades for Teradata Corporation and Strategy Inc:
Teradata Corporation Grades
This table details the latest grades issued by reputable financial institutions for Teradata Corporation.
| Grading Company | Action | New Grade | Date |
|---|---|---|---|
| Citigroup | Maintain | Buy | 2026-02-12 |
| RBC Capital | Maintain | Sector Perform | 2026-02-11 |
| Citizens | Maintain | Market Outperform | 2026-02-11 |
| Barclays | Maintain | Underweight | 2026-02-11 |
| Evercore ISI Group | Maintain | Outperform | 2026-02-11 |
| Citigroup | Maintain | Buy | 2026-02-04 |
| Barclays | Maintain | Underweight | 2026-01-12 |
| RBC Capital | Maintain | Sector Perform | 2026-01-05 |
| Morgan Stanley | Maintain | Overweight | 2025-12-17 |
| Citizens | Upgrade | Market Outperform | 2025-11-10 |
Strategy Inc Grades
This table presents recent grades from recognized financial analysts for Strategy Inc.
| Grading Company | Action | New Grade | Date |
|---|---|---|---|
| Cantor Fitzgerald | Maintain | Overweight | 2026-02-09 |
| BTIG | Maintain | Buy | 2026-02-06 |
| Canaccord Genuity | Maintain | Buy | 2026-02-04 |
| Mizuho | Maintain | Outperform | 2026-01-16 |
| TD Cowen | Maintain | Buy | 2026-01-15 |
| Citigroup | Maintain | Buy | 2025-12-22 |
| Bernstein | Maintain | Outperform | 2025-12-08 |
| Monness, Crespi, Hardt | Upgrade | Neutral | 2025-11-10 |
| Canaccord Genuity | Maintain | Buy | 2025-11-03 |
| HC Wainwright & Co. | Maintain | Buy | 2025-11-03 |
Which company has the best grades?
Strategy Inc consistently receives higher grades, including multiple “Buy” and “Outperform” ratings. Teradata shows mixed grades with notable “Underweight” calls. Investors may view Strategy Inc as favored by analysts, potentially signaling stronger confidence.
Risks specific to each company
The following categories identify the critical pressure points and systemic threats facing both firms in the 2026 market environment:
1. Market & Competition
Teradata Corporation
- Competes in software infrastructure with moderate net margins and neutral PE ratio, facing steady tech sector rivalry.
Strategy Inc
- Operates in bitcoin treasury and AI software with high volatility and negative profitability, facing disruptive fintech competition.
2. Capital Structure & Debt
Teradata Corporation
- Favorable debt ratios but poor liquidity and interest coverage signal refinancing risks.
Strategy Inc
- Moderate debt-to-equity with strong quick ratio but negative interest coverage reflects financial stress and risk of cash flow shortfalls.
3. Stock Volatility
Teradata Corporation
- Low beta (0.54) indicates relative stock stability amid market fluctuations.
Strategy Inc
- Extremely high beta (3.54) signals pronounced stock volatility and exposure to speculative swings.
4. Regulatory & Legal
Teradata Corporation
- Operates globally in regulated tech sectors with potential compliance costs but no major legal red flags.
Strategy Inc
- Faces regulatory scrutiny due to bitcoin treasury operations and evolving cryptocurrency laws across multiple jurisdictions.
5. Supply Chain & Operations
Teradata Corporation
- Multi-cloud platform relies on stable global data infrastructure; risks stem from tech disruptions and service continuity.
Strategy Inc
- Relies on proprietary AI software and bitcoin asset management, vulnerable to operational risks in crypto market and tech integrations.
6. ESG & Climate Transition
Teradata Corporation
- As a tech infrastructure provider, has moderate ESG exposure, with opportunities in sustainable cloud solutions.
Strategy Inc
- Cryptocurrency focus raises ESG concerns, particularly energy consumption and regulatory pressures on climate impact.
7. Geopolitical Exposure
Teradata Corporation
- Global presence across Americas, EMEA, and APAC exposes it to trade and policy risks but with diversified markets.
Strategy Inc
- International bitcoin operations amplify geopolitical risk from sanctions, crypto bans, and cross-border regulatory divergence.
Which company shows a better risk-adjusted profile?
Teradata’s most impactful risk lies in its weak liquidity and interest coverage, signaling potential refinancing challenges. Strategy Inc’s dominant risk is its severe profitability losses and high stock volatility driven by bitcoin exposure. Teradata shows a more stable risk-adjusted profile despite some financial weaknesses. Strategy’s extreme beta and negative ROIC reflect a riskier investment. Teradata’s Altman Z-Score in distress zone contrasts with Strategy’s grey zone score, but Strategy’s very weak Piotroski score signals fundamental fragility. Recent data reveal Strategy’s stock surged 8.8% recently, underscoring speculative volatility concerns.
Final Verdict: Which stock to choose?
Teradata Corporation’s superpower lies in its consistent ability to generate solid free cash flow and maintain healthy gross margins. I see it as a resilient cash machine, albeit with a point of vigilance in its declining ROIC trend and liquidity constraints. It suits portfolios seeking steady income with moderate risk tolerance.
Strategy Inc commands a strategic moat through its intangible assets and potential for ROIC improvement, supported by a strong current ratio that provides safety relative to Teradata. However, its profitability struggles and volatile cash flows present caution. It fits investors who pursue a GARP approach with appetite for turnaround stories.
If you prioritize stable free cash flow and income generation, Teradata outshines due to its operational efficiency and conservative balance sheet. However, if you seek growth potential with a speculative edge, Strategy offers better upside through improving capital returns but demands tolerance for volatility and financial risk.
Disclaimer: Investment carries a risk of loss of initial capital. The past performance is not a reliable indicator of future results. Be sure to understand risks before making an investment decision.
Go Further
I encourage you to read the complete analyses of Teradata Corporation and Strategy Inc to enhance your investment decisions: