In today’s rapidly evolving tech landscape, Teradata Corporation (TDC) and Elastic N.V. (ESTC) stand out as leaders in data-driven solutions. Teradata excels in multi-cloud data platforms for enterprise analytics, while Elastic innovates with its versatile search and data visualization software. Both companies compete within technology sectors focused on harnessing data, making this comparison crucial. Join me as we explore which firm offers the most compelling investment opportunity in 2026.
Table of contents
Companies Overview
I will begin the comparison between Teradata Corporation and Elastic N.V. by providing an overview of these two companies and their main differences.
Teradata Corporation Overview
Teradata Corporation provides a connected multi-cloud data platform aimed at enterprise analytics, enabling companies to leverage data across their operations. Its flagship product, Teradata Vantage, supports data integration and ecosystem simplification, helping clients migrate to cloud environments. The company also offers consulting, support, and maintenance services across various sectors including financial services and telecommunications, and operates globally from its headquarters in San Diego, California.
Elastic N.V. Overview
Elastic N.V. delivers software solutions designed for multi-cloud environments, centered around its Elastic Stack product suite. This includes Elasticsearch for real-time search and analytics, Kibana for data visualization, and other components facilitating data ingestion, processing, and security. Founded in 2012 and based in Mountain View, California, Elastic serves users needing advanced search, monitoring, and data analysis capabilities across diverse data types and applications.
Key similarities and differences
Both Teradata and Elastic operate in the technology sector with a focus on software solutions that manage and analyze data in cloud environments. Teradata emphasizes enterprise analytics platforms with consulting services, targeting broad industry sectors, while Elastic focuses on search and data ingestion technologies with a specialized software stack. Their business models differ in scope, with Teradata providing integrated migration and consulting, and Elastic offering modular software products for multi-cloud data handling.
Income Statement Comparison
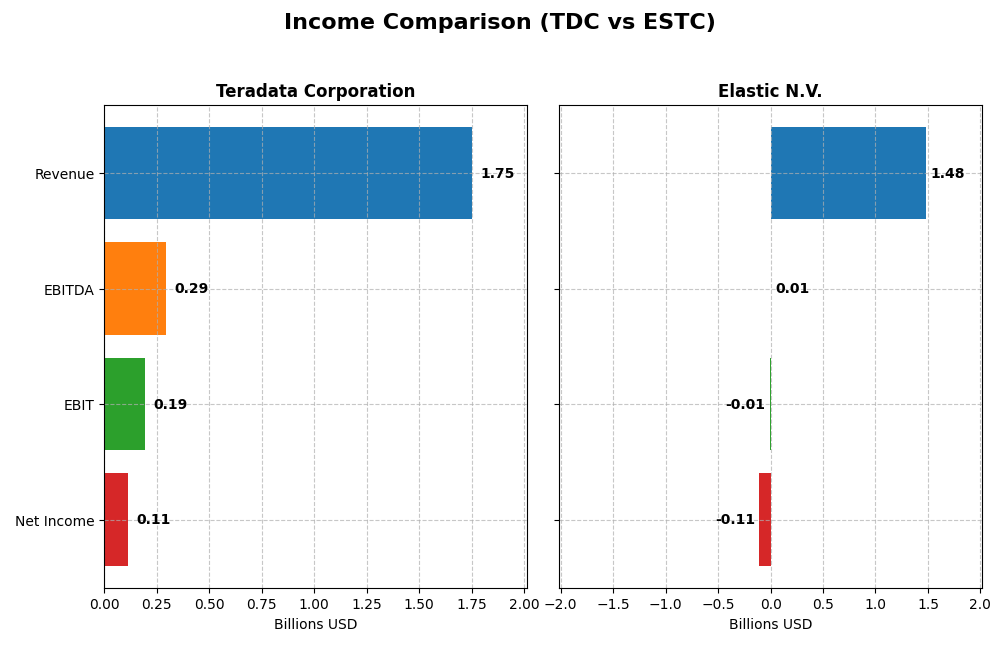
The table below presents a side-by-side comparison of key income statement metrics for Teradata Corporation and Elastic N.V. based on their most recent fiscal year data.
| Metric | Teradata Corporation (TDC) | Elastic N.V. (ESTC) |
|---|---|---|
| Market Cap | 2.82B | 7.65B |
| Revenue | 1.75B | 1.48B |
| EBITDA | 293M | 6.1M |
| EBIT | 193M | -6.3M |
| Net Income | 114M | -108M |
| EPS | 1.18 | -1.04 |
| Fiscal Year | 2024 | 2025 |
Income Statement Interpretations
Teradata Corporation
Teradata’s revenue showed a slight decline over 2020-2024, falling by 4.68%, while net income dropped 11.63%. Despite this, gross and EBIT margins remained favorable at 60.46% and 11.03%, respectively. In 2024, net income nearly doubled with a 92.59% margin increase, reflecting improved profitability despite lower sales.
Elastic N.V.
Elastic experienced strong revenue growth of 143.77% from 2021 to 2025, with net income up 16.47%. Its gross margin is robust at 74.39%, but EBIT and net margins remain negative, at -0.42% and -7.29%. The 2025 results showed higher revenue and EBIT but continued net losses, indicating ongoing investments impacting profitability.
Which one has the stronger fundamentals?
Teradata presents a stable margin structure and recent net income growth despite declining revenue, signaling controlled profitability. Elastic’s rapid revenue expansion and improving EBIT contrast with persistent net losses, reflecting growth-stage challenges. Both companies have favorable income statement evaluations, but Teradata shows steadier profitability, while Elastic focuses on scaling.
Financial Ratios Comparison
The table below compares the most recent key financial ratios for Teradata Corporation (TDC) and Elastic N.V. (ESTC) as of their latest fiscal year-end.
| Ratios | Teradata Corporation (TDC) 2024 | Elastic N.V. (ESTC) 2025 |
|---|---|---|
| ROE | 85.7% | -11.7% |
| ROIC | 16.9% | -11.8% |
| P/E | 26.3 | -82.7 |
| P/B | 22.6 | 9.64 |
| Current Ratio | 0.81 | 1.92 |
| Quick Ratio | 0.79 | 1.92 |
| D/E (Debt-to-Equity) | 4.33 | 0.64 |
| Debt-to-Assets | 33.8% | 22.9% |
| Interest Coverage | 7.21 | -2.17 |
| Asset Turnover | 1.03 | 0.57 |
| Fixed Asset Turnover | 9.07 | 51.3 |
| Payout ratio | 0 | 0 |
| Dividend yield | 0 | 0 |
Interpretation of the Ratios
Teradata Corporation
Teradata shows a mixed set of ratios with strong return on equity (85.71%) and return on invested capital (16.89%), but weak liquidity indicated by a current ratio of 0.81. Valuation ratios like P/E at 26.34 and P/B at 22.58 appear elevated. The company does not pay dividends, likely prioritizing reinvestment or growth strategies over shareholder payouts.
Elastic N.V.
Elastic faces challenges with negative net margin (-7.29%), negative returns on equity (-11.66%) and invested capital (-11.8%), though it maintains solid liquidity with a current ratio of 1.92. Its P/E ratio is negative, reflecting losses. Like Teradata, it pays no dividends, which may stem from ongoing investment in R&D and expansion given its fiscal profile.
Which one has the best ratios?
Both companies present a balanced mix of favorable and unfavorable ratios, resulting in a neutral overall evaluation. Teradata excels in profitability metrics but struggles with liquidity and valuation, while Elastic shows better liquidity but suffers from negative profitability and coverage ratios. Neither distinctly outperforms the other in this comparison.
Strategic Positioning
This section compares the strategic positioning of Teradata Corporation and Elastic N.V., including market position, key segments, and exposure to technological disruption:
Teradata Corporation
- Established player in software infrastructure with moderate competitive pressure.
- Diverse revenue streams: consulting, recurring product and service, subscription licenses.
- Focuses on multi-cloud data platforms and enterprise analytics, adapting to cloud migration.
Elastic N.V.
- Growing presence in software application with competitive market dynamics.
- Concentrated on subscription software and professional services.
- Offers Elastic Stack for multi-cloud environments, emphasizing search and data ingestion.
Teradata Corporation vs Elastic N.V. Positioning
Teradata’s diversified portfolio spans consulting and recurring services, supporting enterprise analytics across sectors. Elastic concentrates on subscription software and search technologies in multi-cloud settings. Teradata’s broader industry coverage contrasts with Elastic’s focused product approach.
Which has the best competitive advantage?
Teradata shows a very favorable moat with strong ROIC exceeding WACC and a growing trend, indicating durable competitive advantage. Elastic’s negative ROIC compared to WACC suggests value destruction despite improving profitability, implying a weaker competitive moat.
Stock Comparison
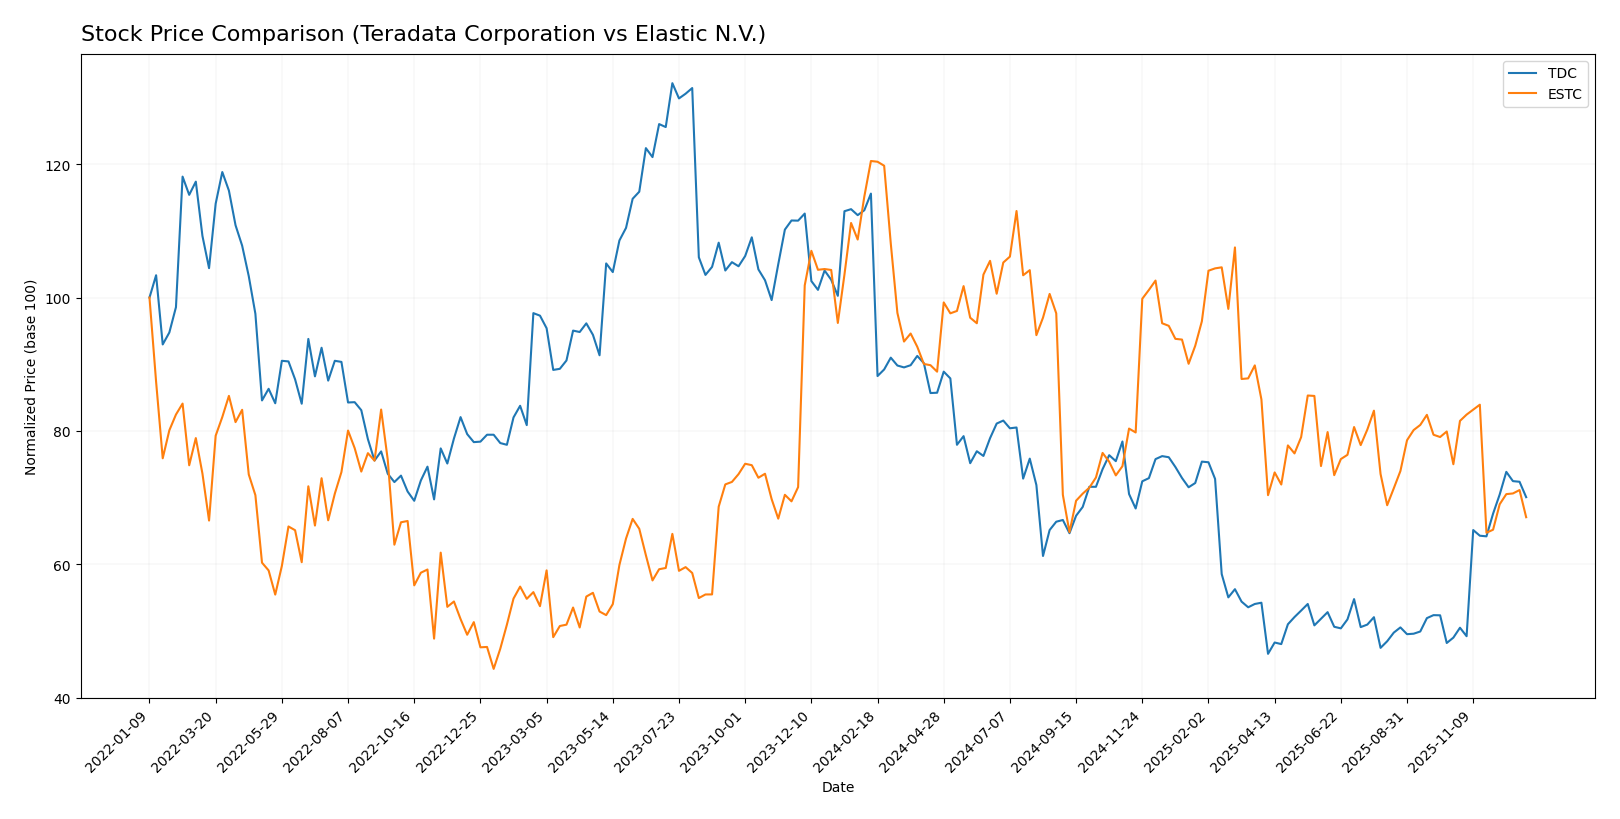
The stock prices of Teradata Corporation (TDC) and Elastic N.V. (ESTC) have shown significant bearish trends over the past 12 months, with notable volatility and contrasting recent momentum patterns.
Trend Analysis
Teradata Corporation’s stock has experienced a bearish trend over the past year, declining by 39.4% with accelerating downward momentum. The price ranged between 19.73 and 48.99, with moderate volatility (6.06 std deviation). Recently, from October 2025 to January 2026, it rebounded 43.02%, indicating a short-term bullish acceleration.
Elastic N.V.’s stock also followed a bearish trend over the last 12 months, dropping 44.35% with decelerating price decline. The volatility was higher (14.77 std deviation), with prices fluctuating between 70.04 and 130.39. However, the recent trend from October 2025 to January 2026 remained negative, with a 10.6% decrease and increased volatility (7.52 std deviation).
Comparing both, Teradata’s recent positive reversal contrasts with Elastic’s ongoing decline, though Elastic’s overall 12-month loss is larger. Teradata has delivered the highest short-term market performance within the analyzed period.
Target Prices
The current analyst consensus presents a clear target price range for Teradata Corporation and Elastic N.V.
| Company | Target High | Target Low | Consensus |
|---|---|---|---|
| Teradata Corporation | 35 | 24 | 29.5 |
| Elastic N.V. | 134 | 76 | 108 |
Analysts expect Teradata’s price to stay near its current level of $29.69, while Elastic’s consensus target of $108 suggests significant upside from its current $72.56.
Analyst Opinions Comparison
This section compares analysts’ ratings and grades for Teradata Corporation and Elastic N.V.:
Rating Comparison
Teradata Corporation Rating
- Rating: B+ indicating a very favorable overall assessment.
- Discounted Cash Flow Score: 4, considered favorable for valuation.
- ROE Score: 5, very favorable, showing efficient profit generation from equity.
- ROA Score: 4, favorable in asset utilization to generate earnings.
- Debt To Equity Score: 1, very unfavorable, highlighting high financial risk.
- Overall Score: 3, moderate summary of financial standing.
Elastic N.V. Rating
- Rating: C- reflecting a very unfavorable overall assessment.
- Discounted Cash Flow Score: 3, a moderate indication for valuation.
- ROE Score: 1, very unfavorable, indicating poor efficiency in profit use.
- ROA Score: 1, very unfavorable, showing weak asset utilization.
- Debt To Equity Score: 1, very unfavorable, indicating high financial risk.
- Overall Score: 1, very unfavorable summary of financial standing.
Which one is the best rated?
Teradata Corporation is clearly better rated, with a B+ rating and favorable to very favorable scores in key metrics. Elastic N.V. shows a C- rating and mostly very unfavorable scores, indicating weaker financial health.
Scores Comparison
Here is the comparison of Teradata Corporation and Elastic N.V. scores:
TDC Scores
- Altman Z-Score: 0.65, indicating financial distress zone.
- Piotroski Score: 8, reflecting very strong financial health.
ESTC Scores
- Altman Z-Score: 3.23, indicating a safe zone from bankruptcy.
- Piotroski Score: 4, reflecting average financial strength.
Which company has the best scores?
Based on the provided data, ESTC has a better Altman Z-Score in the safe zone, while TDC shows a stronger Piotroski Score indicating better financial strength. Each company leads in one score.
Grades Comparison
Here is the comparison of recent grades assigned to Teradata Corporation and Elastic N.V.:
Teradata Corporation Grades
This table shows grades from various reliable institutions for Teradata Corporation:
| Grading Company | Action | New Grade | Date |
|---|---|---|---|
| Morgan Stanley | Maintain | Overweight | 2025-12-17 |
| Citizens | Upgrade | Market Outperform | 2025-11-10 |
| Barclays | Maintain | Underweight | 2025-11-05 |
| Evercore ISI Group | Maintain | Outperform | 2025-11-05 |
| TD Cowen | Maintain | Hold | 2025-11-05 |
| UBS | Maintain | Neutral | 2025-08-06 |
| Guggenheim | Maintain | Buy | 2025-05-07 |
| Barclays | Maintain | Underweight | 2025-04-21 |
| Citizens Capital Markets | Maintain | Market Perform | 2025-03-18 |
| JMP Securities | Maintain | Market Perform | 2025-02-13 |
Teradata’s grades display a range from Underweight to Buy, with several institutions maintaining positive outlooks such as Overweight and Outperform.
Elastic N.V. Grades
This table lists recent grades from credible firms for Elastic N.V.:
| Grading Company | Action | New Grade | Date |
|---|---|---|---|
| Citigroup | Maintain | Buy | 2025-11-24 |
| Cantor Fitzgerald | Maintain | Neutral | 2025-11-21 |
| Stifel | Maintain | Buy | 2025-11-21 |
| B of A Securities | Maintain | Neutral | 2025-11-21 |
| DA Davidson | Maintain | Neutral | 2025-11-21 |
| Scotiabank | Maintain | Sector Perform | 2025-11-21 |
| Piper Sandler | Maintain | Overweight | 2025-11-21 |
| Jefferies | Maintain | Buy | 2025-11-21 |
| Wedbush | Maintain | Outperform | 2025-11-21 |
| Guggenheim | Maintain | Buy | 2025-11-21 |
Elastic N.V. consistently holds positive ratings, with multiple Buy and Outperform grades and no downgrades reported.
Which company has the best grades?
Elastic N.V. has received generally stronger and more consistently positive grades compared to Teradata Corporation, reflecting a more favorable analyst sentiment that may influence investor confidence and portfolio decisions.
Strengths and Weaknesses
Here is a comparative overview of the key strengths and weaknesses of Teradata Corporation (TDC) and Elastic N.V. (ESTC) based on their latest financial and strategic data.
| Criterion | Teradata Corporation (TDC) | Elastic N.V. (ESTC) |
|---|---|---|
| Diversification | Strong diversification with multiple recurring revenue streams including consulting, subscription software, and services. | Focused mainly on subscription and professional services, less diversified. |
| Profitability | Favorable profitability with ROIC at 16.9%, ROE at 85.7%, net margin 6.5%. | Negative profitability metrics: ROIC -11.8%, ROE -11.7%, net margin -7.3%. |
| Innovation | Moderate innovation, steady growth in subscription software licenses, but limited hardware presence. | High innovation suggested by rapid subscription growth and increasing professional services. |
| Global presence | Established global footprint with consistent international revenue. | Growing global exposure but less established internationally. |
| Market Share | Stable market share supported by durable competitive advantage and strong ROIC trend. | Market share challenged due to value destruction, though improving profitability trend. |
Key takeaways: Teradata demonstrates a durable competitive advantage with strong profitability and diversified revenue, making it more stable. Elastic shows promising innovation and growth but faces profitability challenges, indicating higher risk but potential for turnaround.
Risk Analysis
Below is a comparison table highlighting key risks for Teradata Corporation (TDC) and Elastic N.V. (ESTC) based on the most recent financial and operational data from 2025-2026.
| Metric | Teradata Corporation (TDC) | Elastic N.V. (ESTC) |
|---|---|---|
| Market Risk | Beta 0.576, lower volatility | Beta 0.97, higher market sensitivity |
| Debt level | High debt-to-equity (4.33, very unfavorable) | Moderate debt-to-equity (0.64, neutral) |
| Regulatory Risk | Moderate, operating globally in tech sector | Moderate, multi-cloud compliance needs |
| Operational Risk | Stable infrastructure software operations | Rapid innovation cycle, application software risks |
| Environmental Risk | Low impact, mainly software services | Low impact, cloud-based services |
| Geopolitical Risk | Exposure to global markets, moderate | Exposure to US and global markets, moderate |
Teradata shows higher financial leverage risk with a debt-to-equity ratio well above industry comfort levels, increasing vulnerability under market stress. Elastic faces operational risks linked to innovation demands and negative profitability trends but benefits from a safer debt profile. Market volatility is higher for Elastic, impacting share price stability. Both companies have moderate regulatory and geopolitical exposures typical for technology firms operating internationally.
Which Stock to Choose?
Teradata Corporation (TDC) shows a mixed income evolution with a slight revenue decline but improved EBIT and net margin growth. Its financial ratios are balanced, featuring favorable ROE and ROIC but challenged liquidity and leverage ratios. The company carries moderate debt levels and holds a very favorable overall rating.
Elastic N.V. (ESTC) demonstrates strong revenue growth and increasing profitability over the long term despite negative net margins recently. Its financial ratios reveal weaknesses in profitability and debt management but favorable liquidity. The firm has low debt relative to assets and a very favorable rating on some metrics, though overall scores reflect caution.
Investors prioritizing stability and quality might find Teradata’s consistent value creation and strong returns on capital more appealing, while those with a tolerance for risk and a focus on growth could interpret Elastic’s rising topline and improving profitability as promising signals, despite current challenges.
Disclaimer: Investment carries a risk of loss of initial capital. The past performance is not a reliable indicator of future results. Be sure to understand risks before making an investment decision.
Go Further
I encourage you to read the complete analyses of Teradata Corporation and Elastic N.V. to enhance your investment decisions: