Home > Comparison > Technology > TDY vs TRMB
The strategic rivalry between Teledyne Technologies Incorporated and Trimble Inc. shapes the trajectory of the hardware, equipment & parts sector. Teledyne operates as a diversified industrial technology leader with a strong aerospace and defense focus. Trimble specializes in high-tech software and precision solutions for construction, agriculture, and transportation. This analysis pits industrial breadth against specialized innovation to identify which path offers superior risk-adjusted returns for diversified portfolios.

Table of contents
Companies Overview
Teledyne Technologies and Trimble stand as key players in the Hardware, Equipment & Parts industry, shaping technology markets worldwide.
Teledyne Technologies Incorporated: Enabler of Industrial Precision
Teledyne dominates industrial growth markets with advanced instrumentation and imaging technologies. It generates revenue through monitoring instruments, digital imaging sensors, and aerospace electronics. In 2026, it strategically emphasizes systems engineering and electrochemical energy solutions for defense and environmental applications, reinforcing its technological edge.
Trimble Inc.: Innovator in Field and Mobile Work Solutions
Trimble leads by providing technology solutions that optimize construction, agriculture, and transportation workflows. Its revenue stems from software for design, asset management, precision agriculture, and fleet systems. The company’s 2026 focus centers on expanding integrated software platforms to enhance mobility, data sharing, and operational efficiency for field professionals.
Strategic Collision: Similarities & Divergences
Both companies excel in hardware and software integration but diverge in their market approach. Teledyne prioritizes a closed, defense-oriented ecosystem with high-tech instrumentation. Trimble embraces an open, cross-industry platform focusing on workflow optimization. Their competition converges on digital transformation in industrial sectors, yet their investment profiles differ—Teledyne favors high-barrier innovation; Trimble bets on scalable software solutions.
Income Statement Comparison
This data dissects the core profitability and scalability of both corporate engines to reveal who dominates the bottom line:
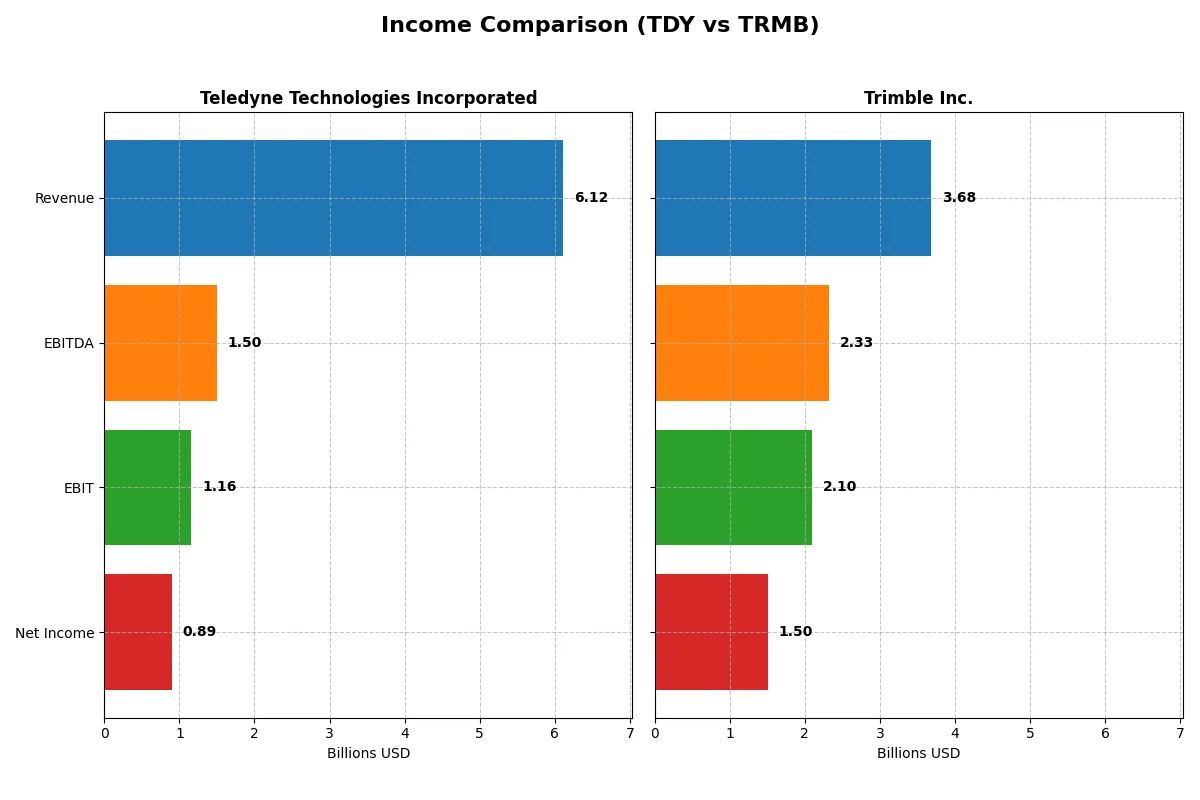
| Metric | Teledyne Technologies Incorporated (TDY) | Trimble Inc. (TRMB) |
|---|---|---|
| Revenue | 6.12B | 3.68B |
| Cost of Revenue | 3.72B | 1.29B |
| Operating Expenses | 1.25B | 1.94B |
| Gross Profit | 2.40B | 2.40B |
| EBITDA | 1.50B | 2.33B |
| EBIT | 1.16B | 2.10B |
| Interest Expense | 59.6M | 90.7M |
| Net Income | 895M | 1.50B |
| EPS | 18.88 | 6.13 |
| Fiscal Year | 2025 | 2024 |
Income Statement Analysis: The Bottom-Line Duel
This income statement comparison reveals the true operational efficiency and profitability of two distinct corporate engines over recent years.
Teledyne Technologies Incorporated Analysis
Teledyne’s revenue climbed steadily from 4.6B in 2021 to 6.1B in 2025, nearly doubling net income from 445M to 895M. Its gross margin remains robust near 39%, while net margin holds a healthy 14.6%. The latest year shows improving EBIT growth (+16.6%) and EPS growth (+9.7%), signaling strong operational momentum despite a slight dip in gross profit growth.
Trimble Inc. Analysis
Trimble’s revenue grew more modestly, from 3.1B in 2020 to 3.7B in 2024, with net income surging from 390M to 1.5B. It boasts an exceptional gross margin of 65% and a net margin above 40%, reflecting high profitability. Despite a recent 3% revenue drop, EBIT and net margin exploded by over 300%, driven by sharp cost control and operational leverage in 2024.
Margin Power vs. Revenue Scale
Trimble outperforms Teledyne on margin strength and net income growth, boasting a far superior net margin and a 286% net income rise over five years. Teledyne delivers steadier revenue growth and consistent margin improvement but lags in profitability scale. Investors seeking high margin efficiency will find Trimble’s profile more attractive, while those favoring stable revenue expansion may prefer Teledyne.
Financial Ratios Comparison
These vital ratios act as a diagnostic tool to expose the underlying fiscal health, valuation premiums, and capital efficiency of the companies compared below:
| Ratios | Teledyne Technologies (TDY) | Trimble Inc. (TRMB) |
|---|---|---|
| ROE | 8.5% | 26.2% |
| ROIC | 6.8% | 4.5% |
| P/E | 27.3 | 11.5 |
| P/B | 2.33 | 3.02 |
| Current Ratio | 1.64 | 1.27 |
| Quick Ratio | 1.08 | 1.16 |
| D/E | 0.24 | 0.26 |
| Debt-to-Assets | 16.2% | 15.9% |
| Interest Coverage | 19.3 | 5.1 |
| Asset Turnover | 0.40 | 0.39 |
| Fixed Asset Turnover | 7.29 | 11.81 |
| Payout ratio | 0 | 0 |
| Dividend yield | 0 | 0 |
| Fiscal Year | 2025 | 2024 |
Efficiency & Valuation Duel: The Vital Signs
Financial ratios serve as a company’s DNA, exposing hidden risks and operational strengths crucial for informed investment decisions.
Teledyne Technologies Incorporated
Teledyne shows moderate profitability with an 8.5% ROE and a 14.6% net margin, signaling decent operational efficiency. Its P/E ratio of 27.35 suggests a slightly stretched valuation. The firm favors reinvestment over dividends, focusing on R&D at roughly 5% of revenue, aiming for long-term growth rather than immediate shareholder payouts.
Trimble Inc.
Trimble demonstrates robust profitability with a 26.2% ROE and an impressive 40.8% net margin, indicating strong earnings generation. Its P/E of 11.52 reflects an attractive valuation, though a higher P/B ratio of 3.02 is less favorable. Similar to Teledyne, Trimble does not pay dividends but channels substantial funds into R&D, exceeding 17% of revenue, to support innovation.
Balanced Strength vs. Growth Potential
Trimble offers superior profitability and a more appealing P/E, albeit with some valuation concerns in price-to-book. Teledyne presents a steadier, slightly stretched valuation with balanced reinvestment. Investors prioritizing growth might lean toward Trimble’s aggressive R&D, while those seeking operational consistency may prefer Teledyne’s profile.
Which one offers the Superior Shareholder Reward?
I see Teledyne Technologies (TDY) and Trimble Inc. (TRMB) both skip dividends, focusing on growth and buybacks. TDY’s free cash flow per share stands at $23.7 with a payout ratio of 0%, indicating full reinvestment into R&D and acquisitions. Its buyback program is moderate but steady, supporting valuation at 22.8x free cash flow. In contrast, TRMB delivers lower free cash flow per share of $2.0 but maintains aggressive buybacks, reflected in a 34.8x free cash flow multiple. TDY’s model is more sustainable with an operating cash flow coverage ratio near 0.9, while TRMB’s leverage and coverage ratios signal higher risk. I conclude TDY offers a superior total return profile due to robust cash flow, prudent capital allocation, and sustainable shareholder rewards in 2026.
Comparative Score Analysis: The Strategic Profile
The radar chart reveals the fundamental DNA and trade-offs of Teledyne Technologies Incorporated and Trimble Inc., highlighting their financial competencies and valuation nuances:
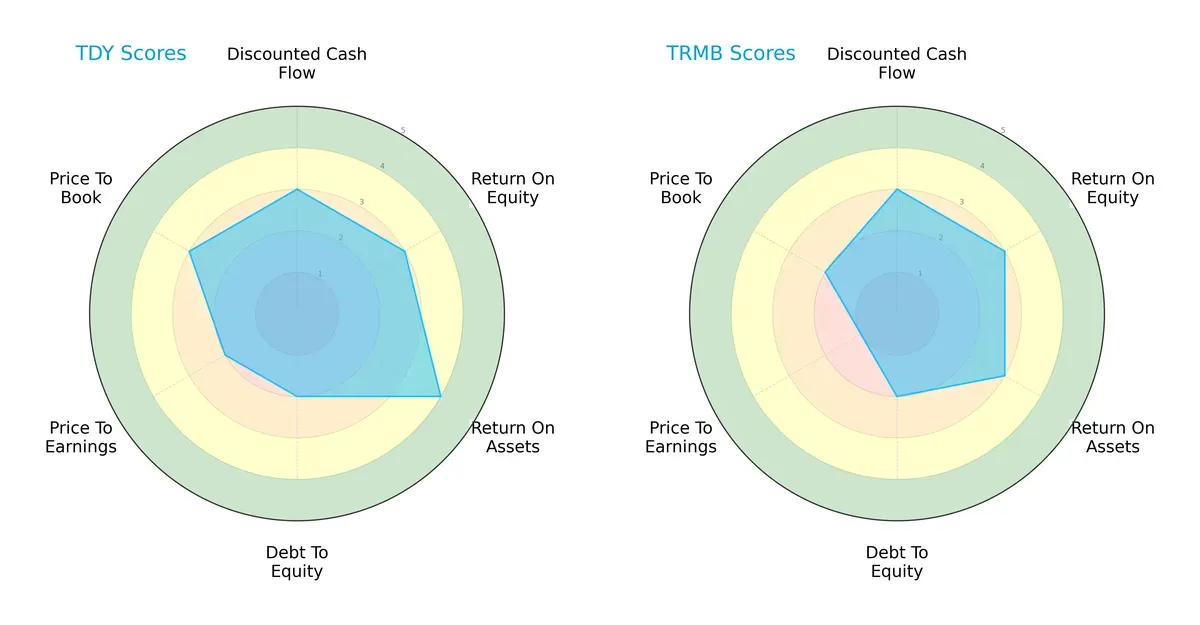
Teledyne displays a more balanced profile with stronger asset efficiency (ROA 4 vs. 3) and better valuation metrics (P/E 2 vs. 1; P/B 3 vs. 2). Both share moderate DCF and ROE scores, but Trimble leans on a cheaper price-to-earnings ratio, signaling potential undervaluation but also higher risk. Teledyne’s diversified strengths suggest steadier capital allocation compared to Trimble’s reliance on valuation edges.
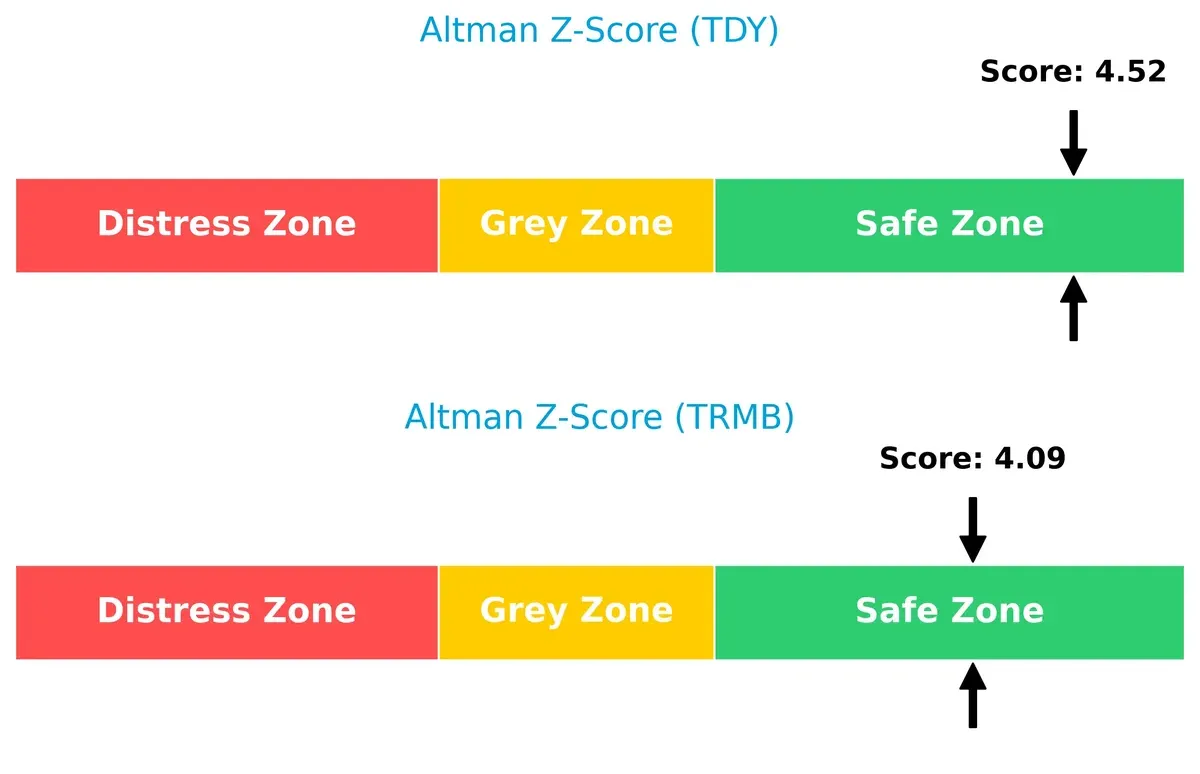
Bankruptcy Risk: Solvency Showdown
Teledyne’s Altman Z-Score (4.52) edges out Trimble’s (4.09), both safely above the distress threshold, indicating solid long-term survival prospects in this market cycle:
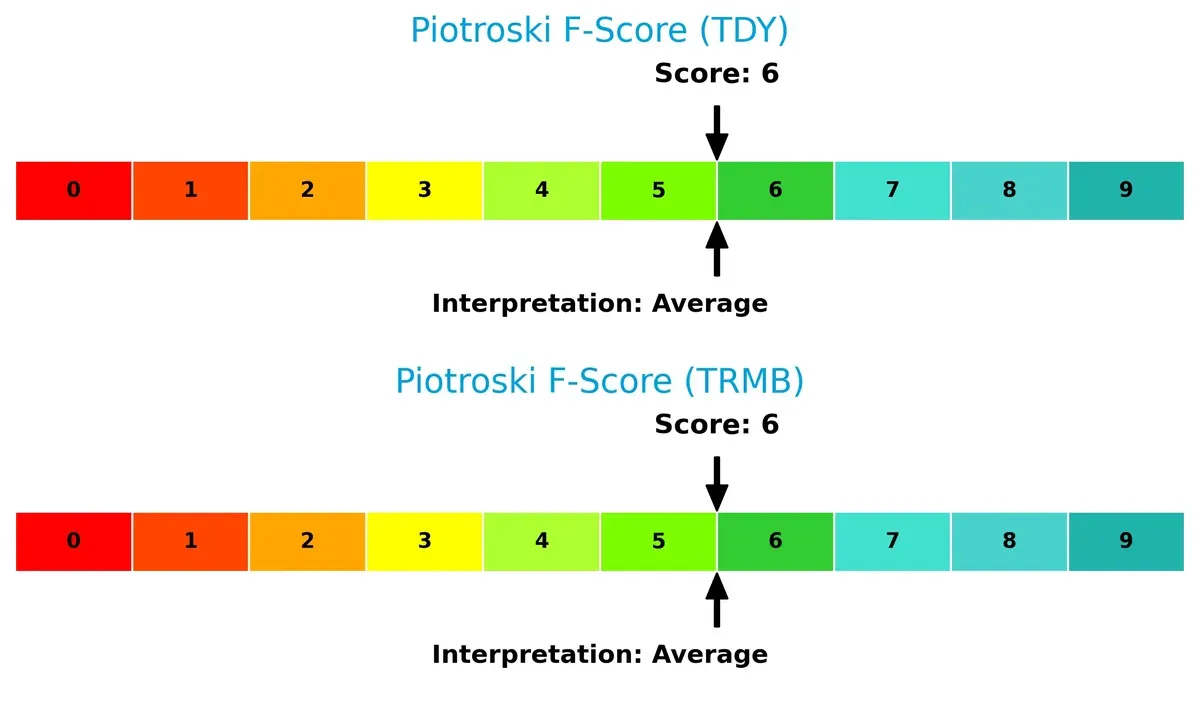
Financial Health: Quality of Operations
Both companies share identical Piotroski F-Scores of 6, reflecting average financial health without glaring red flags in operational quality or internal controls:
How are the two companies positioned?
This section dissects the operational DNA of Teledyne Technologies and Trimble by comparing their revenue distribution and internal strengths and weaknesses. The goal is to confront their economic moats to reveal which model offers the most resilient, sustainable competitive advantage today.
Revenue Segmentation: The Strategic Mix
The following visual comparison dissects how both firms diversify their income streams and where their primary sector bets lie:
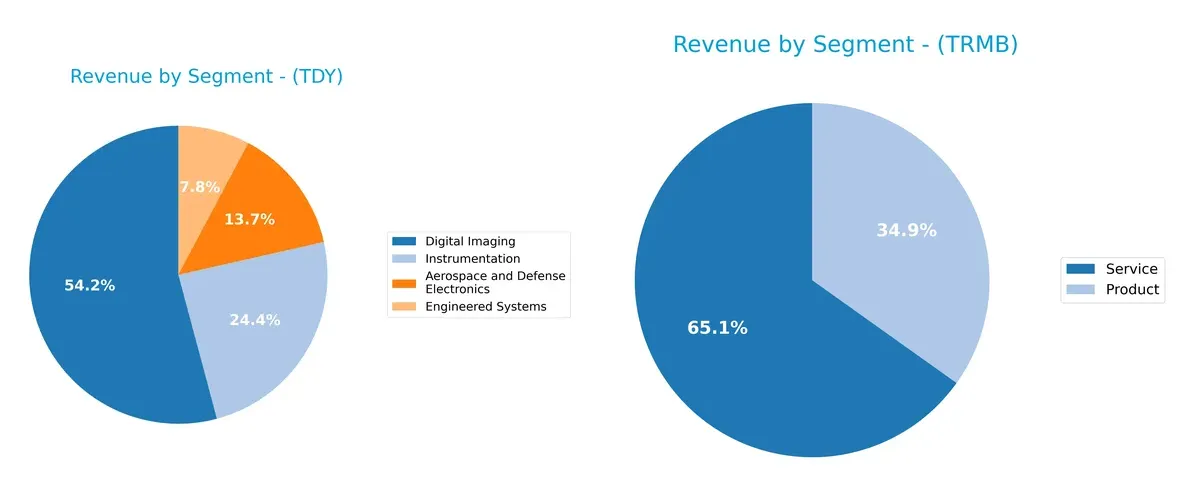
Teledyne anchors its revenue in Digital Imaging at $3.07B, dwarfing other segments like Instrumentation ($1.38B). Its concentration signals a strong moat in imaging technology but poses concentration risk. Trimble, by contrast, pivots between Product ($1.28B) and Service ($2.40B) revenues, showcasing a balanced ecosystem lock-in. Trimble’s diversified streams reduce dependence on any single segment, enhancing resilience in evolving infrastructure markets.
Strengths and Weaknesses Comparison
This table compares the strengths and weaknesses of Teledyne Technologies Incorporated and Trimble Inc.:
Teledyne Strengths
- Diversified revenues across Aerospace, Digital Imaging, Instrumentation, and Engineered Systems
- Favorable net margin at 14.63%
- Strong liquidity with current ratio 1.64 and quick ratio 1.08
- Low debt-to-assets at 16.19% and high interest coverage (19.47)
- Favorable fixed asset turnover (7.29)
Trimble Strengths
- High profitability with net margin at 40.84% and ROE 26.18%
- Favorable quick ratio (1.16) and manageable debt levels (15.96%)
- Strong fixed asset turnover (11.81)
- Reasonable P/E ratio (11.52)
- Solid global presence with significant revenues in North America and Europe
Teledyne Weaknesses
- Unfavorable ROE (8.51%) below WACC (8.21%) indicating weak capital efficiency
- Unfavorable P/E (27.35) suggesting possible overvaluation
- Asset turnover low at 0.40, limiting operational efficiency
- Zero dividend yield may deter income-focused investors
Trimble Weaknesses
- Unfavorable ROIC (4.49%) below WACC (10.74%) indicating value destruction
- Unfavorable P/B ratio (3.02) above sector norms
- Slightly lower current ratio (1.27) signals moderate liquidity risk
- Zero dividend yield limits shareholder income
Both companies demonstrate strong diversification and liquidity, supporting operational resilience. Teledyne’s weaker ROE and higher valuation ratios contrast with Trimble’s superior profitability but weaker capital efficiency. These factors highlight differing strategic focuses on growth versus efficiency.
The Moat Duel: Analyzing Competitive Defensibility
A structural moat shields long-term profits from relentless competition erosion. Without it, market share and margins quickly erode:
Teledyne Technologies Incorporated: Diversified Innovation and Integration Moat
Teledyne’s competitive edge lies in its broad portfolio of advanced instrumentation and aerospace systems. Its slightly unfavorable ROIC vs. WACC signals value destruction, yet rising profitability hints at moat strengthening through innovation and market expansion in 2026.
Trimble Inc.: Software-Driven Precision and Ecosystem Moat
Trimble’s moat centers on integrated software solutions for geospatial and construction sectors, offering sticky customer ecosystems. Despite a very unfavorable ROIC trend, its superior margins and explosive EBIT growth suggest operational strength, though market pressures challenge its moat depth.
Verdict: Diversified Innovation vs. Software Ecosystem Resilience
Teledyne’s growing ROIC amidst value destruction shows a moat in recovery, while Trimble’s declining ROIC signals weakening defensibility despite high margins. I see Teledyne better positioned to defend market share through innovation and integration breadth.
Which stock offers better returns?
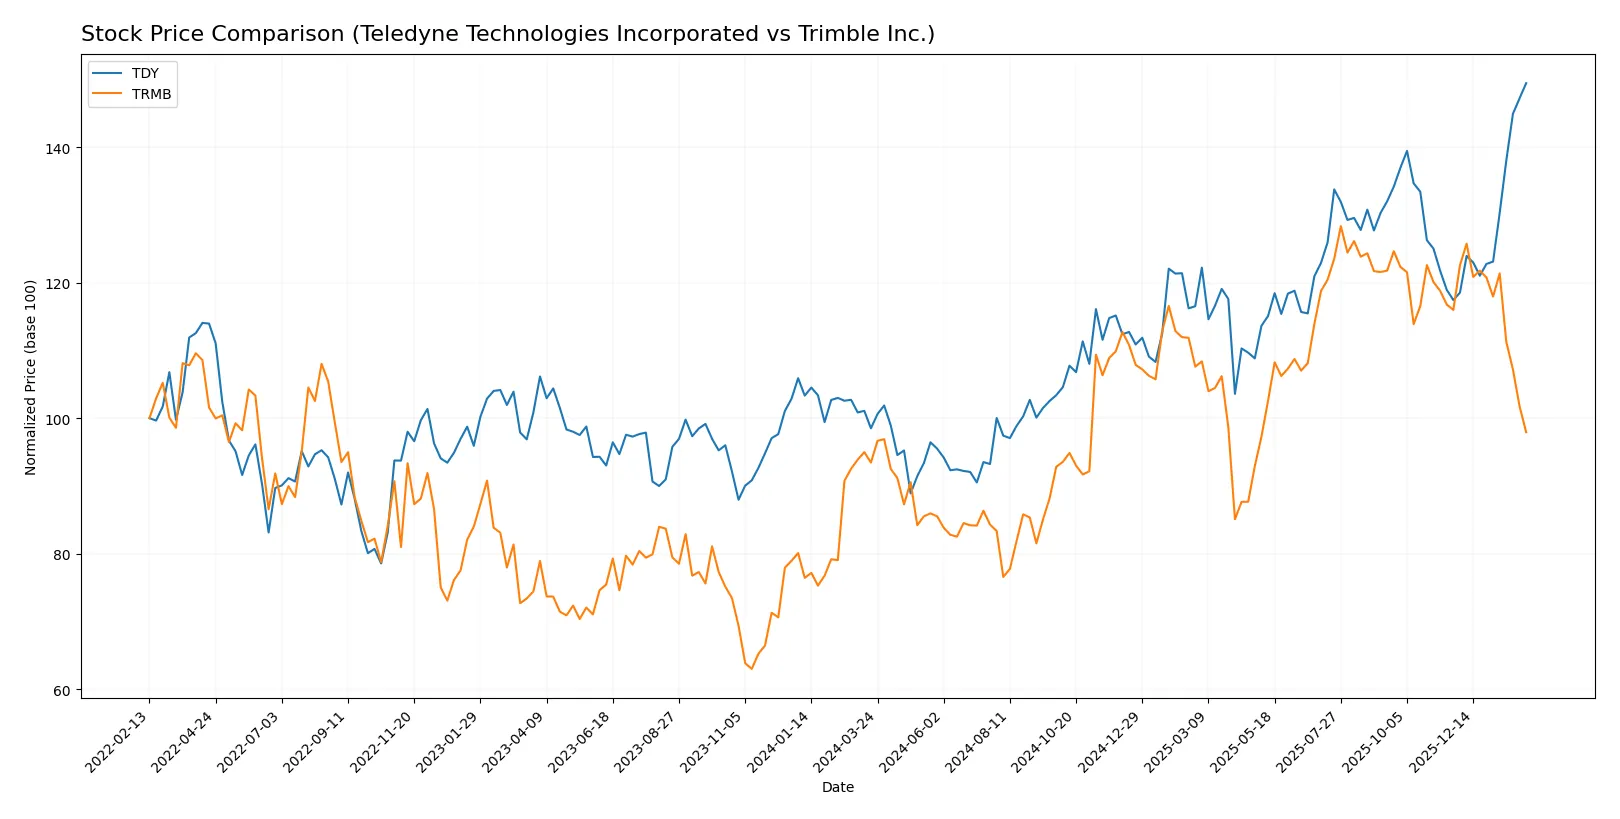
The past year reveals a strong divergence in price momentum, with Teledyne Technologies showing robust gains and Trimble Inc. facing recent downward pressure amid shifting trading dynamics.
Trend Comparison
Teledyne Technologies (TDY) exhibits a bullish trend with a 51.7% price increase over the past 12 months, showing acceleration and a wide price range from 375 to 630.
Trimble Inc. (TRMB) also trends bullish overall with a 4.78% rise but shows deceleration and a narrower price range from 51 to 85. Recent months reveal a 15.57% decline.
Teledyne’s strong upward momentum and recent buyer dominance contrast with Trimble’s weakening trend and seller dominance, making TDY the higher market performer.
Target Prices
Analysts show a moderately bullish consensus for both Teledyne Technologies and Trimble Inc.
| Company | Target Low | Target High | Consensus |
|---|---|---|---|
| Teledyne Technologies Incorporated | 599 | 720 | 638.5 |
| Trimble Inc. | 94 | 102 | 98.2 |
The target consensus for Teledyne stands slightly above its current price of 629.73, indicating modest upside potential. Trimble’s consensus target far exceeds its current 65.04 price, suggesting stronger expected growth.

Don’t Let Luck Decide Your Entry Point
Optimize your entry points with our advanced ProRealTime indicators. You’ll get efficient buy signals with precise price targets for maximum performance. Start outperforming now!
How do institutions grade them?
Teledyne Technologies Incorporated Grades
Below is a summary of recent institutional grades for Teledyne Technologies Incorporated:
| Grading Company | Action | New Grade | Date |
|---|---|---|---|
| Barclays | Maintain | Equal Weight | 2026-01-22 |
| Stifel | Maintain | Buy | 2026-01-22 |
| Needham | Maintain | Buy | 2026-01-22 |
| Citigroup | Maintain | Neutral | 2026-01-13 |
| Barclays | Maintain | Equal Weight | 2026-01-12 |
| Barclays | Maintain | Equal Weight | 2025-10-23 |
| Needham | Maintain | Buy | 2025-10-23 |
| Stifel | Maintain | Buy | 2025-10-23 |
| Morgan Stanley | Maintain | Equal Weight | 2025-10-15 |
| UBS | Maintain | Buy | 2025-07-24 |
Trimble Inc. Grades
The following table lists recent institutional grades for Trimble Inc.:
| Grading Company | Action | New Grade | Date |
|---|---|---|---|
| Barclays | Maintain | Overweight | 2026-01-12 |
| Keybanc | Upgrade | Overweight | 2025-12-16 |
| Piper Sandler | Maintain | Overweight | 2025-11-07 |
| JP Morgan | Maintain | Overweight | 2025-09-19 |
| JP Morgan | Maintain | Overweight | 2025-08-07 |
| Oppenheimer | Maintain | Outperform | 2025-08-07 |
| Raymond James | Maintain | Outperform | 2025-08-07 |
| Oppenheimer | Maintain | Outperform | 2025-07-17 |
| JP Morgan | Maintain | Overweight | 2025-07-10 |
| JP Morgan | Maintain | Overweight | 2025-05-14 |
Which company has the best grades?
Trimble Inc. consistently receives higher grades, mainly Overweight and Outperform, compared to Teledyne’s Buy and Equal Weight ratings. This suggests stronger institutional confidence in Trimble’s prospects, which may influence investor sentiment positively.
Risks specific to each company
The following categories identify the critical pressure points and systemic threats facing Teledyne Technologies Incorporated and Trimble Inc. in the 2026 market environment:
1. Market & Competition
Teledyne Technologies Incorporated
- Faces intense competition in industrial and defense sectors with pressure on innovation cycles.
Trimble Inc.
- Operates in diverse tech markets with high beta of 1.576, reflecting elevated competitive risk.
2. Capital Structure & Debt
Teledyne Technologies Incorporated
- Maintains conservative debt-to-equity ratio of 0.24, supporting strong interest coverage at 19.47.
Trimble Inc.
- Slightly higher leverage with debt-to-equity of 0.26 but better interest coverage at 23.12.
3. Stock Volatility
Teledyne Technologies Incorporated
- Beta near 1.0 suggests stock price moves roughly in line with market, implying moderate volatility.
Trimble Inc.
- Beta of 1.576 signals greater stock price swings and higher investor risk exposure.
4. Regulatory & Legal
Teledyne Technologies Incorporated
- Exposure to defense and aerospace regulations may trigger compliance costs and contract risks.
Trimble Inc.
- Faces regulatory scrutiny tied to infrastructure and transportation software solutions.
5. Supply Chain & Operations
Teledyne Technologies Incorporated
- Complexity in manufacturing and integration of advanced electronics raises supply chain disruption risk.
Trimble Inc.
- Relies heavily on software and hardware integration, vulnerable to tech component shortages.
6. ESG & Climate Transition
Teledyne Technologies Incorporated
- Defense sector exposure complicates ESG profile; climate transition costs could pressure margins.
Trimble Inc.
- Growing demand for precision agriculture and transportation tech aligns with climate transition trends.
7. Geopolitical Exposure
Teledyne Technologies Incorporated
- Global footprint in defense and aerospace subjects firm to geopolitical tensions and export controls.
Trimble Inc.
- International operations face risks from geopolitical instability but less defense-related sensitivity.
Which company shows a better risk-adjusted profile?
Teledyne’s principal risk lies in regulatory and geopolitical exposure from defense operations. Trimble’s biggest vulnerability is elevated stock volatility paired with challenging valuation metrics. Despite Trimble’s higher operational risk, its stronger profitability and interest coverage offer a slight edge. However, Teledyne’s lower beta and solid balance sheet suggest a more stable risk-adjusted profile in turbulent markets. Recent data shows Trimble’s beta at 1.576 versus Teledyne’s 1.014, justifying concern over Trimble’s market sensitivity.
Final Verdict: Which stock to choose?
Teledyne Technologies’ superpower lies in its steady cash generation and growing profitability despite a challenging ROIC environment. Its point of vigilance is the modest return on equity, which signals room for efficiency gains. It fits well in an aggressive growth portfolio seeking durable operational strength.
Trimble’s strategic moat is its commanding net margin and return on equity, reflecting strong market positioning and recurring revenue streams. It offers relatively better safety in capital structure but faces declining profitability trends. Trimble suits a GARP investor aiming for quality growth at a reasonable price.
If you prioritize resilient cash flow and improving profitability, Teledyne outshines due to its operational discipline and upward earnings trajectory. However, if you seek high-margin dominance backed by strong equity returns, Trimble offers better stability despite its profitability headwinds. Both stocks command a premium but cater to distinct investor profiles.
Disclaimer: Investment carries a risk of loss of initial capital. The past performance is not a reliable indicator of future results. Be sure to understand risks before making an investment decision.
Go Further
I encourage you to read the complete analyses of Teledyne Technologies Incorporated and Trimble Inc. to enhance your investment decisions: