TE Connectivity Ltd. (TEL) and Trimble Inc. (TRMB) are prominent players in the hardware, equipment, and parts sector, each driving innovation in connectivity and precision technology. TEL excels in connectivity and sensor solutions across diverse industries, while TRMB focuses on advanced positioning and construction technology. Their overlapping markets and distinct innovation paths make them compelling subjects for comparison. In this article, I will help you decide which company offers the most promising investment potential.

Table of contents
Companies Overview
I will begin the comparison between TE Connectivity Ltd. and Trimble Inc. by providing an overview of these two companies and their main differences.
TE Connectivity Ltd. Overview
TE Connectivity Ltd. specializes in manufacturing and selling connectivity and sensor solutions globally across multiple industries, including automotive, aerospace, defense, and communications. Operating through three segments—Transportation, Industrial, and Communications Solutions—the company serves about 140 countries primarily via direct sales and third-party distributors. Based in Schaffhausen, Switzerland, TE Connectivity employs 85,000 people and is a key player in hardware, equipment, and parts.
Trimble Inc. Overview
Trimble Inc. offers technology solutions designed to improve work processes for professionals and field workers worldwide. Its product portfolio spans Buildings and Infrastructure, Geospatial, Resources and Utilities, and Transportation segments, with software and hardware for design, asset management, precision agriculture, and fleet management. Headquartered in Westminster, California, Trimble employs 12,100 people and is recognized for its innovation in hardware and software solutions within the technology sector.
Key similarities and differences
Both companies operate in the hardware, equipment, and parts industry within the technology sector, focusing on innovative solutions for professional and industrial markets. TE Connectivity emphasizes connectivity and sensor components across a broad range of industries with a substantial global footprint, while Trimble focuses on integrated technology systems and software targeting construction, agriculture, and transportation. TE Connectivity is significantly larger by market cap and workforce, reflecting its broader industrial diversification compared to Trimble’s specialized technology offerings.
Income Statement Comparison
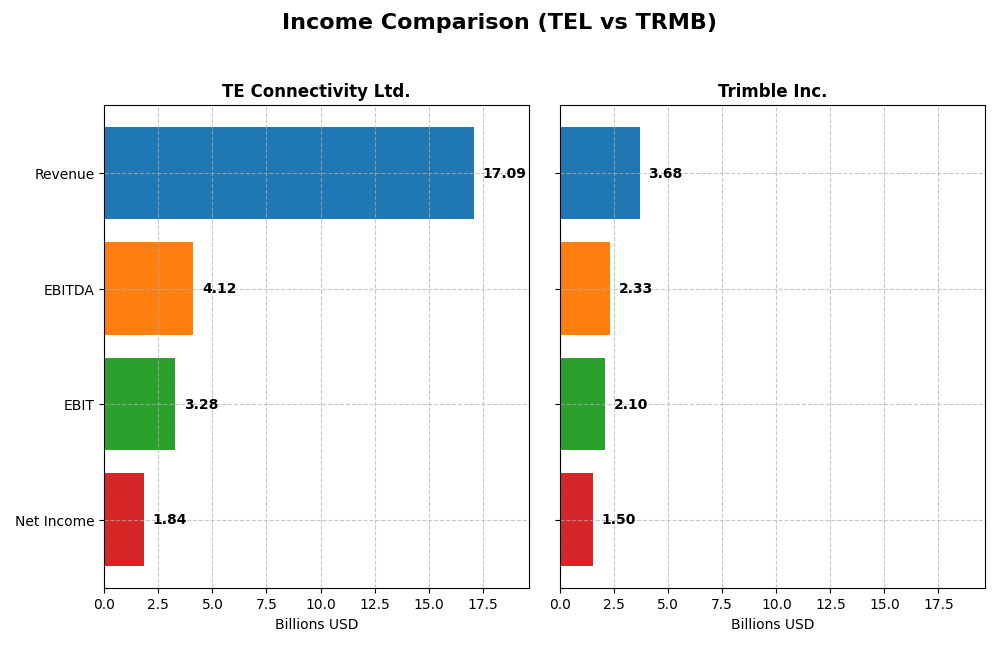
Below is a comparison of the most recent fiscal year income statement metrics for TE Connectivity Ltd. and Trimble Inc., providing insight into their financial performance.
| Metric | TE Connectivity Ltd. | Trimble Inc. |
|---|---|---|
| Market Cap | 69.6B | 19.1B |
| Revenue | 17.1B | 3.7B |
| EBITDA | 4.1B | 2.3B |
| EBIT | 3.3B | 2.1B |
| Net Income | 1.8B | 1.5B |
| EPS | 6.2 | 6.13 |
| Fiscal Year | 2025 | 2024 |
Income Statement Interpretations
TE Connectivity Ltd.
TE Connectivity’s revenue increased moderately by 7.85% in the latest year, with a favorable gross margin of 34.56% and EBIT margin of 19.2%. However, net income declined by 46.51%, reflecting a significant drop in net margin to 10.78%. While gross profit and EBIT grew, operating expenses rose at the same rate as revenue, squeezing bottom-line profitability in 2025.
Trimble Inc.
Trimble saw a slight revenue decline of 3.04% in its latest fiscal year, though gross margin remained high at 65.06%, and EBIT margin improved markedly to 56.92%. Net margin also surged to 40.84%, driving a strong net income growth of 398.4%. Over the period, Trimble exhibited consistent revenue and earnings growth, with improving margins despite recent revenue pressure.
Which one has the stronger fundamentals?
Trimble demonstrates stronger overall fundamentals, with higher and improving margins, robust net income growth, and favorable earnings expansion. TE Connectivity shows solid revenue growth but faces challenges in net income and margin contraction. Both companies have favorable income statement evaluations, yet Trimble’s superior profitability and growth metrics stand out more prominently.
Financial Ratios Comparison
The table below presents a side-by-side comparison of key financial ratios for TE Connectivity Ltd. (TEL) and Trimble Inc. (TRMB) based on their most recent fiscal year data.
| Ratios | TE Connectivity Ltd. (2025) | Trimble Inc. (2024) |
|---|---|---|
| ROE | 14.6% | 26.2% |
| ROIC | 8.9% | 4.5% |
| P/E | 35.0 | 11.5 |
| P/B | 5.12 | 3.02 |
| Current Ratio | 1.56 | 1.27 |
| Quick Ratio | 1.03 | 1.16 |
| D/E (Debt/Equity) | 0.45 | 0.26 |
| Debt-to-Assets | 22.7% | 15.96% |
| Interest Coverage | 41.7 | 5.08 |
| Asset Turnover | 0.68 | 0.39 |
| Fixed Asset Turnover | 3.96 | 11.81 |
| Payout Ratio | 43.6% | 0% |
| Dividend Yield | 1.25% | 0% |
Interpretation of the Ratios
TE Connectivity Ltd.
TE Connectivity shows a balanced profile with 50% favorable ratios, including strong current and quick ratios and low debt levels, supporting sound liquidity and financial stability. However, its high PE and PB ratios indicate potential overvaluation risks. The company maintains a stable dividend yield of 1.25%, reflecting moderate shareholder returns without excessive payout risks.
Trimble Inc.
Trimble presents a favorable overall ratio picture with 57% of metrics positive, highlighted by a strong net margin and return on equity, but concerns arise from its low return on invested capital and high weighted average cost of capital. It does not pay dividends, focusing on growth and reinvestment, which aligns with its high R&D spending and absence of share buybacks.
Which one has the best ratios?
Trimble holds a slight edge with a higher proportion of favorable ratios and stronger profitability measures, despite some weaknesses in capital efficiency and valuation. TE Connectivity offers solid liquidity and lower leverage but faces valuation concerns and more neutral profitability metrics. Each company displays distinct strengths and weaknesses in their financial ratio profiles.
Strategic Positioning
This section compares the strategic positioning of TE Connectivity Ltd. and Trimble Inc., focusing on market position, key segments, and exposure to technological disruption:
TE Connectivity Ltd.
- Large market cap of 69.6B, operates globally with diversified competitive pressures.
- Key segments include Transportation, Industrial, and Communications Solutions driving revenues.
- Exposure to technological disruption through sensor and connectivity innovations in multiple industries.
Trimble Inc.
- Smaller 19.1B market cap, competes in specialized technology segments with strong niche focus.
- Key segments encompass Buildings, Geospatial, Resources, and Transportation technology solutions.
- Faces disruption risks in software and autonomous systems across construction, agriculture, and transportation.
TE Connectivity Ltd. vs Trimble Inc. Positioning
TE Connectivity shows a diversified approach across multiple industrial and communication sectors, while Trimble concentrates on technology solutions for professional and field operations. TE’s broad segment mix offers stability; Trimble’s focused segments target specialized markets with specific growth drivers.
Which has the best competitive advantage?
Both companies exhibit very unfavorable MOAT status with declining ROIC trends and economic value destruction. Neither currently demonstrates a sustainable competitive advantage based on ROIC relative to WACC.
Stock Comparison
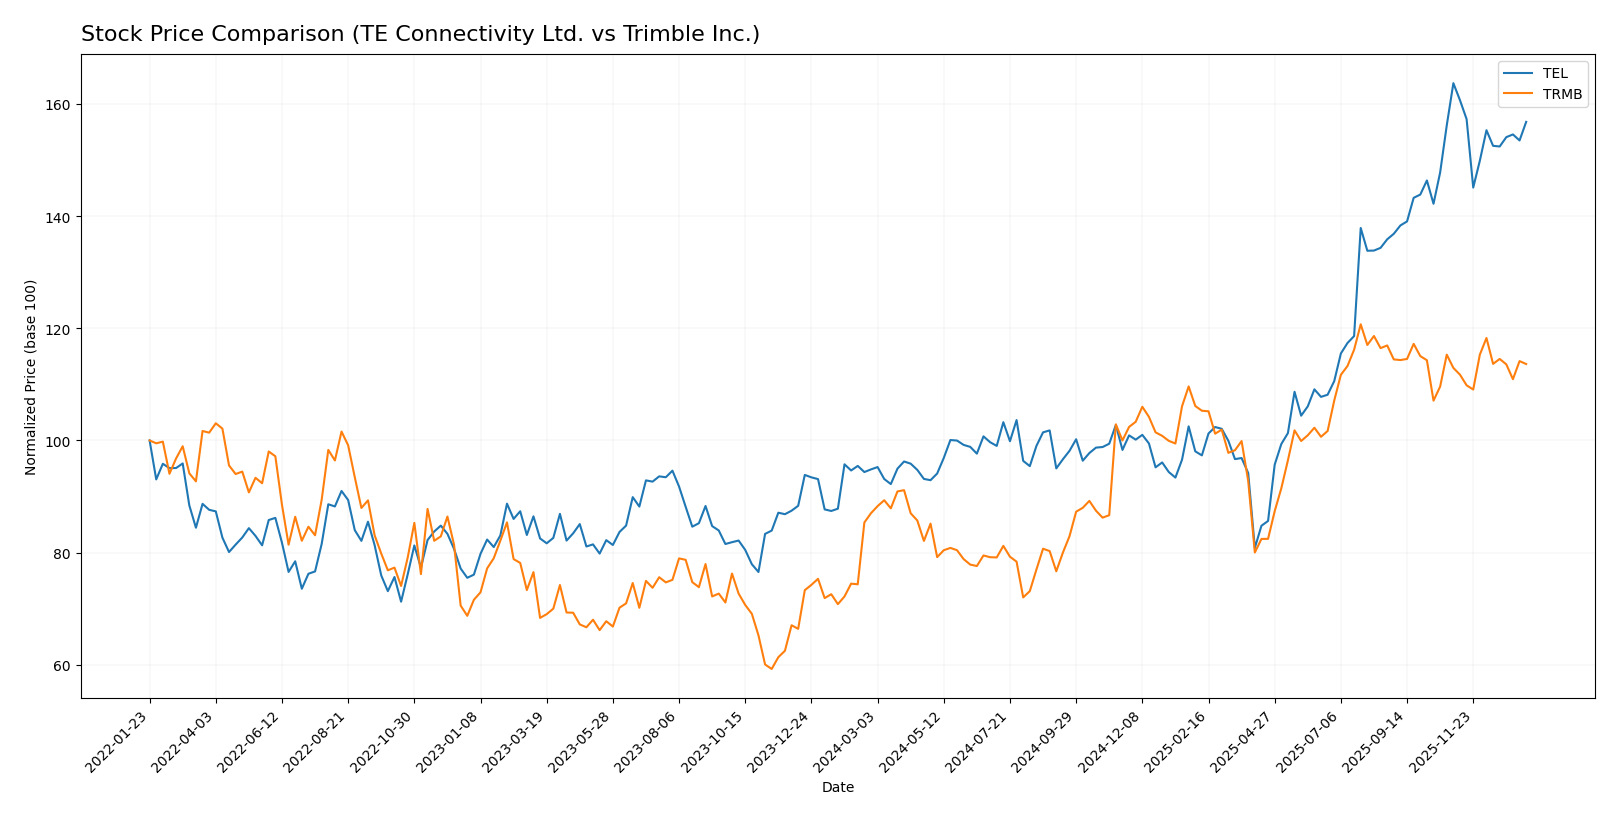
The stock prices of TE Connectivity Ltd. (TEL) and Trimble Inc. (TRMB) showed significant bullish trends over the past 12 months, with TEL demonstrating a more pronounced gain despite recent deceleration and volatility shifts.
Trend Analysis
TE Connectivity Ltd. (TEL) experienced a strong bullish trend over the past year with a 65.33% price increase, accompanied by decelerating momentum and a high volatility level of 33.48%. Recent months show a slight bearish correction of -4.21%.
Trimble Inc. (TRMB) also posted a bullish trend with a 30.56% rise over the same period, marked by deceleration and lower volatility at 9.8%. Its recent trend stabilized with a slight positive change of 0.61%.
Comparing both stocks, TEL delivered the highest market performance over the past year, outperforming TRMB by a wide margin despite recent downward pressure in the last quarter.
Target Prices
The current analyst consensus on target prices reflects moderate upside potential for both TE Connectivity Ltd. and Trimble Inc.
| Company | Target High | Target Low | Consensus |
|---|---|---|---|
| TE Connectivity Ltd. | 297 | 238 | 263.6 |
| Trimble Inc. | 102 | 94 | 98.2 |
Analysts expect TE Connectivity’s stock to rise above its current price of 236.6 USD toward the consensus target of 263.6 USD. Trimble’s target consensus of 98.2 USD similarly suggests upside from its current price of 80.24 USD.
Analyst Opinions Comparison
This section compares analysts’ ratings and grades for TE Connectivity Ltd. and Trimble Inc.:
Rating Comparison
TE Connectivity Ltd. Rating
- Rating: B, classified as Very Favorable by analysts.
- Discounted Cash Flow Score: 3, indicating a moderate value.
- ROE Score: 4, showing favorable efficiency in equity use.
- ROA Score: 4, indicating favorable asset utilization.
- Debt To Equity Score: 2, moderate financial risk.
Trimble Inc. Rating
- Rating: B-, also considered Very Favorable.
- Discounted Cash Flow Score: 3, similarly moderate value.
- ROE Score: 3, moderate efficiency in equity use.
- ROA Score: 3, moderate asset utilization.
- Debt To Equity Score: 2, matching moderate financial risk.
Which one is the best rated?
TE Connectivity Ltd. holds a higher overall score and stronger return on equity and assets scores than Trimble Inc., indicating it is better rated based on the provided metrics.
Scores Comparison
Here is a comparison of the Altman Z-Score and Piotroski Score for both companies:
TEL Scores
- Altman Z-Score: 5.57, indicating a safe zone with low bankruptcy risk.
- Piotroski Score: 6, considered average financial strength.
TRMB Scores
- Altman Z-Score: 4.56, indicating a safe zone with low bankruptcy risk.
- Piotroski Score: 6, considered average financial strength.
Which company has the best scores?
Both TE Connectivity Ltd. and Trimble Inc. have Altman Z-Scores in the safe zone and identical average Piotroski Scores of 6. TE Connectivity shows a slightly higher Altman Z-Score, indicating marginally better financial stability.
Grades Comparison
Here is a comparison of the recent grades assigned to TE Connectivity Ltd. and Trimble Inc. by established grading companies:
TE Connectivity Ltd. Grades
The table below lists recent ratings from notable financial institutions for TE Connectivity Ltd.:
| Grading Company | Action | New Grade | Date |
|---|---|---|---|
| Truist Securities | Maintain | Hold | 2025-12-19 |
| Wells Fargo | Maintain | Equal Weight | 2025-12-09 |
| Barclays | Maintain | Overweight | 2025-11-21 |
| Truist Securities | Maintain | Hold | 2025-11-21 |
| TD Cowen | Maintain | Buy | 2025-11-17 |
| Barclays | Maintain | Overweight | 2025-11-04 |
| Citigroup | Maintain | Buy | 2025-10-30 |
| JP Morgan | Maintain | Neutral | 2025-10-30 |
| UBS | Maintain | Buy | 2025-10-30 |
| Evercore ISI Group | Maintain | Outperform | 2025-10-30 |
The overall trend for TE Connectivity Ltd. shows a balanced mix of Buy, Hold, and Overweight ratings with no recent downgrades, indicating stable analyst confidence.
Trimble Inc. Grades
The table below provides recent grades from recognized financial firms for Trimble Inc.:
| Grading Company | Action | New Grade | Date |
|---|---|---|---|
| Keybanc | Upgrade | Overweight | 2025-12-16 |
| Piper Sandler | Maintain | Overweight | 2025-11-07 |
| JP Morgan | Maintain | Overweight | 2025-09-19 |
| Raymond James | Maintain | Outperform | 2025-08-07 |
| JP Morgan | Maintain | Overweight | 2025-08-07 |
| Oppenheimer | Maintain | Outperform | 2025-08-07 |
| Oppenheimer | Maintain | Outperform | 2025-07-17 |
| JP Morgan | Maintain | Overweight | 2025-07-10 |
| JP Morgan | Maintain | Overweight | 2025-05-14 |
| Piper Sandler | Maintain | Overweight | 2025-05-08 |
Trimble Inc.’s ratings consistently favor an Overweight or Outperform stance, including a recent upgrade, reflecting strong analyst optimism.
Which company has the best grades?
Both TE Connectivity Ltd. and Trimble Inc. carry a “Buy” consensus, but Trimble’s ratings skew more positively with numerous Overweight and Outperform grades versus TE Connectivity’s mixed Hold and Buy ratings. This suggests Trimble currently enjoys higher analyst enthusiasm, potentially affecting investor sentiment toward growth prospects.
Strengths and Weaknesses
Below is a comparison table highlighting the key strengths and weaknesses of TE Connectivity Ltd. (TEL) and Trimble Inc. (TRMB) based on their recent financial and operational data.
| Criterion | TE Connectivity Ltd. (TEL) | Trimble Inc. (TRMB) |
|---|---|---|
| Diversification | Strong product and geographic diversification; multiple segments with Industrial and Transportation Solutions generating significant revenues | Moderate diversification with focus on Product and Service segments; some specialization in engineering and infrastructure markets |
| Profitability | Moderate profitability with net margin around 10.8%; ROIC slightly below WACC indicating value erosion | High net margin over 40%; strong ROE around 26%, but ROIC below WACC signals inefficiency in capital use |
| Innovation | Steady innovation in industrial and transportation tech but facing challenges in maintaining profitability | Strong innovation focus especially in geospatial and infrastructure solutions; high fixed asset turnover indicates efficient asset use |
| Global presence | Extensive global footprint with significant revenues from China, US, Europe, and Asia-Pacific | Global presence mainly through infrastructure and construction sectors, but less geographically diversified than TEL |
| Market Share | Large market share in industrial and transportation components | Leading in niche markets such as geospatial and construction technology |
Key takeaways: TEL offers broad diversification and stable global presence but struggles with declining ROIC and profitability. TRMB demonstrates high profitability and efficient asset use but faces challenges in capital efficiency and less geographic diversification. Both show value destruction risks, requiring careful risk management.
Risk Analysis
Below is a comparative table summarizing key risk metrics for TE Connectivity Ltd. (TEL) and Trimble Inc. (TRMB) based on the most recent data available.
| Metric | TE Connectivity Ltd. (TEL) | Trimble Inc. (TRMB) |
|---|---|---|
| Market Risk | Beta 1.24 (moderate volatility) | Beta 1.59 (higher volatility) |
| Debt level | Debt/Equity 0.45 (favorable) | Debt/Equity 0.26 (favorable) |
| Regulatory Risk | Moderate; operates worldwide with compliance demands | Moderate; US-based with diverse sector exposure |
| Operational Risk | Diverse industrial segments, large workforce (85K) | Complex tech solutions; smaller workforce (12.1K) |
| Environmental Risk | Exposure in energy & transportation; moderate | Exposure in agriculture & infrastructure; moderate |
| Geopolitical Risk | Swiss HQ, global operations; some EMEA exposure | US HQ, global operations; some supply chain sensitivity |
TE Connectivity faces moderate market and geopolitical risks given its global footprint, but maintains a solid financial position with favorable debt levels and liquidity. Trimble shows higher market volatility and operational complexity but benefits from lower leverage. Market fluctuations and geopolitical tensions remain the most impactful risks for both, requiring close monitoring.
Which Stock to Choose?
TE Connectivity Ltd. (TEL) shows a generally favorable income statement with solid gross and EBIT margins, though recent net margin and EPS growth are negative. Its financial ratios are slightly favorable, reflecting strong liquidity and manageable debt. However, its economic moat rating is very unfavorable due to declining ROIC below WACC.
Trimble Inc. (TRMB) demonstrates a highly favorable income statement, with robust net margin and significant growth in net income and EPS over the period. Financial ratios are overall favorable despite some unfavorable metrics like ROIC below WACC and a few valuation ratios. The company’s moat rating is also very unfavorable, indicating value destruction.
For investors prioritizing strong income growth and profitability, Trimble’s profile may appear more attractive due to better net margin expansion and favorable ratios. Conversely, those valuing liquidity and moderate financial stability might find TE Connectivity’s slightly favorable ratios preferable. Both companies exhibit declining ROIC trends, signaling caution in capital efficiency.
Disclaimer: Investment carries a risk of loss of initial capital. The past performance is not a reliable indicator of future results. Be sure to understand risks before making an investment decision.
Go Further
I encourage you to read the complete analyses of TE Connectivity Ltd. and Trimble Inc. to enhance your investment decisions: