Home > Comparison > Technology > TEL vs TDY
The strategic rivalry between TE Connectivity Ltd. and Teledyne Technologies Incorporated shapes the hardware, equipment & parts industry’s future. TE Connectivity operates as a global connectivity and sensor manufacturing powerhouse, while Teledyne specializes in advanced instrumentation, digital imaging, aerospace, and defense electronics. This analysis pits TE’s broad industrial footprint against Teledyne’s high-tech innovation race. I will determine which company presents the superior risk-adjusted opportunity for a diversified portfolio in 2026.

Table of contents
Companies Overview
TE Connectivity and Teledyne Technologies both stand as influential players in the hardware and equipment sector, shaping technology infrastructure globally.
TE Connectivity Ltd.: Global Leader in Connectivity Solutions
TE Connectivity dominates the connectivity and sensor solutions market with products spanning transportation, industrial, and communications sectors. Its revenue primarily derives from delivering terminals, connectors, sensors, and related components worldwide. In 2026, the company focuses strategically on expanding its industrial and transportation solutions to capture growth in automotive electrification and smart infrastructure.
Teledyne Technologies Incorporated: Enabler of Industrial and Aerospace Innovation
Teledyne Technologies excels in enabling technologies across instrumentation, digital imaging, aerospace, and engineered systems. It generates revenue through sophisticated monitoring instruments, imaging sensors, defense electronics, and energy systems. The firm’s 2026 strategy emphasizes innovation in aerospace electronics and integrated systems to reinforce its footprint in defense and scientific markets.
Strategic Collision: Similarities & Divergences
Both companies operate in technology hardware but diverge sharply in approach—TE Connectivity builds broad-based connectivity platforms, while Teledyne pursues niche innovation in aerospace and instrumentation. They clash primarily in industrial applications but target distinct customer needs. TE Connectivity offers scale and global reach, whereas Teledyne provides specialized, high-tech solutions, framing unique risk-return profiles for investors.
Income Statement Comparison
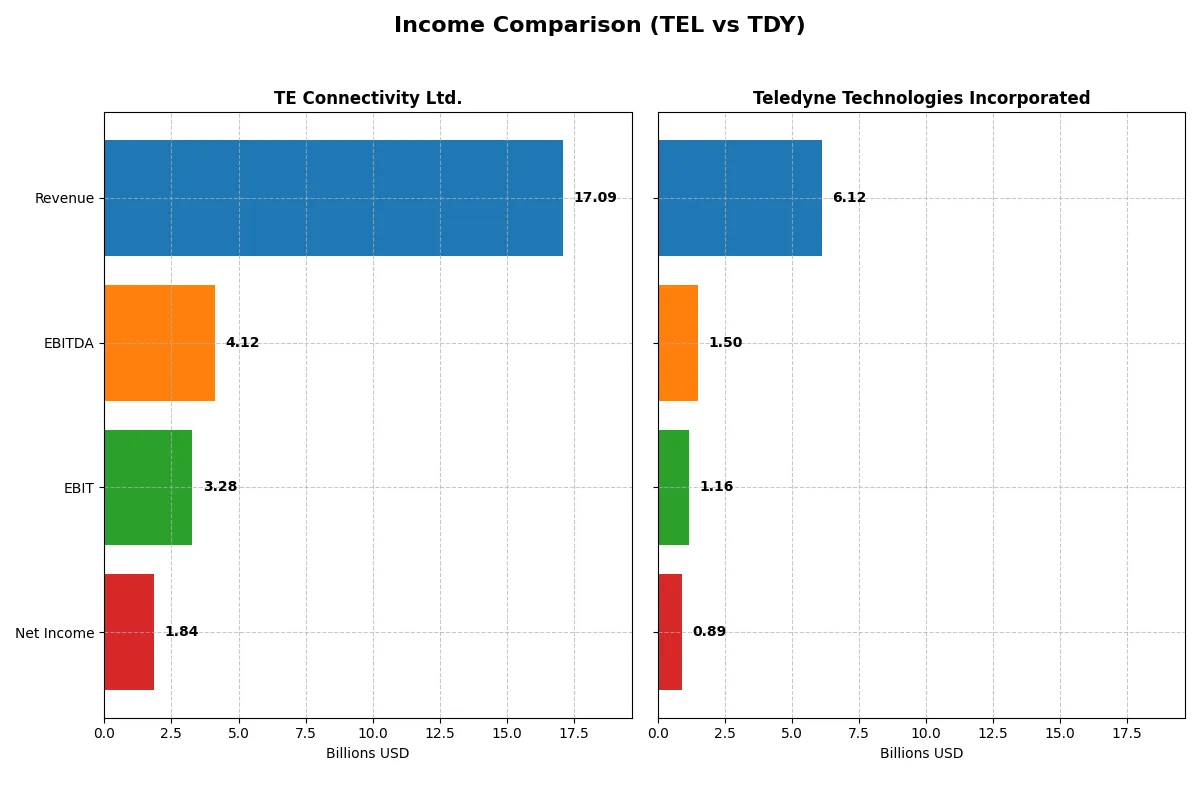
This data dissects the core profitability and scalability of both corporate engines to reveal who dominates the bottom line:
| Metric | TE Connectivity Ltd. (TEL) | Teledyne Technologies Inc. (TDY) |
|---|---|---|
| Revenue | 17B | 6.1B |
| Cost of Revenue | 11.2B | 3.7B |
| Operating Expenses | 2.7B | 1.2B |
| Gross Profit | 5.9B | 2.4B |
| EBITDA | 4.1B | 1.5B |
| EBIT | 3.3B | 1.2B |
| Interest Expense | 77M | 60M |
| Net Income | 1.8B | 895M |
| EPS | 6.2 | 18.88 |
| Fiscal Year | 2025 | 2025 |
Income Statement Analysis: The Bottom-Line Duel
This income statement comparison reveals which company operates with stronger efficiency and delivers superior profitability in their respective markets.
TE Connectivity Ltd. Analysis
TE Connectivity’s revenue grew modestly to $17.1B in 2025, up 7.9% year-over-year, yet net income declined sharply to $1.84B. The company sustains a healthy gross margin of 34.6% and an EBIT margin near 19.2%, reflecting solid operational control. However, net margin and EPS fell significantly, indicating headwinds impacting bottom-line profitability despite steady top-line momentum.
Teledyne Technologies Incorporated Analysis
Teledyne posted $6.1B revenue in 2025, increasing 7.9% from 2024, while net income rose to $895M, showing consistent profit growth. The firm boasts a stronger gross margin at 39.2% and a net margin of 14.6%, both above TE Connectivity’s metrics. Teledyne’s EPS rose nearly 10%, underscoring improving efficiency and sustained earnings momentum.
Margin Strength vs. Earnings Momentum
Teledyne outperforms TE Connectivity on key profitability metrics and delivers robust net income growth. TE Connectivity, while larger in scale, faces declining net margins and EPS, signaling pressure on profitability. For investors prioritizing earnings growth and margin expansion, Teledyne’s profile appears more attractive and fundamentally stronger.
Financial Ratios Comparison
These vital ratios act as a diagnostic tool to expose the underlying fiscal health, valuation premiums, and capital efficiency of the companies compared below:
| Ratios | TE Connectivity Ltd. (TEL) | Teledyne Technologies Inc. (TDY) |
|---|---|---|
| ROE | 14.64% | 8.51% |
| ROIC | 8.82% | 6.78% |
| P/E | 35.0 | 27.3 |
| P/B | 5.12 | 2.33 |
| Current Ratio | 1.56 | 1.64 |
| Quick Ratio | 1.03 | 1.08 |
| D/E (Debt/Equity) | 0.52 | 0.24 |
| Debt-to-Assets | 26.1% | 16.2% |
| Interest Coverage | 41.7 | 19.3 |
| Asset Turnover | 0.68 | 0.40 |
| Fixed Asset Turnover | 3.96 | 7.29 |
| Payout Ratio | 43.6% | 0% |
| Dividend Yield | 1.25% | 0% |
| Fiscal Year | 2025 | 2025 |
Efficiency & Valuation Duel: The Vital Signs
Ratios serve as a company’s financial DNA, exposing hidden risks and operational strengths that raw numbers alone cannot reveal.
TE Connectivity Ltd.
TE Connectivity posts a moderate ROE of 14.6%, reflecting decent profitability, while its net margin at 10.8% signals solid operational efficiency. The stock trades at a high P/E of 35.0, indicating a stretched valuation. Shareholders receive a modest 1.25% dividend yield, suggesting a balanced approach between income and reinvestment in R&D.
Teledyne Technologies Incorporated
Teledyne shows a robust net margin of 14.6% but a weaker ROE of 8.5%, indicating less effective equity use. Its P/E ratio of 27.35 is lower than TE’s but still on the expensive side. The company pays no dividend, likely prioritizing growth through reinvestment, supported by a favorable debt-to-equity ratio of 0.24.
Premium Valuation vs. Operational Safety
TE Connectivity’s higher ROE and dividend yield come at a premium valuation, while Teledyne offers stronger margins but weaker equity returns and no dividend. TE fits investors seeking income and balanced efficiency, whereas Teledyne appeals to those favoring growth and lower leverage.
Which one offers the Superior Shareholder Reward?
I compare TE Connectivity Ltd. (TEL) and Teledyne Technologies Incorporated (TDY) on dividends, payout ratios, and buyback intensity. TEL yields 1.25%-1.86% with a payout ratio near 44%, showing moderate dividend coverage from free cash flow (FCF). TEL also executes buybacks, enhancing total returns sustainably. TDY pays no dividends but reinvests aggressively, with a high FCF retention supporting growth and acquisitions. TDY’s buybacks are less visible but consistent with capital allocation to long-term value. TEL’s mixed model balances income and capital gains, appealing in volatile markets. TDY’s reinvestment strategy suits growth-focused investors but carries higher execution risk. For 2026 total return, I favor TEL’s shareholder-friendly distribution and buyback blend for more consistent rewards and risk mitigation.
Comparative Score Analysis: The Strategic Profile
The radar chart reveals the fundamental DNA and trade-offs of TE Connectivity Ltd. and Teledyne Technologies Incorporated:
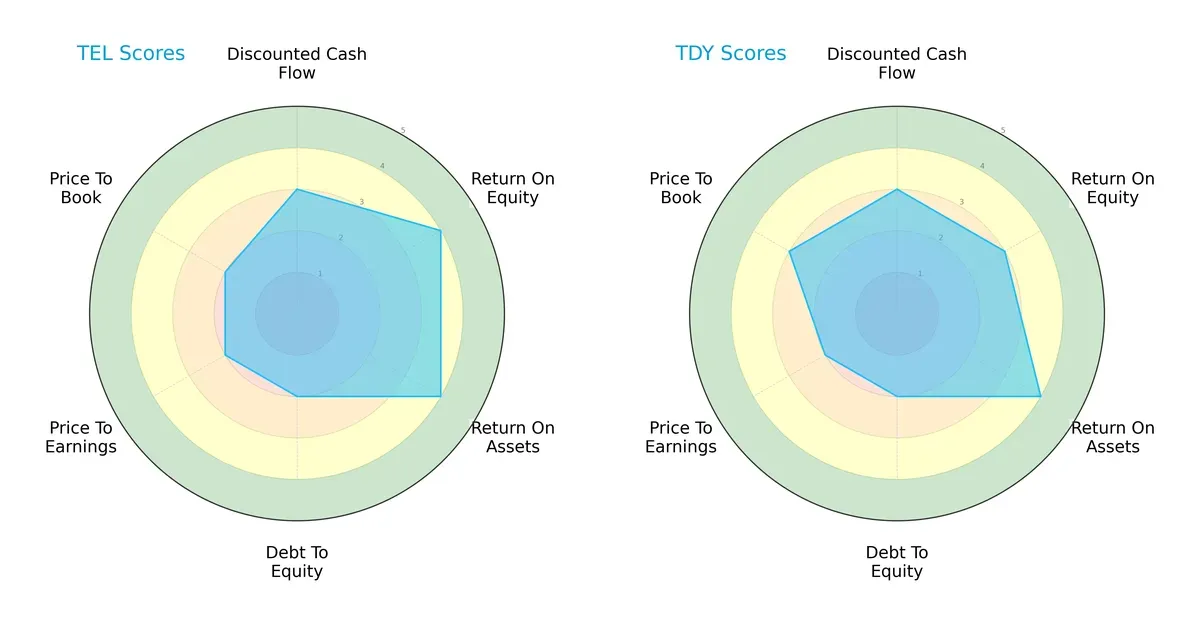
TE Connectivity shows strength in Return on Equity (4) and Return on Assets (4), indicating efficient profit generation and asset use. Teledyne matches TE Connectivity’s asset efficiency (4) but lags slightly in ROE (3). Both have moderate scores in DCF (3) and Debt/Equity (2), signaling similar valuation and financial risk profiles. Teledyne edges TE Connectivity in Price-to-Book (3 vs. 2), suggesting a marginally better market valuation balance. Overall, TE Connectivity presents a more balanced operational profile, while Teledyne leans on asset efficiency and valuation.
Bankruptcy Risk: Solvency Showdown
TE Connectivity’s Altman Z-Score of 5.31 versus Teledyne’s 4.52 places both safely above distress thresholds, indicating robust solvency for the current cycle:

Financial Health: Quality of Operations
TE Connectivity’s Piotroski F-Score of 7 surpasses Teledyne’s 6, signaling stronger internal financial health and fewer red flags in operational metrics:

How are the two companies positioned?
This section dissects TEL and TDY’s operational DNA by comparing revenue distribution and internal dynamics—strengths and weaknesses. The goal is to confront their economic moats and identify which model offers the most resilient competitive advantage today.
Revenue Segmentation: The Strategic Mix
This visual comparison dissects how TE Connectivity Ltd. and Teledyne Technologies diversify income streams and reveal their primary sector bets:
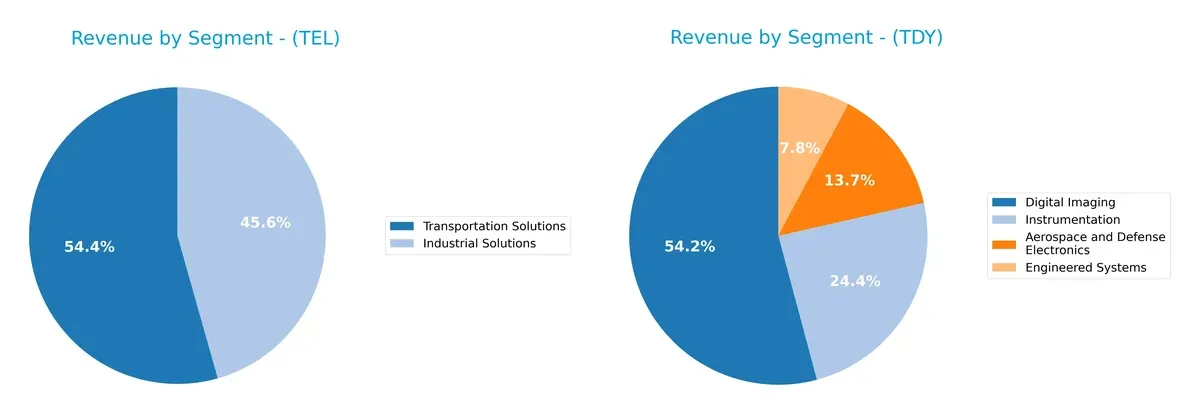
TE Connectivity leans heavily on Transportation Solutions with $9.4B, anchoring its revenue, while Industrial Solutions adds $7.9B, showing moderate diversification. Teledyne pivots around Digital Imaging at $3.1B but balances it with Aerospace and Defense Electronics ($777M), Instrumentation ($1.38B), and Engineered Systems ($440M). TE’s concentration risks contrast with Teledyne’s broader ecosystem, suggesting TE bets on infrastructure dominance and Teledyne on cross-sector innovation.
Strengths and Weaknesses Comparison
This table compares the Strengths and Weaknesses of TE Connectivity Ltd. and Teledyne Technologies Incorporated:
TEL Strengths
- Diversified revenue streams across Industrial and Transportation Solutions
- Favorable net margin of 10.78%
- Strong liquidity with current ratio 1.56 and quick ratio 1.03
- Low debt-to-assets ratio at 26.12% with high interest coverage of 42.61
- Favorable fixed asset turnover at 3.96
- Global presence spanning China, US, Europe, and Asia-Pacific
TDY Strengths
- Highest net margin at 14.63% among peers
- Favorable debt-to-assets ratio at 16.19% and strong interest coverage of 19.47
- Favorable fixed asset turnover at 7.29
- Robust diversification in Aerospace, Digital Imaging, Instrumentation, and Engineered Systems
- Solid liquidity with current ratio 1.64 and quick ratio 1.08
- Significant US market presence with strong revenue in Europe and Asia
TEL Weaknesses
- Unfavorable valuation metrics with PE at 35.0 and PB at 5.12
- Neutral ROIC at 8.82% below WACC of 9.07% indicating limited capital efficiency
- Neutral ROE at 14.64% suggests moderate profitability on equity
- Asset turnover neutral at 0.68 may indicate room for operational efficiency improvement
- Dividend yield moderate at 1.25%
TDY Weaknesses
- Unfavorable ROE at 8.51% indicating weak return on equity
- Unfavorable PE at 27.35 and zero dividend yield
- Asset turnover low at 0.40, signaling less efficient use of assets
- Higher proportion of unfavorable ratios at 28.57% than TEL
- Less diversified global footprint, more concentrated in US and Europe
Both companies show slightly favorable financial health with distinct strengths in profitability and asset utilization. TEL’s broader geographical diversification contrasts with TDY’s stronger margin profile but concentrated market presence, highlighting different strategic focuses.
The Moat Duel: Analyzing Competitive Defensibility
A structural moat is the only true shield against competition eroding long-term profits. Let’s dissect how TE Connectivity and Teledyne Technologies defend their turf:
TE Connectivity Ltd.: Intangible Assets Powerhouse
TE Connectivity relies on proprietary connectivity and sensor technologies, reflected in stable gross margins around 34.5%. However, its declining ROIC signals weakening profitability, risking moat erosion by 2026 unless innovation accelerates.
Teledyne Technologies Incorporated: Innovation-Driven Growth Engine
Teledyne’s moat stems from diversified instrumentation and imaging technologies, supporting higher gross margins near 39%. Despite current value shedding, its rising ROIC trend and expanding aerospace segment point to deepening moat strength in 2026.
Innovation Momentum vs. Legacy Asset Strength
Teledyne’s growing ROIC and diversified tech portfolio offer a deeper moat than TE Connectivity’s faltering profitability and shrinking value creation. I see Teledyne better positioned to defend and expand its market share.
Which stock offers better returns?
The past year shows TE Connectivity Ltd. and Teledyne Technologies Incorporated with strong price gains. TE Connectivity’s growth decelerates while Teledyne accelerates, reflecting differing momentum and trading dynamics.

Trend Comparison
TE Connectivity Ltd. exhibits a bullish trend over 12 months with a 55.07% gain. The uptrend decelerates, marked by high volatility and a peak price of 247.01.
Teledyne Technologies shows a bullish trend with a 51.7% rise over the past year. Its acceleration intensifies, despite greater volatility and a peak near 630.
Teledyne’s recent strong acceleration and 27.25% gain surpass TE Connectivity’s slight recent decline, indicating superior short-term market performance for Teledyne.
Target Prices
Analysts present a bullish consensus on TE Connectivity Ltd. and Teledyne Technologies Incorporated, signaling potential upside from current prices.
| Company | Target Low | Target High | Consensus |
|---|---|---|---|
| TE Connectivity Ltd. | 238 | 306 | 270.29 |
| Teledyne Technologies Incorporated | 599 | 720 | 638.5 |
Both stocks trade below their consensus targets, suggesting expected appreciation. TE Connectivity’s target implies roughly 25% upside, while Teledyne forecasts a modest 1.4% gain, reflecting different growth perceptions.

Don’t Let Luck Decide Your Entry Point
Optimize your entry points with our advanced ProRealTime indicators. You’ll get efficient buy signals with precise price targets for maximum performance. Start outperforming now!
How do institutions grade them?
TE Connectivity Ltd. Grades
The following table summarizes recent grades assigned to TE Connectivity Ltd.:
| Grading Company | Action | New Grade | Date |
|---|---|---|---|
| Oppenheimer | Upgrade | Outperform | 2026-01-27 |
| Barclays | Maintain | Overweight | 2026-01-23 |
| Wells Fargo | Maintain | Equal Weight | 2026-01-22 |
| Truist Securities | Maintain | Hold | 2026-01-22 |
| UBS | Maintain | Buy | 2026-01-14 |
| Truist Securities | Maintain | Hold | 2025-12-19 |
| Wells Fargo | Maintain | Equal Weight | 2025-12-09 |
| Barclays | Maintain | Overweight | 2025-11-21 |
| Truist Securities | Maintain | Hold | 2025-11-21 |
| TD Cowen | Maintain | Buy | 2025-11-17 |
Teledyne Technologies Incorporated Grades
The following table summarizes recent grades assigned to Teledyne Technologies Incorporated:
| Grading Company | Action | New Grade | Date |
|---|---|---|---|
| Barclays | Maintain | Equal Weight | 2026-01-22 |
| Stifel | Maintain | Buy | 2026-01-22 |
| Needham | Maintain | Buy | 2026-01-22 |
| Citigroup | Maintain | Neutral | 2026-01-13 |
| Barclays | Maintain | Equal Weight | 2026-01-12 |
| Barclays | Maintain | Equal Weight | 2025-10-23 |
| Needham | Maintain | Buy | 2025-10-23 |
| Stifel | Maintain | Buy | 2025-10-23 |
| Morgan Stanley | Maintain | Equal Weight | 2025-10-15 |
| UBS | Maintain | Buy | 2025-07-24 |
Which company has the best grades?
TE Connectivity Ltd. shows a broader mix of Buy and Outperform ratings, including a recent upgrade by Oppenheimer. Teledyne Technologies has consistent Buy and Equal Weight ratings but lacks upgrades. Investors may view TE Connectivity’s upgrade as a sign of stronger near-term confidence.
Risks specific to each company
The following categories identify critical pressure points and systemic threats facing TE Connectivity Ltd. and Teledyne Technologies Incorporated in the 2026 market environment:
1. Market & Competition
TE Connectivity Ltd.
- Faces intense competition in connectivity and sensor solutions globally. Market saturation pressures margins.
Teledyne Technologies Incorporated
- Operates in specialized industrial and defense tech markets with moderate competition but high innovation demands.
2. Capital Structure & Debt
TE Connectivity Ltd.
- Maintains moderate leverage with a debt-to-assets ratio of 26.1%, interest coverage strong at 42.6x.
Teledyne Technologies Incorporated
- Lower leverage at 16.2%, interest coverage solid at 19.5x, indicating conservative financial risk.
3. Stock Volatility
TE Connectivity Ltd.
- Higher beta at 1.24 signals greater stock price sensitivity to market swings.
Teledyne Technologies Incorporated
- Beta near 1.01 suggests stock price moves closely with market, lower volatility risk.
4. Regulatory & Legal
TE Connectivity Ltd.
- Global operations expose it to diverse regulatory regimes, increasing compliance complexity.
Teledyne Technologies Incorporated
- Heavy exposure to defense contracts heightens legal and compliance scrutiny risks.
5. Supply Chain & Operations
TE Connectivity Ltd.
- Broad global footprint risks disruptions; relies on third-party distributors which introduces dependency risks.
Teledyne Technologies Incorporated
- More concentrated operations but complex manufacturing for defense and industrial applications pose operational risks.
6. ESG & Climate Transition
TE Connectivity Ltd.
- Faces pressure to reduce carbon footprint in energy-intensive industrial segments.
Teledyne Technologies Incorporated
- Increasing focus on sustainable tech in aerospace and defense could require costly innovation investments.
7. Geopolitical Exposure
TE Connectivity Ltd.
- Swiss base with global market exposure; vulnerable to international trade tensions and currency fluctuations.
Teledyne Technologies Incorporated
- U.S.-based with significant defense sector exposure, sensitive to U.S. government spending and geopolitical shifts.
Which company shows a better risk-adjusted profile?
TE Connectivity’s primary risk centers on market competition and global operational complexity, which pressure margins and supply chains. Teledyne’s biggest risk lies in heavy reliance on defense contracts amid geopolitical uncertainties. Despite higher leverage, TE Connectivity’s stronger interest coverage and Altman Z-score (5.3 vs. 4.5) suggest a marginally better risk-adjusted profile. Teledyne’s lower volatility is positive but offset by concentrated sector risks and a weaker Piotroski score (6 vs. 7). The recent widening beta gap confirms TE’s heightened market sensitivity, warranting caution but reflecting its diversified business model.
Final Verdict: Which stock to choose?
TE Connectivity Ltd. (TEL) excels as a cash-generating machine with a robust balance sheet and stable operational efficiency. Its point of vigilance lies in a declining return on invested capital, signaling potential value destruction. TEL suits investors seeking aggressive growth with moderate risk tolerance.
Teledyne Technologies Incorporated (TDY) boasts a strategic moat through its accelerating profitability and strong intangible asset base, underpinning future innovation. It offers better financial stability than TEL, albeit with a slightly weaker return on equity. TDY fits well within a GARP portfolio emphasizing steady growth at a reasonable valuation.
If you prioritize aggressive growth and operational resilience, TEL is the compelling choice due to its efficient cash conversion and solid income metrics. However, if you seek growth combined with improving profitability and a stronger safety profile, TDY offers better stability and a more dynamic upward trend. Both present analytical scenarios worth considering depending on your risk appetite and investment horizon.
Disclaimer: Investment carries a risk of loss of initial capital. The past performance is not a reliable indicator of future results. Be sure to understand risks before making an investment decision.
Go Further
I encourage you to read the complete analyses of TE Connectivity Ltd. and Teledyne Technologies Incorporated to enhance your investment decisions: