Walmart Inc. and Target Corporation are two giants in the U.S. discount retail sector, each shaping consumer habits with expansive store networks and evolving e-commerce strategies. Both compete fiercely in general merchandise and grocery markets, leveraging innovation to enhance customer experience and operational efficiency. This comparison explores their strengths, risks, and growth potential to help you decide which stock might be the smarter addition to your investment portfolio.

Table of contents
Companies Overview
I will begin the comparison between Walmart Inc. and Target Corporation by providing an overview of these two companies and their main differences.
Walmart Overview
Walmart Inc. operates globally in retail, wholesale, and eCommerce through segments including Walmart U.S., Walmart International, and Sam’s Club. It manages supercenters, warehouse clubs, and discount stores offering a wide range of products from groceries to electronics. Walmart also provides financial services and digital payment platforms, positioning itself as a comprehensive consumer goods and services provider with a market cap of approximately 940B USD.
Target Overview
Target Corporation is a U.S.-based general merchandise retailer focused on food assortments, apparel, home décor, electronics, and beauty products. It operates around 2,000 stores and digital channels, offering in-store amenities like cafés and optical services. With a market cap near 48B USD, Target emphasizes a curated shopping experience combining physical locations and eCommerce, employing 440K people primarily in the United States.
Key similarities and differences
Both Walmart and Target are consumer defensive companies operating in the discount store industry, offering groceries and general merchandise through physical and digital platforms. Walmart’s business model is more global and diversified, including wholesale and financial services, while Target concentrates on U.S. retail with an emphasis on curated product assortments and in-store experiences. Walmart’s scale and market cap significantly exceed Target’s, reflecting its broader market reach and product range.
Income Statement Comparison
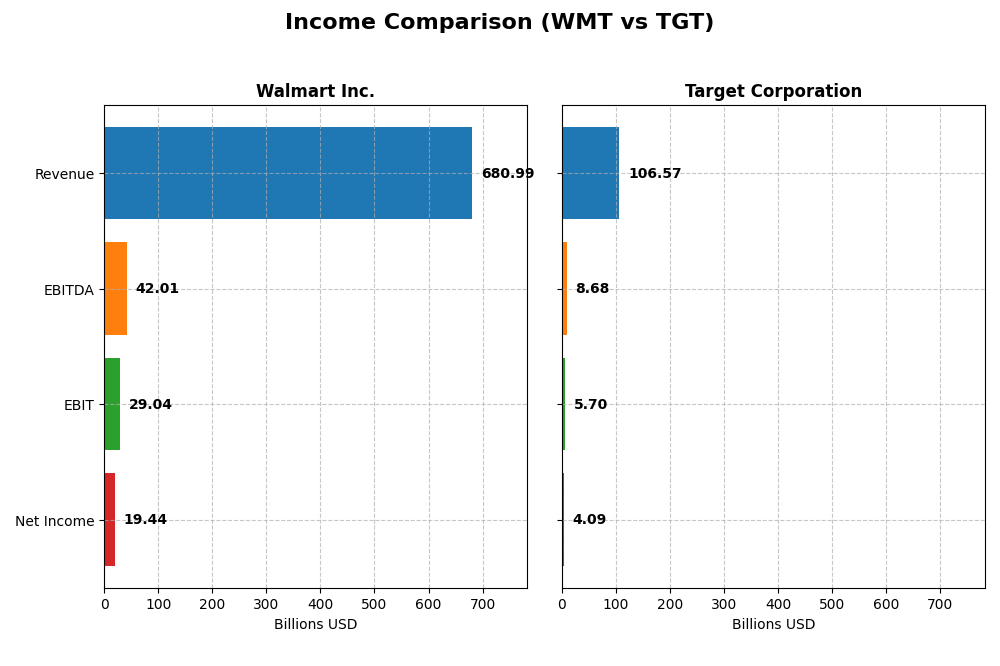
This table presents a side-by-side comparison of key income statement metrics for Walmart Inc. and Target Corporation for the most recent fiscal year available.
| Metric | Walmart Inc. (WMT) | Target Corporation (TGT) |
|---|---|---|
| Market Cap | 940.6B | 48.2B |
| Revenue | 681.0B | 106.6B |
| EBITDA | 42.0B | 8.7B |
| EBIT | 29.0B | 5.7B |
| Net Income | 19.4B | 4.1B |
| EPS | 2.42 | 8.89 |
| Fiscal Year | 2025 | 2024 |
Income Statement Interpretations
Walmart Inc.
Walmart’s revenue and net income steadily increased from 2021 to 2025, with revenue growing 21.79% and net income rising 43.86%. Gross margin remained favorable at 24.85%, while net margin was stable around 2.85%. In 2025, revenue growth slowed to 5.07%, but net margin and EPS growth were strong, improving 19.26% and 26.18% respectively, highlighting enhanced profitability.
Target Corporation
Target’s revenue showed modest growth of 13.9% over the 2020-2024 period but net income declined by 6.34%. Gross margin was favorable at 25.84%, yet net margin and EBIT margin were neutral. The latest fiscal year saw a slight revenue decline of 0.79%, accompanied by decreases in EBIT, net margin, and EPS, reflecting challenges in maintaining earnings momentum despite stable gross profits.
Which one has the stronger fundamentals?
Walmart demonstrates stronger fundamentals with overall favorable income statement trends, including solid revenue and net income growth, expanding margins, and robust EPS gains. Conversely, Target faces unfavorable trends with declining net income and margins despite stable gross margins. Walmart’s higher proportion of favorable indicators suggests a more resilient financial performance over the evaluated periods.
Financial Ratios Comparison
The table below presents a side-by-side comparison of key financial ratios for Walmart Inc. and Target Corporation based on their most recent fiscal year data.
| Ratios | Walmart Inc. (WMT) | Target Corporation (TGT) |
|---|---|---|
| ROE | 21.4% | 27.9% |
| ROIC | 13.1% | 11.2% |
| P/E | 40.6 | 15.5 |
| P/B | 8.67 | 4.33 |
| Current Ratio | 0.82 | 0.94 |
| Quick Ratio | 0.24 | 0.32 |
| D/E (Debt-to-Equity) | 0.66 | 1.36 |
| Debt-to-Assets | 23.0% | 34.4% |
| Interest Coverage | 10.8 | 13.7 |
| Asset Turnover | 2.61 | 1.84 |
| Fixed Asset Turnover | 4.87 | 2.90 |
| Payout Ratio | 34.4% | 50.0% |
| Dividend Yield | 0.85% | 3.22% |
Interpretation of the Ratios
Walmart Inc.
Walmart’s financial ratios indicate a mixed performance with strong returns on equity (21.36%) and invested capital (13.06%), but concerns arise from a low current ratio (0.82) and high price-to-book ratio (8.67). The dividend yield is low at 0.85%, reflecting a modest payout. The company maintains dividends with caution, balancing free cash flow coverage and buybacks to avoid unsustainable distributions.
Target Corporation
Target shows robust returns on equity (27.89%) and a favorable dividend yield of 3.22%, supported by effective interest coverage (13.86). However, the debt-to-equity ratio is high at 1.36, which signals increased leverage risk. The company’s dividend payments appear well-covered, aligning with a strategy that balances shareholder returns and operational reinvestment.
Which one has the best ratios?
Both Walmart and Target exhibit slightly favorable overall ratio profiles, though Walmart shows stronger asset efficiency and lower leverage, while Target offers higher dividend yield and return on equity. Walmart’s liquidity ratios raise caution, whereas Target’s higher debt and price-to-book ratio suggest moderate risk. The best choice depends on investor preference for stability versus yield.
Strategic Positioning
This section compares the strategic positioning of Walmart Inc. and Target Corporation, focusing on Market position, Key segments, and Exposure to technological disruption:
Walmart Inc.
- Leading global retailer with large market cap, facing moderate competitive pressure in discount stores sector.
- Diverse segments: Walmart U.S. (462B), International (122B), Sam’s Club (90B), offering broad product and service range.
- Exposure includes eCommerce platforms and digital payment services, integrating technology in retail and financial services.
Target Corporation
- U.S.-focused retailer with smaller market cap, facing higher competitive pressure in discount stores sector.
- Concentrated segments: Apparel, Beauty, Food, Hardlines, Home Furnishings, with strong emphasis on general merchandise.
- Digital sales via Target.com and in-store amenities; technological disruption impact less diversified than Walmart’s.
Walmart Inc. vs Target Corporation Positioning
Walmart demonstrates a diversified global approach across multiple segments, providing resilience and scale advantages. Target focuses on concentrated U.S. general merchandise segments, potentially limiting diversification but enabling specialization. Walmart’s broad service and retail offerings contrast with Target’s narrower scope.
Which has the best competitive advantage?
Walmart holds a very favorable moat with growing ROIC and strong value creation, indicating durable competitive advantage. Target has a slightly favorable moat with value creation but declining ROIC, suggesting less stability in competitive advantage.
Stock Comparison
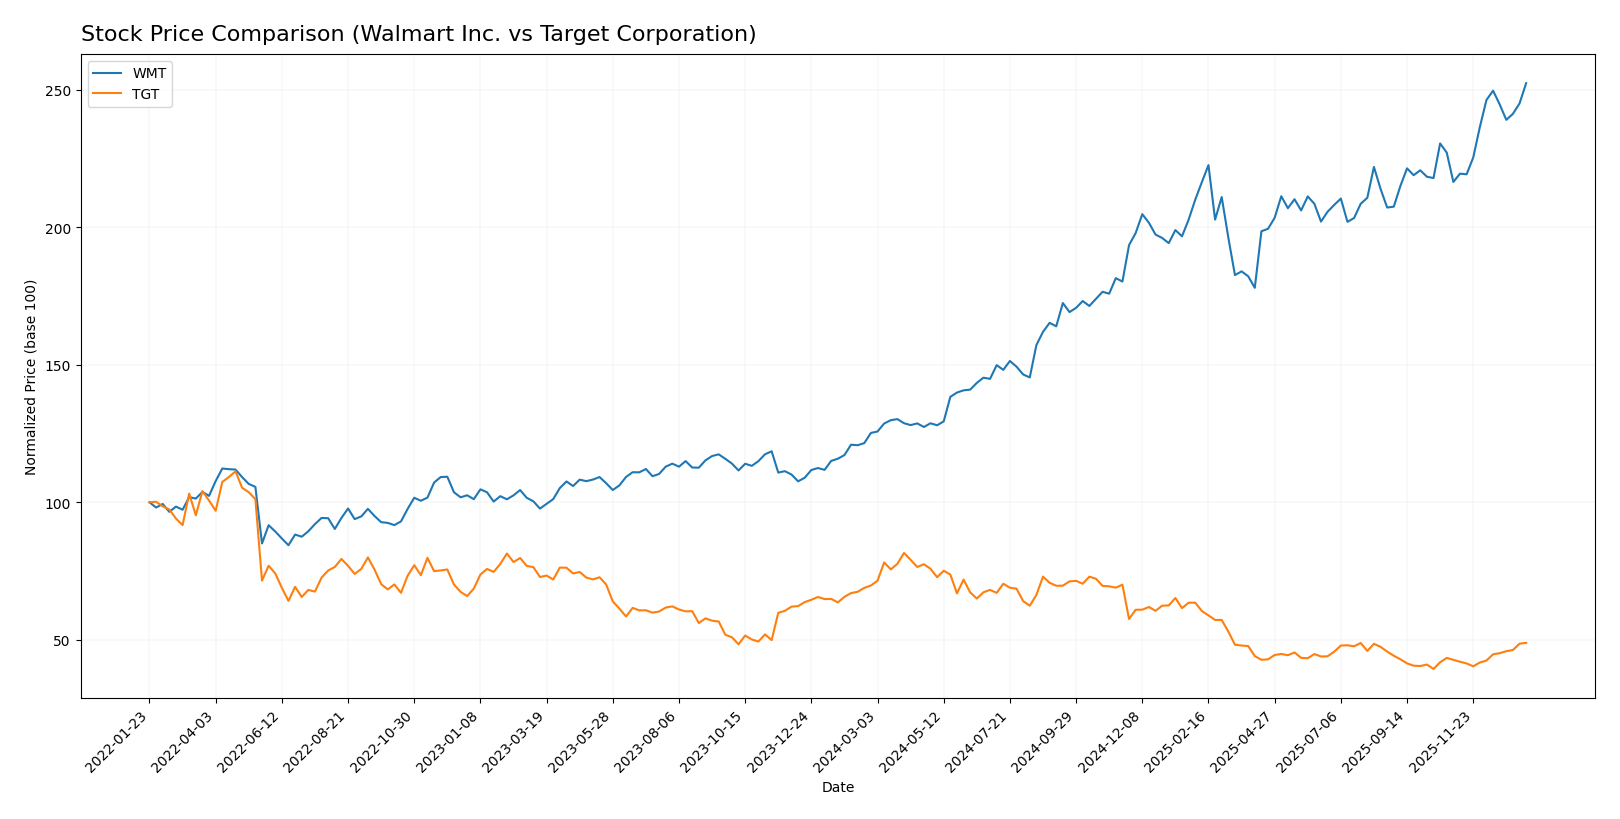
The stock price movements of Walmart Inc. and Target Corporation over the past 12 months reveal contrasting trends, with Walmart showing strong bullish momentum and Target experiencing a bearish trajectory, despite both exhibiting recent positive price changes.
Trend Analysis
Walmart Inc. demonstrated a 101.59% price increase over the past year, indicating a bullish trend with accelerating momentum. The stock ranged between 58.52 and 117.97, showing significant volatility with a standard deviation of 16.45.
Target Corporation’s stock declined by 29.93% over the same period, reflecting a bearish trend with acceleration. The price fluctuated between 85.53 and 177.21, and the standard deviation was notably higher at 27.68, indicating greater volatility.
Comparing both stocks, Walmart delivered the highest market performance with a strong upward trend, while Target’s stock faced a substantial decline despite recent modest gains.
Target Prices
The current analyst consensus presents a cautiously optimistic outlook for Walmart Inc. and Target Corporation.
| Company | Target High | Target Low | Consensus |
|---|---|---|---|
| Walmart Inc. | 135 | 119 | 125.67 |
| Target Corporation | 120 | 80 | 96.14 |
Analysts expect Walmart’s stock to appreciate moderately above its current price of $117.97, while Target’s consensus target suggests a slight downside compared to its present price of $106.15. Overall, the market anticipates steadier performance for Walmart relative to Target.
Analyst Opinions Comparison
This section compares analysts’ ratings and grades for Walmart Inc. and Target Corporation:
Rating Comparison
Walmart Inc. Rating
- Rating: B- indicating a very favorable overall evaluation.
- Discounted Cash Flow Score: Moderate at 2, suggesting cautious valuation outlook.
- ROE Score: Very favorable at 5, showing efficient profit generation from equity.
- ROA Score: Favorable at 4, indicating effective asset utilization.
- Debt To Equity Score: Moderate at 2, reflecting balanced financial risk.
- Overall Score: Moderate at 3, summarizing the company’s financial standing.
Target Corporation Rating
- Rating: B+ indicating a very favorable overall evaluation.
- Discounted Cash Flow Score: Favorable at 4, reflecting better valuation projections.
- ROE Score: Very favorable at 5, also showing strong equity profit efficiency.
- ROA Score: Favorable at 4, indicating effective asset utilization.
- Debt To Equity Score: Very unfavorable at 1, indicating higher financial leverage risk.
- Overall Score: Moderate at 3, summarizing the company’s financial standing.
Which one is the best rated?
Based strictly on the provided data, Target is better rated with a B+ rating and stronger discounted cash flow score. Both have equal overall, ROE, and ROA scores, but Walmart shows lower financial leverage risk.
Scores Comparison
Here is the comparison of Walmart and Target’s financial scores:
WMT Scores
- Altman Z-Score: 6.03, indicating a safe zone with low bankruptcy risk.
- Piotroski Score: 6, categorized as average financial strength.
TGT Scores
- Altman Z-Score: 2.89, placing Target in the grey zone with moderate bankruptcy risk.
- Piotroski Score: 7, considered strong financial strength.
Which company has the best scores?
Walmart shows a stronger Altman Z-Score, indicating better bankruptcy safety, while Target has a higher Piotroski Score, reflecting stronger financial health. Each company excels in one of the two key scores.
Grades Comparison
The following presents the recent grades assigned to Walmart Inc. and Target Corporation by recognized grading companies:
Walmart Inc. Grades
This table summarizes recent grades from reputed financial institutions for Walmart Inc.:
| Grading Company | Action | New Grade | Date |
|---|---|---|---|
| Barclays | Maintain | Overweight | 2026-01-08 |
| Oppenheimer | Maintain | Outperform | 2026-01-08 |
| Mizuho | Maintain | Outperform | 2026-01-05 |
| Bernstein | Maintain | Outperform | 2026-01-05 |
| Wells Fargo | Maintain | Overweight | 2025-12-19 |
| Evercore ISI Group | Maintain | Outperform | 2025-12-16 |
| Evercore ISI Group | Maintain | Outperform | 2025-12-09 |
| Tigress Financial | Maintain | Buy | 2025-12-03 |
| BTIG | Maintain | Buy | 2025-11-21 |
| Morgan Stanley | Maintain | Overweight | 2025-11-21 |
Overall, Walmart’s grades consistently indicate positive outlooks, with most ratings as Outperform, Overweight, or Buy, reflecting confidence from multiple institutions.
Target Corporation Grades
The table below outlines recent grades from recognized financial firms for Target Corporation:
| Grading Company | Action | New Grade | Date |
|---|---|---|---|
| Wolfe Research | Maintain | Underperform | 2025-12-30 |
| Evercore ISI Group | Maintain | In Line | 2025-12-09 |
| Argus Research | Maintain | Buy | 2025-12-01 |
| Bernstein | Maintain | Underperform | 2025-11-20 |
| Evercore ISI Group | Maintain | In Line | 2025-11-20 |
| Roth Capital | Maintain | Neutral | 2025-11-20 |
| B of A Securities | Maintain | Underperform | 2025-11-20 |
| Mizuho | Maintain | Neutral | 2025-11-20 |
| Piper Sandler | Maintain | Neutral | 2025-11-20 |
| Citigroup | Maintain | Neutral | 2025-11-20 |
Target’s grades reflect a mixed to cautious market stance, with several Underperform and Neutral ratings, indicating less confidence compared to Walmart.
Which company has the best grades?
Walmart Inc. has received consistently stronger grades, predominantly Outperform and Overweight, compared to Target Corporation’s mixed ratings including several Underperform and Neutral grades. This suggests Walmart is viewed more favorably by analysts, which may influence investor sentiment and portfolio decisions.
Strengths and Weaknesses
The table below outlines the strengths and weaknesses of Walmart Inc. (WMT) and Target Corporation (TGT) across key investment criteria based on the most recent financial and operational data.
| Criterion | Walmart Inc. (WMT) | Target Corporation (TGT) |
|---|---|---|
| Diversification | Highly diversified with strong revenue streams from Walmart U.S. ($462B), Walmart International ($122B), and Sam’s Club ($90B) in 2025. | Diverse product categories including Apparel, Beauty, Food & Beverage, and Home Furnishings; smaller scale than Walmart but broad product mix. |
| Profitability | ROIC at 13.1% (2025) with growing trend; strong ROE at 21.4%, but net margin low at 2.85%. | ROIC at 11.3% (2024) but declining trend; higher ROE at 27.9%, net margin better at 3.8%. |
| Innovation | Moderate innovation focus; strong asset turnover (2.61) and fixed asset turnover (4.87) indicate operational efficiency. | Innovation reflected in diverse revenue streams including advertising and credit card profit sharing; asset turnover lower at 1.84. |
| Global presence | Significant global footprint with $122B from international operations. | Primarily U.S.-focused with no significant international revenue reported. |
| Market Share | Dominant market share in U.S. retail and substantial presence globally. | Strong U.S. market share in general merchandise but smaller scale than Walmart. |
Walmart demonstrates a durable competitive advantage with a growing ROIC and significant global presence, making it a strong value creator. Target also creates value but faces challenges with declining profitability trends and a more concentrated market focus. Both companies show slightly favorable financial ratios overall, with Walmart excelling in operational efficiency and Target in niche revenue streams.
Risk Analysis
The table below summarizes key risk metrics for Walmart Inc. and Target Corporation based on the most recent data available:
| Metric | Walmart Inc. (WMT) | Target Corporation (TGT) |
|---|---|---|
| Market Risk | Beta 0.66 (lower volatility) | Beta 1.12 (higher volatility) |
| Debt level | Debt-to-Equity 0.66 (neutral) | Debt-to-Equity 1.36 (unfavorable) |
| Regulatory Risk | Moderate, US retail regulations | Moderate, US retail regulations |
| Operational Risk | Low, strong asset turnover | Moderate, lower asset turnover |
| Environmental Risk | Moderate, sustainability efforts ongoing | Moderate, increasing ESG focus |
| Geopolitical Risk | Low, primarily US market | Low, primarily US market |
Walmart’s lower market volatility and stronger debt profile reduce its financial risk compared to Target, which carries higher leverage and market sensitivity. Both face moderate regulatory and environmental risks typical of large retailers. Target’s Altman Z-Score in the grey zone signals moderate financial caution, while Walmart’s safe zone score indicates solid financial health. Investors should weigh Target’s higher growth potential against its elevated risk, while Walmart offers more stability but with valuation concerns.
Which Stock to Choose?
Walmart Inc. (WMT) shows favorable income growth with a 21.79% revenue increase over five years, strong profitability, and a very favorable moat rating due to growing ROIC above WACC. Its financial ratios are slightly favorable, despite some unfavorable valuation multiples.
Target Corporation (TGT) presents mixed income results with a 13.9% revenue growth but overall unfavorable income statement evaluation and a declining ROIC trend. Its financial ratios are slightly favorable, supported by a very favorable rating but challenged by higher debt levels.
For investors prioritizing a durable competitive advantage and consistent profitability, Walmart might appear more favorable, while those focusing on strong equity returns and potential value might find Target more appealing despite its recent challenges.
Disclaimer: Investment carries a risk of loss of initial capital. The past performance is not a reliable indicator of future results. Be sure to understand risks before making an investment decision.
Go Further
I encourage you to read the complete analyses of Walmart Inc. and Target Corporation to enhance your investment decisions: