In the dynamic oil and gas midstream sector, The Williams Companies, Inc. (WMB) and Targa Resources Corp. (TRGP) stand out as key players with significant market presence and complementary operational footprints. Both companies focus on natural gas gathering, processing, and transportation, yet differ in scale and asset specialization. This article will analyze their strategies and financial health to help you decide which stock might best enhance your investment portfolio in 2026.

Table of contents
Companies Overview
I will begin the comparison between The Williams Companies, Inc. and Targa Resources Corp. by providing an overview of these two companies and their main differences.
The Williams Companies, Inc. Overview
The Williams Companies, Inc. is a US-based energy infrastructure company operating primarily in the oil and gas midstream sector. It manages extensive pipeline networks, processing facilities, and storage capacities across various US regions, including the Gulf Coast and the Marcellus Shale. Founded in 1908 and headquartered in Tulsa, Oklahoma, Williams focuses on natural gas transmission, gathering, processing, and marketing services.
Targa Resources Corp. Overview
Targa Resources Corp., headquartered in Houston, Texas, owns and operates a portfolio of midstream energy assets in North America. The company’s operations cover gathering, processing, logistics, and transportation of natural gas, NGLs, and crude oil. Incorporated in 2005, Targa emphasizes diversified midstream services with significant pipeline mileage, processing plants, and storage facilities, serving a broad customer base including LPG exporters and refiners.
Key similarities and differences
Both companies operate in the oil and gas midstream industry, focusing on gathering, processing, and transportation of natural gas and NGLs with extensive pipeline and storage assets. Williams has a longer history and a broader geographic footprint, including significant operations in the Northeast and Gulf of Mexico. Targa, while younger, emphasizes integrated logistics and transportation services and manages a larger number of processing plants and storage wells relative to its size. Their market caps and employee counts also differ, reflecting scale variations.
Income Statement Comparison
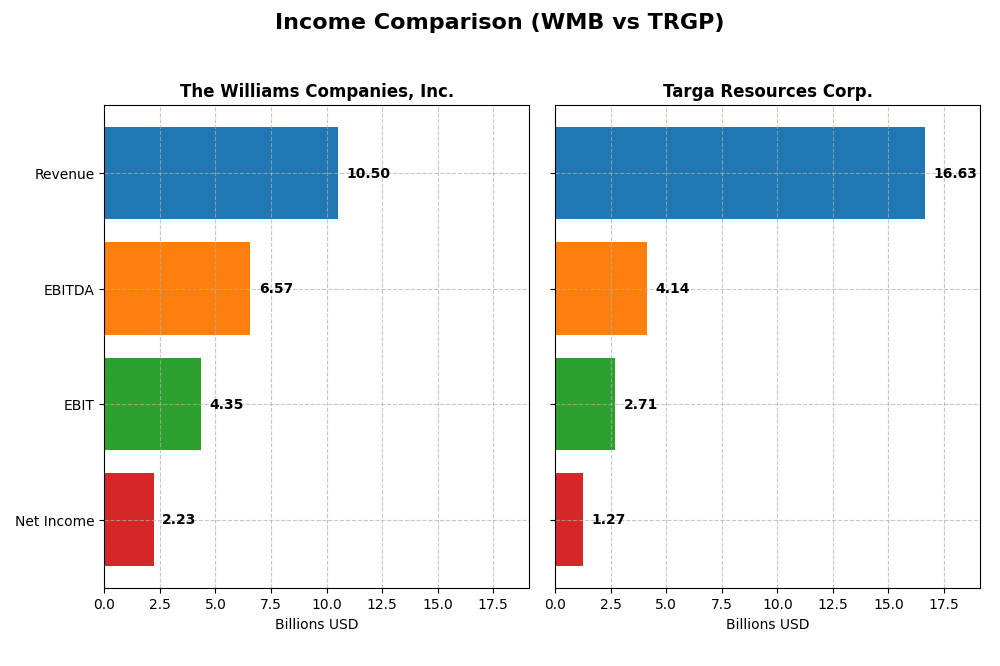
The following table presents a side-by-side comparison of key income statement metrics for The Williams Companies, Inc. (WMB) and Targa Resources Corp. (TRGP) for the fiscal year 2024.
| Metric | The Williams Companies, Inc. (WMB) | Targa Resources Corp. (TRGP) |
|---|---|---|
| Market Cap | 73.7B | 38.0B |
| Revenue | 10.5B | 16.6B |
| EBITDA | 6.57B | 4.14B |
| EBIT | 4.35B | 2.71B |
| Net Income | 2.23B | 1.27B |
| EPS | 1.82 | 5.77 |
| Fiscal Year | 2024 | 2024 |
Income Statement Interpretations
The Williams Companies, Inc.
The Williams Companies, Inc. showed a 36.07% revenue growth and a significant 954.5% net income increase over 2020-2024. Margins remain strong, with a 58.71% gross margin and 21.18% net margin, despite a recent 3.7% revenue decline and 27.32% net margin drop in 2024. The company’s profitability contracted last year, reflecting margin pressures.
Targa Resources Corp.
Targa Resources Corp. doubled its revenue over five years, with a 100.99% growth and a net income increase of 181.7%. Margins are moderate, featuring a 20% gross margin and a 7.64% net margin. In 2024, revenue rose 6.45%, gross profit jumped 31.16%, and net margin improved 43.99%, signaling positive momentum in profitability.
Which one has the stronger fundamentals?
Targa Resources Corp. demonstrates a more favorable income statement profile with consistent revenue and net income growth, improving margins, and lower interest expense ratios. The Williams Companies, Inc. boasts higher margins but faced recent declines in revenue and net income growth, balancing favorable long-term trends with short-term challenges, resulting in a neutral overall evaluation.
Financial Ratios Comparison
The table below compares the most recent financial ratios of The Williams Companies, Inc. (WMB) and Targa Resources Corp. (TRGP) for the fiscal year 2024, providing a clear view of their profitability, liquidity, leverage, and efficiency metrics.
| Ratios | The Williams Companies, Inc. (WMB) | Targa Resources Corp. (TRGP) |
|---|---|---|
| ROE | 17.9% | 48.97% |
| ROIC | 5.10% | 11.83% |
| P/E | 29.65 | 30.96 |
| P/B | 5.31 | 15.16 |
| Current Ratio | 0.50 | 0.72 |
| Quick Ratio | 0.45 | 0.62 |
| D/E | 2.18 | 5.50 |
| Debt-to-Assets | 49.7% | 62.7% |
| Interest Coverage | 2.45 | 3.84 |
| Asset Turnover | 0.19 | 0.73 |
| Fixed Asset Turnover | 0.27 | 0.92 |
| Payout Ratio | 104.1% | 48.5% |
| Dividend Yield | 3.51% | 1.57% |
Interpretation of the Ratios
The Williams Companies, Inc.
Williams shows strong profitability with a favorable net margin of 21.18% and ROE at 17.89%, but faces challenges in liquidity with a current ratio of 0.5 and leverage with a debt-to-equity ratio of 2.18, both unfavorable. The dividend yield is solid at 3.51%, indicating steady shareholder returns supported by dividend payments, but payout sustainability should be monitored.
Targa Resources Corp.
Targa Resources displays favorable returns on equity (48.97%) and invested capital (11.83%), though net margin is moderate at 7.64%. Liquidity ratios remain below 1, and high debt-to-equity (5.5) and debt-to-assets (62.75%) ratios are unfavorable. Dividend yield is lower at 1.57%, reflecting more cautious shareholder distributions with a focus on reinvestment.
Which one has the best ratios?
Both Williams and Targa face similar proportions of unfavorable ratios (50%), yet Williams has a slight edge in profitability metrics and dividend yield. Targa excels in return on invested capital but carries heavier leverage and weaker liquidity. Overall, their ratio profiles are slightly unfavorable, with distinct strengths and risks for investors to consider.
Strategic Positioning
This section compares the strategic positioning of The Williams Companies, Inc. (WMB) and Targa Resources Corp. (TRGP) in terms of market position, key segments, and exposure to technological disruption:
The Williams Companies, Inc. (WMB)
- Market leader in US energy infrastructure with 30,000 pipeline miles; faces moderate competitive pressure.
- Diverse segments: Transmission & Gulf of Mexico, Northeast G&P, West, and Gas & NGL Marketing Services.
- Operates traditional pipeline and processing assets; no explicit exposure to technological disruption stated.
Targa Resources Corp. (TRGP)
- Operates a large North American midstream asset portfolio; competes in gathering, processing, and logistics.
- Two main segments: Gathering and Processing, and Logistics and Transportation.
- Focus on natural gas and NGL logistics with infrastructure assets; no explicit mention of disruption exposure.
WMB vs TRGP Positioning
WMB has a diversified business model across several US regions and segments, offering broad exposure but facing complex operational management. TRGP concentrates on two main segments with focused logistics and processing, potentially offering streamlined operations but less diversification.
Which has the best competitive advantage?
TRGP shows a very favorable MOAT with value creation and growing profitability, indicating a durable competitive advantage. WMB’s MOAT is slightly unfavorable, showing value destruction despite improving profitability trends.
Stock Comparison
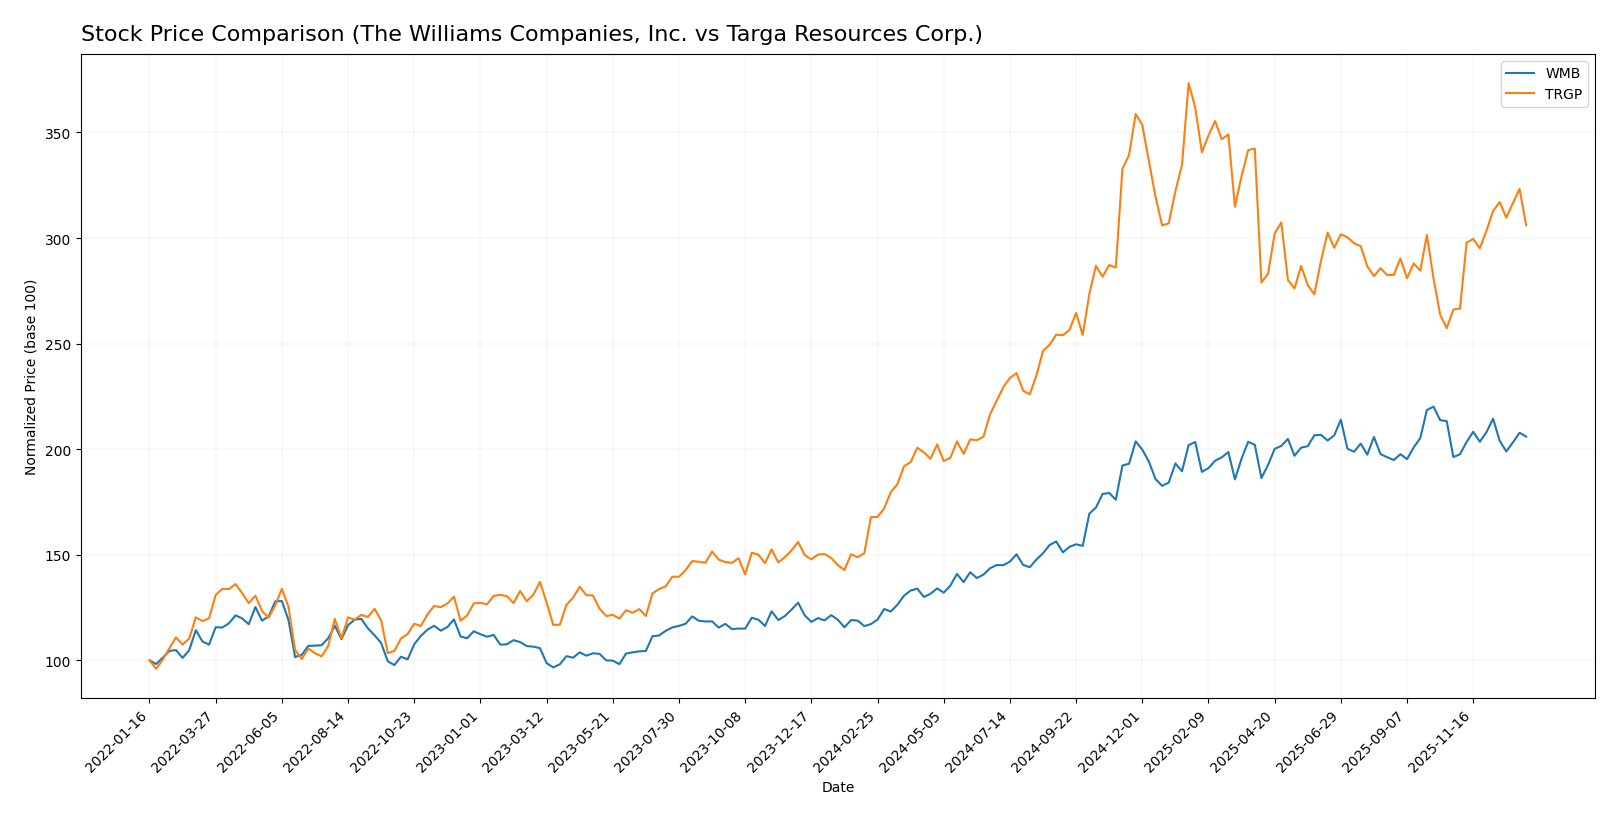
The stock prices of The Williams Companies, Inc. (WMB) and Targa Resources Corp. (TRGP) have shown significant bullish trends over the past 12 months, with TRGP exhibiting stronger acceleration and higher volatility in recent months.
Trend Analysis
The Williams Companies, Inc. (WMB) recorded a 75.81% price increase over the past year, indicating a bullish trend with deceleration and a standard deviation of 8.61. The highest price reached was 64.48, and the lowest was 34.31.
Targa Resources Corp. (TRGP) demonstrated an 82.44% price increase over the same period, also bullish but with acceleration and higher volatility reflected in a 29.4 standard deviation. Its price ranged between 96.94 and 215.72.
Comparing both stocks, TRGP has delivered the highest market performance with an 82.44% increase versus WMB’s 75.81% over the past year.
Target Prices
Analysts present a clear consensus on target prices for The Williams Companies, Inc. and Targa Resources Corp.
| Company | Target High | Target Low | Consensus |
|---|---|---|---|
| The Williams Companies, Inc. | 83 | 66 | 72.86 |
| Targa Resources Corp. | 228 | 199 | 212 |
The consensus targets exceed current prices for both companies, suggesting upside potential. Williams trades around 60.32 USD, while Targa is near 176.86 USD, indicating favorable analyst expectations relative to market prices.
Analyst Opinions Comparison
This section compares analysts’ ratings and financial scores for The Williams Companies, Inc. (WMB) and Targa Resources Corp. (TRGP):
Rating Comparison
WMB Rating
- Rating: B, rated Very Favorable overall.
- Discounted Cash Flow Score: 5, indicating very favorable valuation outlook.
- ROE Score: 5, reflects very efficient profit generation from equity.
- ROA Score: 4, favorable asset utilization effectiveness.
- Debt To Equity Score: 1, very unfavorable, indicating high financial risk.
- Overall Score: 3, moderate across key financial indicators.
TRGP Rating
- Rating: B+, also rated Very Favorable overall.
- Discounted Cash Flow Score: 4, showing a favorable valuation perspective.
- ROE Score: 5, equally very efficient in generating profit from equity.
- ROA Score: 5, very favorable effectiveness in using assets to generate earnings.
- Debt To Equity Score: 1, also very unfavorable, reflecting similar financial risk.
- Overall Score: 3, moderate despite some strong individual metrics.
Which one is the best rated?
TRGP holds a slightly higher rating at B+ compared to WMB’s B. While both share the same overall score and debt-to-equity concerns, TRGP’s stronger ROA and moderately lower discounted cash flow score indicate a marginally better rating profile.
Scores Comparison
Here is a comparison of the Altman Z-Score and Piotroski Score for both companies:
WMB Scores
- Altman Z-Score: 1.18, indicating financial distress.
- Piotroski Score: 6, representing average financial strength.
TRGP Scores
- Altman Z-Score: 2.35, placing it in the moderate risk grey zone.
- Piotroski Score: 7, indicating strong financial health.
Which company has the best scores?
TRGP shows better scores, with a higher Altman Z-Score in the grey zone and a stronger Piotroski Score of 7, compared to WMB’s distress zone and average Piotroski Score of 6.
Grades Comparison
The following tables summarize the recent grades assigned to The Williams Companies, Inc. and Targa Resources Corp. by major grading firms:
The Williams Companies, Inc. Grades
These are the latest grades given by reputable financial institutions for WMB:
| Grading Company | Action | New Grade | Date |
|---|---|---|---|
| Jefferies | Buy | Buy | 2026-01-09 |
| Citigroup | Buy | Buy | 2025-11-13 |
| TD Cowen | Buy | Buy | 2025-11-06 |
| Jefferies | Buy | Buy | 2025-11-05 |
| BMO Capital | Maintain | Outperform | 2025-11-05 |
| Barclays | Maintain | Equal Weight | 2025-10-14 |
| Morgan Stanley | Maintain | Overweight | 2025-10-02 |
| Goldman Sachs | Maintain | Neutral | 2025-10-02 |
| UBS | Buy | Buy | 2025-09-30 |
| Barclays | Maintain | Equal Weight | 2025-09-30 |
Overall, WMB’s grades reflect mostly buy and outperform recommendations, with some equal weight and neutral ratings indicating a generally positive but cautious outlook.
Targa Resources Corp. Grades
These are the latest grades provided by recognized grading companies for TRGP:
| Grading Company | Action | New Grade | Date |
|---|---|---|---|
| Wells Fargo | Maintain | Overweight | 2025-12-18 |
| Scotiabank | Maintain | Sector Outperform | 2025-12-17 |
| RBC Capital | Maintain | Outperform | 2025-12-03 |
| RBC Capital | Maintain | Outperform | 2025-11-18 |
| Scotiabank | Maintain | Sector Outperform | 2025-11-13 |
| Goldman Sachs | Maintain | Buy | 2025-11-13 |
| Morgan Stanley | Maintain | Overweight | 2025-11-12 |
| BMO Capital | Maintain | Outperform | 2025-11-06 |
| JP Morgan | Maintain | Overweight | 2025-10-07 |
| Mizuho | Maintain | Outperform | 2025-08-29 |
TRGP’s grades consistently show overweight, outperform, and sector outperform ratings, indicating strong confidence from analysts across the board.
Which company has the best grades?
Both WMB and TRGP have positive grade consensus with predominantly buy and outperform ratings. However, TRGP’s grades skew more towards overweight and sector outperform, suggesting stronger analyst conviction, which may influence investor sentiment and confidence in growth potential.
Strengths and Weaknesses
Below is a comparison table highlighting key strengths and weaknesses of The Williams Companies, Inc. (WMB) and Targa Resources Corp. (TRGP) based on recent financial and operational data.
| Criterion | The Williams Companies, Inc. (WMB) | Targa Resources Corp. (TRGP) |
|---|---|---|
| Diversification | Moderate segment diversity with Gas & NGL Marketing, Northeast G&P, Transmission and West segments | Focused on Gathering & Processing and Logistics & Transportation, less diversified |
| Profitability | Net margin 21.18% (favorable), ROE 17.89% (favorable), but ROIC below WACC indicating value destruction | Net margin 7.64% (neutral), ROE 48.97% (favorable), ROIC well above WACC indicating value creation |
| Innovation | Limited public data on innovation; steady ROIC growth suggests operational improvements | Strong ROIC growth indicates effective capital use and possible innovation in operations |
| Global presence | Primarily US-focused energy infrastructure | Also US-focused, with strong regional presence in midstream energy |
| Market Share | Large revenues in Gas & NGL Marketing Services ($4.98B) and Transmission ($4.63B) | Large revenues in Logistics & Transportation ($14.03B) and Gathering & Processing ($6.81B) |
Key takeaways: TRGP demonstrates a stronger economic moat with value creation and robust ROIC growth, despite lower net margin. WMB shows favorable profitability ratios but is currently shedding value, signaling caution despite operational improvements. Both companies have a strong US midstream focus but differ in diversification and capital efficiency.
Risk Analysis
Below is a comparison of key risks for The Williams Companies, Inc. (WMB) and Targa Resources Corp. (TRGP) based on the most recent data from 2024.
| Metric | The Williams Companies, Inc. (WMB) | Targa Resources Corp. (TRGP) |
|---|---|---|
| Market Risk | Beta 0.66, moderate volatility | Beta 0.87, higher volatility |
| Debt level | Debt-to-Equity 2.18 (unfavorable) | Debt-to-Equity 5.5 (very high risk) |
| Regulatory Risk | Moderate, US energy regulations | Moderate, US energy regulations |
| Operational Risk | Extensive pipeline network (30K miles), processing assets | Large asset base with 28.4K miles pipeline, 42 plants |
| Environmental Risk | Exposure to pipeline incidents and emissions regulations | Similar exposure, plus NGL and propane logistics |
| Geopolitical Risk | Mainly US-focused, limited global exposure | US-focused, some Gulf Coast logistical dependencies |
The most impactful risks for both companies include their high debt levels, which increase financial vulnerability; TRGP’s debt is notably higher, raising its risk profile. Market risk is moderate for WMB but higher for TRGP due to greater beta. Operational and environmental risks are significant given their extensive midstream infrastructure, with potential regulatory impacts in the evolving energy landscape. Both companies operate primarily in the US, limiting geopolitical risk but concentrating exposure to US policy changes.
Which Stock to Choose?
The Williams Companies, Inc. (WMB) shows a mixed income evolution with favorable margins but recent declines in revenue and net margin growth. Its financial ratios are slightly unfavorable overall, with high debt and low liquidity, though profitability remains decent. The company’s rating is very favorable despite some valuation concerns.
Targa Resources Corp. (TRGP) presents a generally favorable income evolution, including strong growth in revenue and net margin. Its financial ratios are also slightly unfavorable overall, marked by high leverage and moderate liquidity, but it excels in return metrics. TRGP holds a very favorable rating with strong financial scores.
Considering ratings and the overall income and ratio evaluations, TRGP might signal a durable competitive advantage with growing profitability, while WMB appears to be improving profitability but still shedding value. Investors seeking growth could find TRGP more appealing, whereas those valuing established profitability and stability might view WMB differently.
Disclaimer: Investment carries a risk of loss of initial capital. The past performance is not a reliable indicator of future results. Be sure to understand risks before making an investment decision.
Go Further
I encourage you to read the complete analyses of The Williams Companies, Inc. and Targa Resources Corp. to enhance your investment decisions: