In the fast-evolving semiconductor industry, Taiwan Semiconductor Manufacturing Company Limited (TSM) and Tower Semiconductor Ltd. (TSEM) stand out as key players with distinct approaches. Both companies specialize in semiconductor manufacturing but differ in scale, technology focus, and market reach. This comparison explores their innovation strategies and market positions to help you decide which company presents the most compelling investment opportunity in 2026. Let’s dive in to uncover the most promising choice for your portfolio.

Table of contents
Companies Overview
I will begin the comparison between Taiwan Semiconductor Manufacturing Company Limited (TSM) and Tower Semiconductor Ltd. (TSEM) by providing an overview of these two companies and their main differences.
Taiwan Semiconductor Manufacturing Company Limited Overview
TSM is a leading semiconductor manufacturer headquartered in Hsinchu City, Taiwan. Established in 1987, it specializes in manufacturing, packaging, and testing integrated circuits and semiconductor devices for global markets. Its wide range of wafer fabrication processes supports applications in high-performance computing, smartphones, IoT, automotive, and consumer electronics. TSM operates with over 65K employees and has a market capitalization exceeding 1.6T USD.
Tower Semiconductor Ltd. Overview
TSEM is an independent semiconductor foundry based in Migdal Haemek, Israel, founded in 1993. It focuses on analog intensive mixed-signal semiconductor devices and offers customizable process technologies including SiGe, BiCMOS, and RF CMOS. TSEM serves diverse industries such as consumer electronics, automotive, aerospace, and medical devices. The company employs around 5.6K people and has a market cap near 14B USD.
Key similarities and differences
Both TSM and TSEM operate in the semiconductor industry with a focus on wafer fabrication and foundry services catering to diverse high-tech markets. However, TSM is significantly larger in scale and scope, with a broader range of fabrication processes and a global presence. TSEM specializes more narrowly in analog and mixed-signal technologies and serves a somewhat different industrial mix. Their market caps and workforce sizes also reflect this substantial difference in scale.
Income Statement Comparison
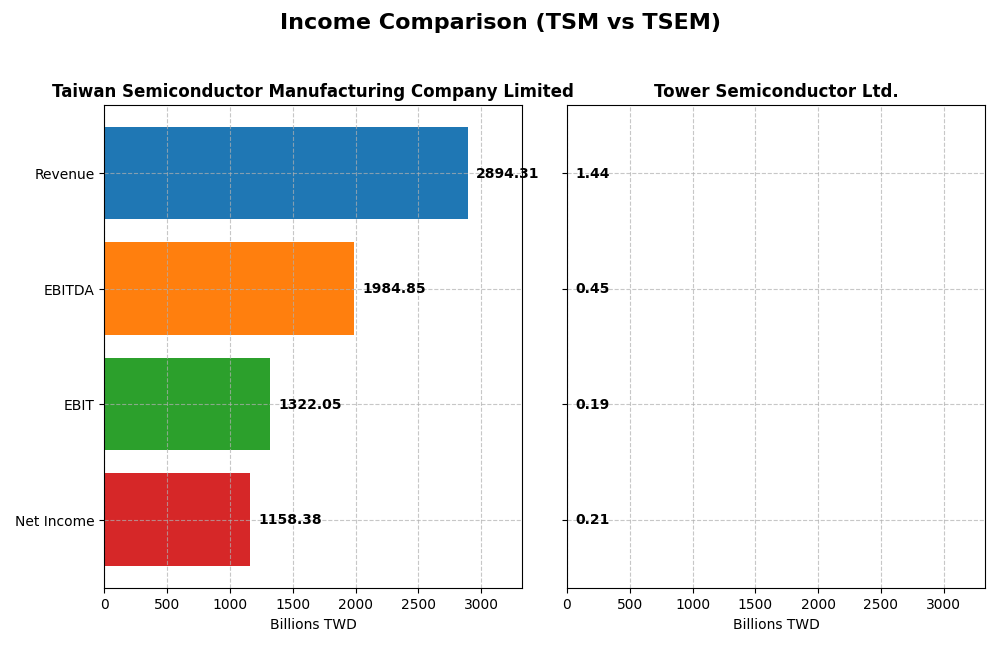
The table below compares the key financial metrics from the most recent fiscal year for Taiwan Semiconductor Manufacturing Company Limited (TSM) and Tower Semiconductor Ltd. (TSEM), providing a factual snapshot of their income statements.
| Metric | Taiwan Semiconductor Manufacturing Company Limited (TSM) | Tower Semiconductor Ltd. (TSEM) |
|---|---|---|
| Market Cap | 1.70T TWD | 13.8B USD |
| Revenue | 2.89T TWD | 1.44B USD |
| EBITDA | 1.98T TWD | 451M USD |
| EBIT | 1.32T TWD | 185M USD |
| Net Income | 1.16T TWD | 208M USD |
| EPS | 223.4 TWD | 1.87 USD |
| Fiscal Year | 2024 | 2024 |
Income Statement Interpretations
Taiwan Semiconductor Manufacturing Company Limited
Taiwan Semiconductor Manufacturing Company Limited (TSM) shows strong revenue growth from 2020 to 2024, increasing from 1.34T to 2.89T TWD, with net income rising from 510B to 1.16T TWD. Margins remain robust and stable, with a favorable gross margin around 56% and net margin near 40%. The 2024 fiscal year saw a significant revenue jump of 33.9%, with net income growth of 36%, while net margin slightly improved, reflecting operational strength.
Tower Semiconductor Ltd.
Tower Semiconductor Ltd. (TSEM) experienced moderate revenue growth over the 2020-2024 period, from 1.27B to 1.44B USD, while net income improved from 82M to 208M USD. Margins are lower compared to TSM but remain favorable, with a gross margin of 23.6% and net margin of 14.5%. However, the 2024 year showed a slowdown with less than 1% revenue growth and a sharp decline in net margin and earnings per share, indicating recent operational challenges.
Which one has the stronger fundamentals?
TSM demonstrates stronger fundamentals with consistently high and improving margins, significant revenue and net income growth, and mostly favorable income statement metrics. TSEM, while showing positive long-term net income growth, suffers from recent margin compression and slower revenue growth. The overall income statement evaluation favors TSM for its robust profitability and growth stability compared to TSEM’s mixed recent performance.
Financial Ratios Comparison
The table below presents a side-by-side comparison of key financial ratios for Taiwan Semiconductor Manufacturing Company Limited (TSM) and Tower Semiconductor Ltd. (TSEM) based on the most recent fiscal year 2024 data.
| Ratios | Taiwan Semiconductor Manufacturing Company Limited (TSM) | Tower Semiconductor Ltd. (TSEM) |
|---|---|---|
| ROE | 27.29% | 7.83% |
| ROIC | 19.99% | 6.41% |
| P/E | 29.04 | 27.54 |
| P/B | 7.92 | 2.16 |
| Current Ratio | 2.36 | 6.18 |
| Quick Ratio | 2.14 | 5.23 |
| D/E (Debt-to-Equity) | 0.25 | 0.07 |
| Debt-to-Assets | 15.65% | 5.87% |
| Interest Coverage | 126.0 | 32.64 |
| Asset Turnover | 0.43 | 0.47 |
| Fixed Asset Turnover | 0.88 | 1.11 |
| Payout ratio | 31.34% | 0% |
| Dividend yield | 1.08% | 0% |
Interpretation of the Ratios
Taiwan Semiconductor Manufacturing Company Limited
Taiwan Semiconductor Manufacturing Company Limited (TSM) presents mostly strong financial ratios, with favorable net margin at 40.02% and return on equity at 27.29%, indicating efficient profitability and equity use. However, valuation ratios like P/E at 29.04 and P/B at 7.92 appear stretched. The company pays dividends, yielding 1.08%, supported by free cash flow, with a cautious balance on payout sustainability.
Tower Semiconductor Ltd.
Tower Semiconductor Ltd. (TSEM) shows mixed financial ratios: while net margin at 14.47% is favorable, the return on equity at 7.83% is weak, signaling potential inefficiencies. The P/E ratio of 27.54 is relatively high, and the company has no dividend payout, likely reflecting a reinvestment strategy or growth focus. The balance sheet is strong, with low debt and favorable interest coverage.
Which one has the best ratios?
Overall, TSM exhibits a more favorable ratio profile, particularly in profitability and capital efficiency, despite some valuation concerns. TSEM’s ratios are less consistent, with weaker returns on equity and no dividends, but it maintains solid liquidity and low leverage. Thus, TSM’s ratios are generally stronger, while TSEM’s reflect a more cautious growth approach.
Strategic Positioning
This section compares the strategic positioning of Taiwan Semiconductor Manufacturing Company Limited (TSM) and Tower Semiconductor Ltd. (TSEM), including market position, key segments, and exposure to technological disruption:
Taiwan Semiconductor Manufacturing Company Limited
- Leading global foundry with significant market cap and competitive pressure from major industry players.
- Dominant in wafer fabrication, serving high performance computing, smartphones, IoT, automotive, and digital electronics.
- Invests in advanced wafer fabrication technologies and supports various semiconductor processes, reducing disruption risks.
Tower Semiconductor Ltd.
- Smaller foundry with niche market focus, facing moderate competitive pressure in analog and mixed-signal segments.
- Focused on analog intensive mixed-signal semiconductors for consumer electronics, automotive, industrial, aerospace, and medical.
- Provides customizable process technologies including SiGe, BiCMOS, RF CMOS, and MEMS, adapting to evolving technology needs.
Taiwan Semiconductor Manufacturing Company Limited vs Tower Semiconductor Ltd. Positioning
TSM operates with a broad, diversified product portfolio and a global footprint, benefiting from scale but facing intense competition. TSEM concentrates on specialized analog and mixed-signal markets, allowing targeted innovation but with limited scale and market reach.
Which has the best competitive advantage?
TSM shows a slightly favorable moat with value creation despite declining profitability, indicating stronger competitive advantage. TSEM has a slightly unfavorable moat, shedding value but improving profitability, suggesting weaker but improving competitive positioning.
Stock Comparison
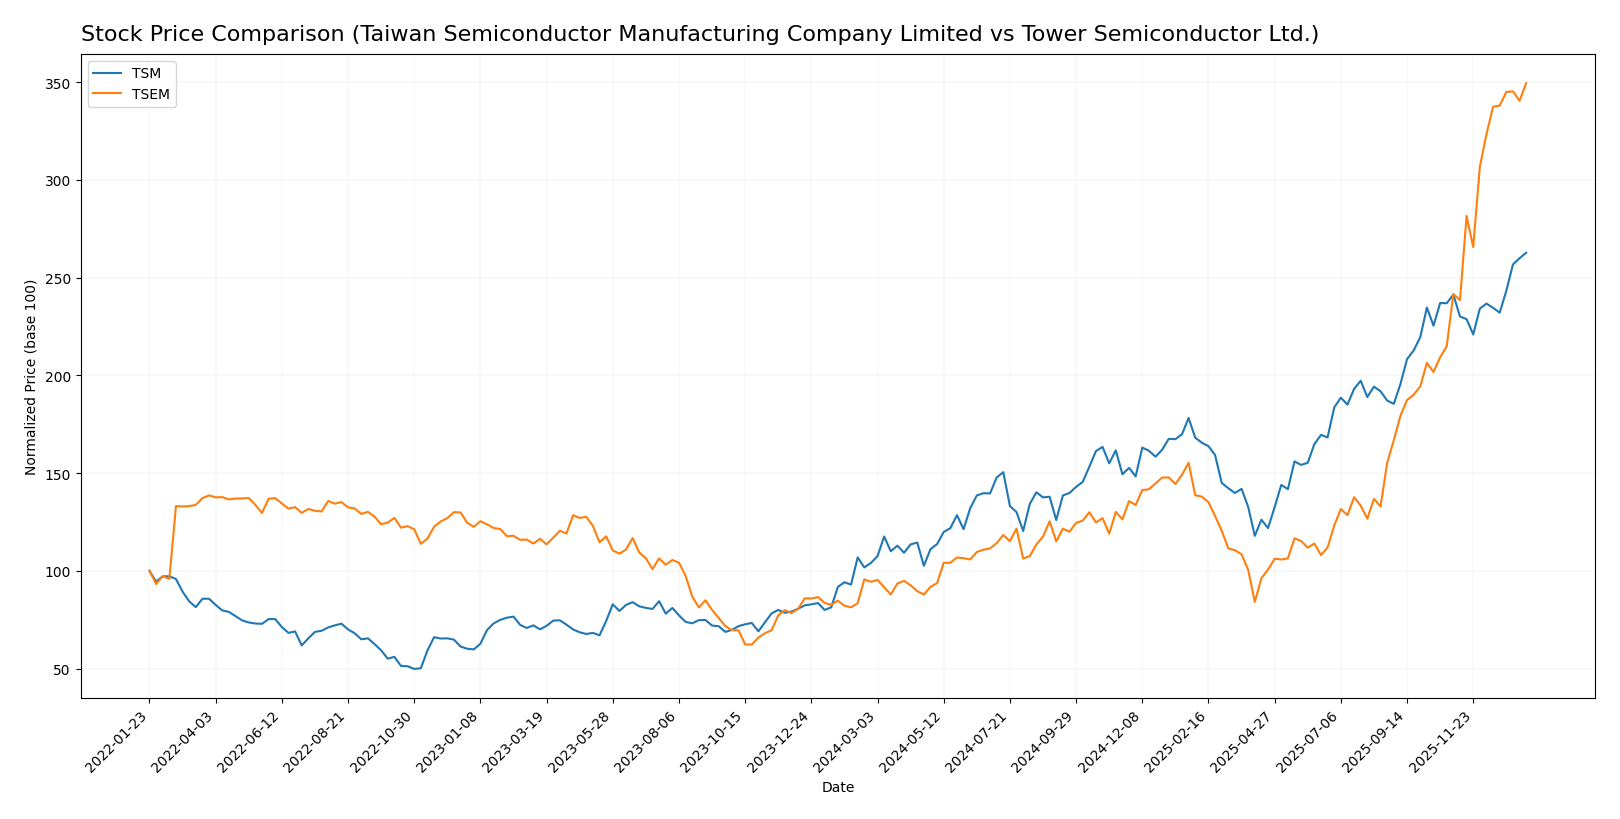
The stock price movements of Taiwan Semiconductor Manufacturing Company Limited (TSM) and Tower Semiconductor Ltd. (TSEM) over the past 12 months reveal significant bullish trends with strong acceleration, reflecting robust market dynamics and notable price appreciations.
Trend Analysis
Taiwan Semiconductor Manufacturing Company Limited (TSM) exhibited a bullish trend over the past year with a price increase of 152.54%, showing acceleration and high volatility with a standard deviation of 51.25. The stock reached a high of 327.11 and a low of 127.7.
Tower Semiconductor Ltd. (TSEM) also demonstrated a bullish trend with a more pronounced price increase of 270.3% over the same period, accompanied by acceleration and moderate volatility at a standard deviation of 23.65. The stock hit a high of 123.2 and a low of 29.65.
Comparing both stocks, TSEM delivered the highest market performance with a 270.3% gain versus TSM’s 152.54%, indicating stronger relative growth in the analyzed period.
Target Prices
Analysts show a positive consensus for both Taiwan Semiconductor Manufacturing Company Limited and Tower Semiconductor Ltd.
| Company | Target High | Target Low | Consensus |
|---|---|---|---|
| Taiwan Semiconductor Manufacturing Company Limited | 400 | 330 | 361.25 |
| Tower Semiconductor Ltd. | 125 | 66 | 96 |
The consensus target prices suggest upside potential for TSM and TSEM compared to their current prices of $327.11 and $123.20, respectively, indicating moderate to strong analyst confidence in growth.
Analyst Opinions Comparison
This section compares analysts’ ratings and grades for Taiwan Semiconductor Manufacturing Company Limited (TSM) and Tower Semiconductor Ltd. (TSEM):
Rating Comparison
TSM Rating
- Rating: A- indicating a very favorable overall assessment from analysts.
- Discounted Cash Flow Score: 5, very favorable, suggesting strong cash flow potential.
- ROE Score: 5, very favorable, showing excellent profit generation from equity.
- ROA Score: 5, very favorable, reflecting effective asset utilization.
- Debt To Equity Score: 3, moderate, indicating some financial risk from debt.
- Overall Score: 4, favorable overall financial standing.
TSEM Rating
- Rating: B+ also considered very favorable but lower than TSM’s rating.
- Discounted Cash Flow Score: 3, moderate, indicating average future cash flow projections.
- ROE Score: 3, moderate, indicating average efficiency in generating profit.
- ROA Score: 4, favorable, showing good but slightly lower asset efficiency.
- Debt To Equity Score: 4, favorable, suggesting better financial stability.
- Overall Score: 3, moderate overall financial standing.
Which one is the best rated?
Based strictly on the provided data, TSM holds a superior rating with higher scores in discounted cash flow, ROE, ROA, and overall score, while TSEM performs better on debt-to-equity but has lower ratings overall.
Scores Comparison
Here is a comparison of the financial scores for TSM and TSEM companies:
TSM Scores
- Altman Z-Score: 2.94, in the grey zone, indicating moderate bankruptcy risk.
- Piotroski Score: 8, classified as very strong financial health.
TSEM Scores
- Altman Z-Score: 20.26, in the safe zone, indicating very low bankruptcy risk.
- Piotroski Score: 7, classified as strong financial health.
Which company has the best scores?
Based on the provided data, TSEM shows a significantly higher Altman Z-Score, placing it firmly in the safe zone, while TSM is in the grey zone. However, TSM has a slightly higher Piotroski Score, indicating marginally stronger financial health.
Grades Comparison
Here is a detailed comparison of the recent grades assigned to Taiwan Semiconductor Manufacturing Company Limited and Tower Semiconductor Ltd.:
Taiwan Semiconductor Manufacturing Company Limited Grades
The following table presents recent grades from reputable grading companies for TSM:
| Grading Company | Action | New Grade | Date |
|---|---|---|---|
| Bernstein | Maintain | Outperform | 2025-12-08 |
| Needham | Maintain | Buy | 2025-10-27 |
| Barclays | Maintain | Overweight | 2025-10-17 |
| Needham | Maintain | Buy | 2025-10-16 |
| Susquehanna | Maintain | Positive | 2025-10-10 |
| Barclays | Maintain | Overweight | 2025-10-09 |
| Barclays | Maintain | Overweight | 2025-09-16 |
| Needham | Maintain | Buy | 2025-07-17 |
| Susquehanna | Maintain | Positive | 2025-07-14 |
| Needham | Maintain | Buy | 2025-07-01 |
The overall trend for TSM shows consistently positive ratings, predominantly Buy or equivalent, with no downgrades observed.
Tower Semiconductor Ltd. Grades
The following table summarizes recent grades from credible grading firms for TSEM:
| Grading Company | Action | New Grade | Date |
|---|---|---|---|
| Benchmark | Maintain | Buy | 2026-01-09 |
| Wedbush | Downgrade | Neutral | 2025-12-31 |
| Benchmark | Maintain | Buy | 2025-11-11 |
| Susquehanna | Maintain | Positive | 2025-11-11 |
| Wedbush | Maintain | Outperform | 2025-11-11 |
| Barclays | Maintain | Equal Weight | 2025-11-11 |
| Benchmark | Maintain | Buy | 2025-09-08 |
| Susquehanna | Maintain | Positive | 2025-08-05 |
| Benchmark | Maintain | Buy | 2025-08-05 |
| Benchmark | Maintain | Buy | 2025-08-04 |
TSEM’s grades show mostly Buy and Positive ratings, though a notable downgrade to Neutral by Wedbush occurred at the end of 2025.
Which company has the best grades?
TSM has received more consistent and higher grades, mainly Buy and Outperform, while TSEM’s ratings include a Neutral downgrade and a mix of Buy and Equal Weight. Investors may interpret TSM’s steadier positive outlook as a sign of stronger analyst confidence.
Strengths and Weaknesses
Below is a comparative overview of the strengths and weaknesses of Taiwan Semiconductor Manufacturing Company Limited (TSM) and Tower Semiconductor Ltd. (TSEM) based on the latest financial and strategic data.
| Criterion | TSM | TSEM |
|---|---|---|
| Diversification | Strong focus on wafer manufacturing with some other products; high revenue scale (over 3.8T TWD in 2024) | More limited product segmentation; less diversified portfolio |
| Profitability | High net margin (40.02%) and ROIC (20%), creating value though with declining trend | Moderate net margin (14.47%) and ROIC (6.41%), currently shedding value but improving |
| Innovation | Leading-edge semiconductor technology; strong R&D investment | Smaller scale innovation, improving profitability indicates growing strength |
| Global presence | Extensive global footprint as largest pure-play foundry | Niche market presence, regional focus with growth potential |
| Market Share | Dominant share in global semiconductor foundry market | Smaller market share, competing in specialized segments |
Key takeaways: TSM exhibits strong profitability and market dominance but faces a declining ROIC trend, signaling the need for cautious monitoring. TSEM, while currently less profitable and value destructive, shows improving profitability and potential for growth, making it a riskier but promising option.
Risk Analysis
Below is a comparative table of key risks for Taiwan Semiconductor Manufacturing Company Limited (TSM) and Tower Semiconductor Ltd. (TSEM) based on their latest available data for 2024 and recent contextual factors.
| Risk | Taiwan Semiconductor Manufacturing Company Limited (TSM) | Tower Semiconductor Ltd. (TSEM) |
|---|---|---|
| Market Risk | High beta of 1.274 indicates higher volatility; global chip demand fluctuations impact revenue | Lower beta of 0.876 suggests less volatility; niche analog/mixed-signal markets offer some insulation |
| Debt Level | Moderate leverage: Debt to equity 0.25, debt to assets 15.65%, strong interest coverage (126x) | Low leverage: Debt to equity 0.07, debt to assets 5.87%, interest coverage 31.6x, financially stable |
| Regulatory Risk | Exposure to Taiwan-China tensions and global trade policies affecting supply chain | Regulatory exposure mainly in Israel and international markets; geopolitical tensions less acute but present |
| Operational Risk | Large-scale complex manufacturing with high fixed asset turnover challenges | Smaller scale but diversified technology platforms; operational complexity moderate |
| Environmental Risk | Industry-wide pressure on sustainability and energy use; TSM invests in technology innovation | Similar semiconductor environmental challenges; less public data on sustainability initiatives |
| Geopolitical Risk | High due to Taiwan-China relations, potential supply chain disruptions | Moderate geopolitical risk; Israel faces regional instability but company less impacted globally |
Synthesizing these risks, TSM’s most impactful and likely risks stem from geopolitical tensions in Taiwan and market volatility given its large global footprint. TSEM’s key risks involve operational efficiency and moderate geopolitical exposure, though its lower debt levels provide a cushion. Investors should weigh TSM’s growth potential against these geopolitical and market uncertainties, while TSEM offers a more conservative risk profile with moderate growth prospects.
Which Stock to Choose?
Taiwan Semiconductor Manufacturing Company Limited (TSM) shows strong income growth with a 33.89% revenue increase in 2024, favorable financial ratios including a 27.29% ROE, and solid profitability with a 40.02% net margin. The company maintains low debt levels and holds a very favorable rating of A-.
Tower Semiconductor Ltd. (TSEM) exhibits modest revenue growth of 0.94% in 2024 with mostly favorable income statement metrics but mixed financial ratios, including a lower 7.83% ROE and a slightly favorable overall rating of B+. Debt is minimal, and the company shows a growing ROIC trend despite negative value creation.
For investors prioritizing strong profitability and value creation, TSM might appear more favorable due to its higher income growth and robust financial ratios, while TSEM could be seen as potentially appealing for those focused on improving profitability and growth trends despite current challenges.
Disclaimer: Investment carries a risk of loss of initial capital. The past performance is not a reliable indicator of future results. Be sure to understand risks before making an investment decision.
Go Further
I encourage you to read the complete analyses of Taiwan Semiconductor Manufacturing Company Limited and Tower Semiconductor Ltd. to enhance your investment decisions: