Home > Comparison > Technology > TSM vs TXN
The strategic rivalry between Taiwan Semiconductor Manufacturing Company Limited and Texas Instruments Incorporated shapes the semiconductor industry’s future. TSMC operates as a capital-intensive manufacturer specializing in wafer fabrication and advanced chip production. In contrast, Texas Instruments focuses on higher-margin analog and embedded processing products, balancing innovation with steady cash flow. This analysis will determine which company’s operational model offers the superior risk-adjusted return for a diversified technology portfolio in 2026.
Table of contents
Companies Overview
Taiwan Semiconductor Manufacturing Company and Texas Instruments dominate critical segments of the semiconductor industry.
Taiwan Semiconductor Manufacturing Company Limited: Global Foundry Powerhouse
Taiwan Semiconductor Manufacturing Company Limited commands the leading position in semiconductor fabrication worldwide. It generates revenue by manufacturing and testing integrated circuits for diverse applications, including high-performance computing and smartphones. In 2026, it strategically focuses on advancing wafer fabrication technologies and expanding its engineering support services to maintain technological leadership.
Texas Instruments Incorporated: Analog and Embedded Innovation Leader
Texas Instruments Incorporated excels in designing and selling analog and embedded processing semiconductors globally. Its revenue stems from power management products and microcontrollers used in automotive, industrial, and personal electronics markets. The company prioritizes product innovation and direct sales channels in 2026 to strengthen its presence in specialized semiconductor segments.
Strategic Collision: Similarities & Divergences
Both companies operate in semiconductors but diverge sharply in business models. Taiwan Semiconductor runs a pure-play foundry with an open manufacturing ecosystem, while Texas Instruments integrates design with targeted analog and embedded solutions. Their primary battleground lies in serving differentiated customer bases—foundry clients versus end-product manufacturers. This contrast shapes distinct investment profiles: one capitalizes on scale and innovation in fabrication; the other on specialized product breadth and customer intimacy.
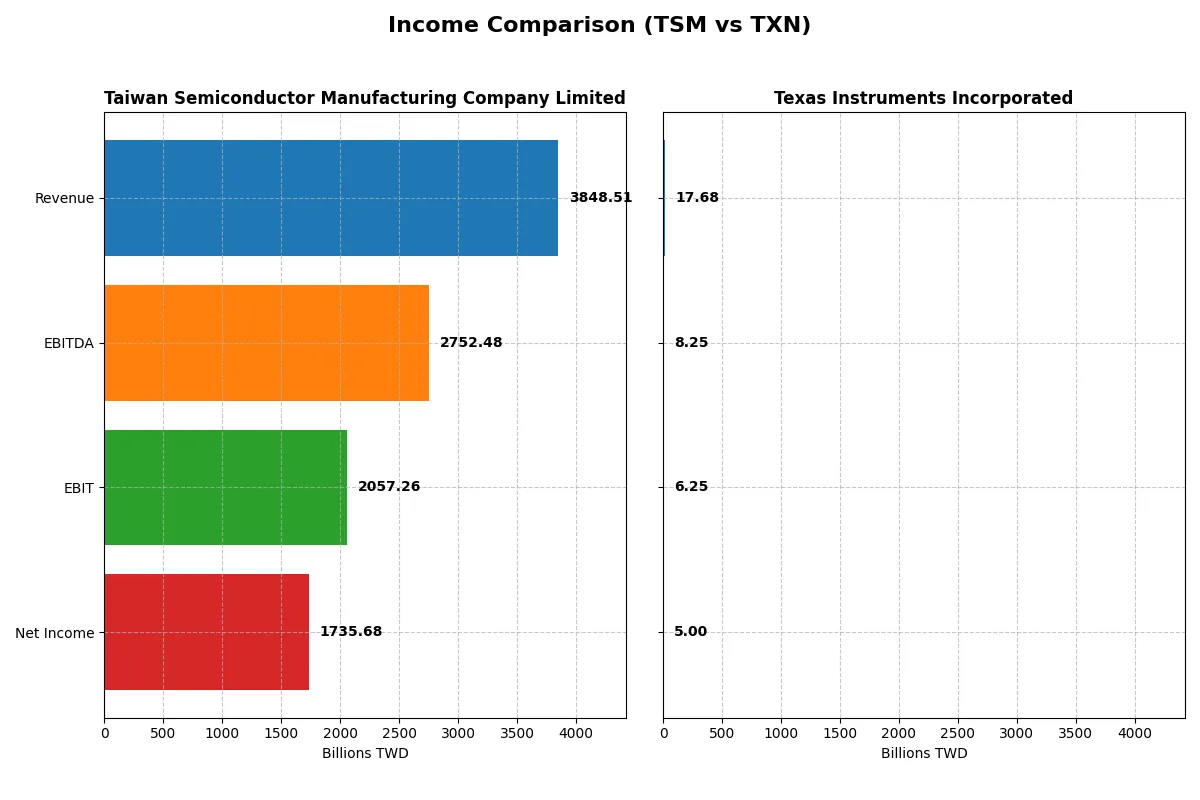
Income Statement Comparison
This data dissects the core profitability and scalability of both corporate engines to reveal who dominates the bottom line:
| Metric | Taiwan Semiconductor Manufacturing Company Limited (TSM) | Texas Instruments Incorporated (TXN) |
|---|---|---|
| Revenue | 3.85T TWD | 17.7B USD |
| Cost of Revenue | 1.54T TWD | 7.60B USD |
| Operating Expenses | 349.2B TWD | 4.06B USD |
| Gross Profit | 2.30T TWD | 10.1B USD |
| EBITDA | 2.75T TWD | 8.25B USD |
| EBIT | 2.06T TWD | 6.25B USD |
| Interest Expense | 0 | 543M USD |
| Net Income | 1.74T TWD | 5.00B USD |
| EPS | 334.6 TWD | 5.45 USD |
| Fiscal Year | 2025 | 2025 |
Income Statement Analysis: The Bottom-Line Duel
This income statement comparison reveals which company delivers superior operational efficiency and profit generation amid evolving market conditions.
Taiwan Semiconductor Manufacturing Company Limited Analysis
TSM’s revenue surged 33% in 2025, reaching 3.85T TWD, with net income climbing 50% to 1.74T TWD. The company sustains robust margins: a gross margin near 60% and a net margin surpassing 45%. In 2025, TSM’s sharp EBIT growth of over 55% signals powerful operating leverage and accelerating profitability momentum.
Texas Instruments Incorporated Analysis
TXN posted a 13% revenue increase to $17.7B in 2025, with net income slightly rising to $5B. Gross margin holds steady above 57%, but net margin at 28% lags behind TSM’s efficiency. EBIT growth was modest at under 5%, and net margin declined, reflecting pressure on bottom-line expansion despite solid top-line gains.
Margin Dominance vs. Revenue Resilience
TSM clearly outpaces TXN in margin expansion, revenue growth, and net income acceleration, demonstrating superior capital allocation and operational control. TXN shows resilience with steady revenue but struggles with margin compression and stagnant profit growth. For investors prioritizing scalable profits and efficiency, TSM’s profile is decisively more attractive.
Financial Ratios Comparison
These vital ratios act as a diagnostic tool to expose the underlying fiscal health, valuation premiums, and capital efficiency of each company:
| Ratios | Taiwan Semiconductor Manufacturing Company Limited (TSM) | Texas Instruments Incorporated (TXN) |
|---|---|---|
| ROE | 32.1% | 30.7% |
| ROIC | 24.9% | 16.5% |
| P/E | 28.5 | 31.5 |
| P/B | 9.14 | 9.69 |
| Current Ratio | 2.62 | 4.35 |
| Quick Ratio | 2.42 | 2.83 |
| D/E | 0.18 | 0.86 |
| Debt-to-Assets | 12.5% | 40.6% |
| Interest Coverage | 0 | 11.1 |
| Asset Turnover | 0.49 | 0.51 |
| Fixed Asset Turnover | 1.05 | 1.44 |
| Payout ratio | 27.2% | 99.96% |
| Dividend yield | 0.95% | 3.17% |
| Fiscal Year | 2025 | 2025 |
Efficiency & Valuation Duel: The Vital Signs
Financial ratios act as a company’s DNA, exposing hidden risks and operational strengths vital for investment decisions.
Taiwan Semiconductor Manufacturing Company Limited
Taiwan Semiconductor boasts a robust 32.12% ROE and a strong 45.1% net margin, reflecting high profitability and operational excellence. However, its P/E of 28.45 signals a stretched valuation relative to earnings. The company maintains a prudent capital structure with a low debt-to-equity of 0.18 and returns 0.95% dividend yield, favoring stability alongside reinvestment in R&D.
Texas Instruments Incorporated
Texas Instruments delivers a solid 30.73% ROE and a 28.28% net margin, indicating efficient profit generation. Its P/E of 31.53 suggests the stock is expensive compared to earnings. The firm supports shareholders with a higher 3.17% dividend yield, while maintaining moderate leverage (D/E 0.86) and focusing on steady cash flow rather than aggressive growth.
Balanced Profitability vs. Yield Focus
TSM offers superior profitability and a conservative balance sheet but trades at a stretched valuation with modest dividends. TXN provides a slightly lower profitability profile but compensates with higher dividends and manageable risks. Investors seeking growth lean toward TSM, while income-focused profiles align better with TXN.
Which one offers the Superior Shareholder Reward?
I compare Taiwan Semiconductor Manufacturing Company Limited (TSM) and Texas Instruments Incorporated (TXN) on their shareholder return strategies. TSM yields about 1.08% with a moderate payout ratio near 31%, maintaining strong free cash flow (FCF) coverage. It pairs dividends with consistent buybacks, signaling balanced capital allocation. TXN offers a higher dividend yield near 3.17%, but with a payout ratio close to 100%, straining FCF coverage. Its buyback activity is less intense relative to earnings. Historically in semiconductors, sustainable distributions hinge on robust FCF and reinvestment capacity. I find TSM’s distribution model more sustainable, balancing growth and rewards. TXN’s yield is attractive but risks future cuts if earnings falter. In 2026, TSM offers a superior total return profile through prudent dividends and disciplined buybacks, supporting long-term value creation better than TXN.
Comparative Score Analysis: The Strategic Profile
The radar chart reveals the fundamental DNA and trade-offs of Taiwan Semiconductor Manufacturing Company Limited and Texas Instruments Incorporated:
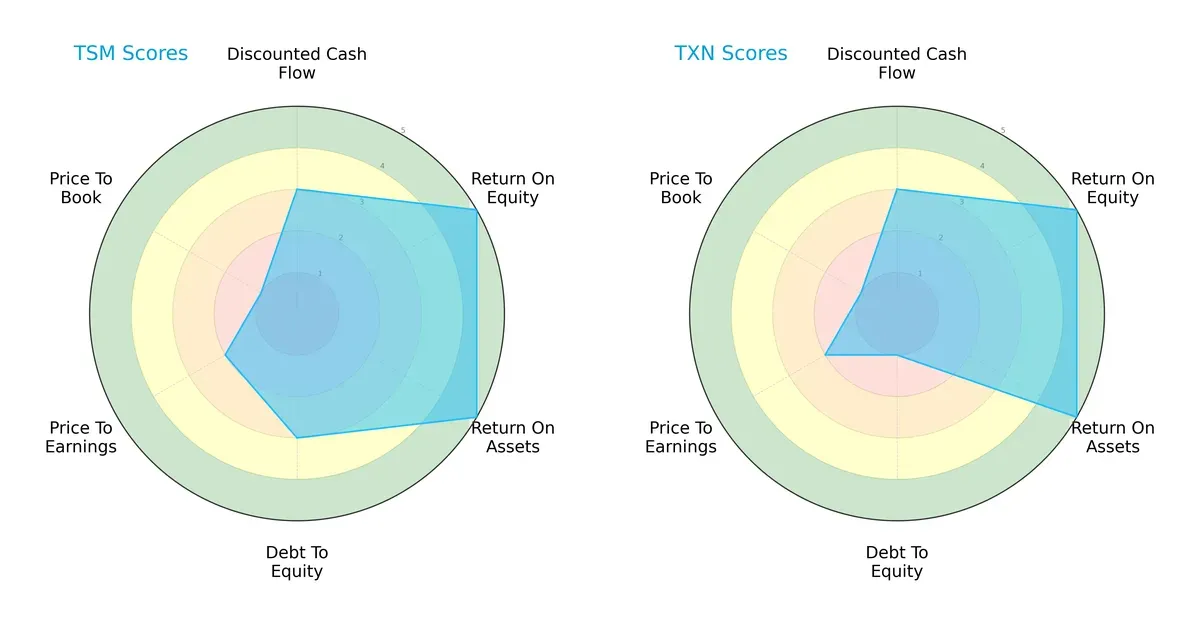
Both companies share strong ROE and ROA scores of 5, showcasing efficient profit generation and asset utilization. TSM holds a moderate debt-to-equity score of 3, indicating balanced leverage, while TXN scores a weak 1, signaling higher financial risk. Valuation metrics are equally unfavorable for both, with P/E at 2 and P/B at 1. TSM demonstrates a more balanced financial profile; TXN leans on operational efficiency but carries higher debt risk.
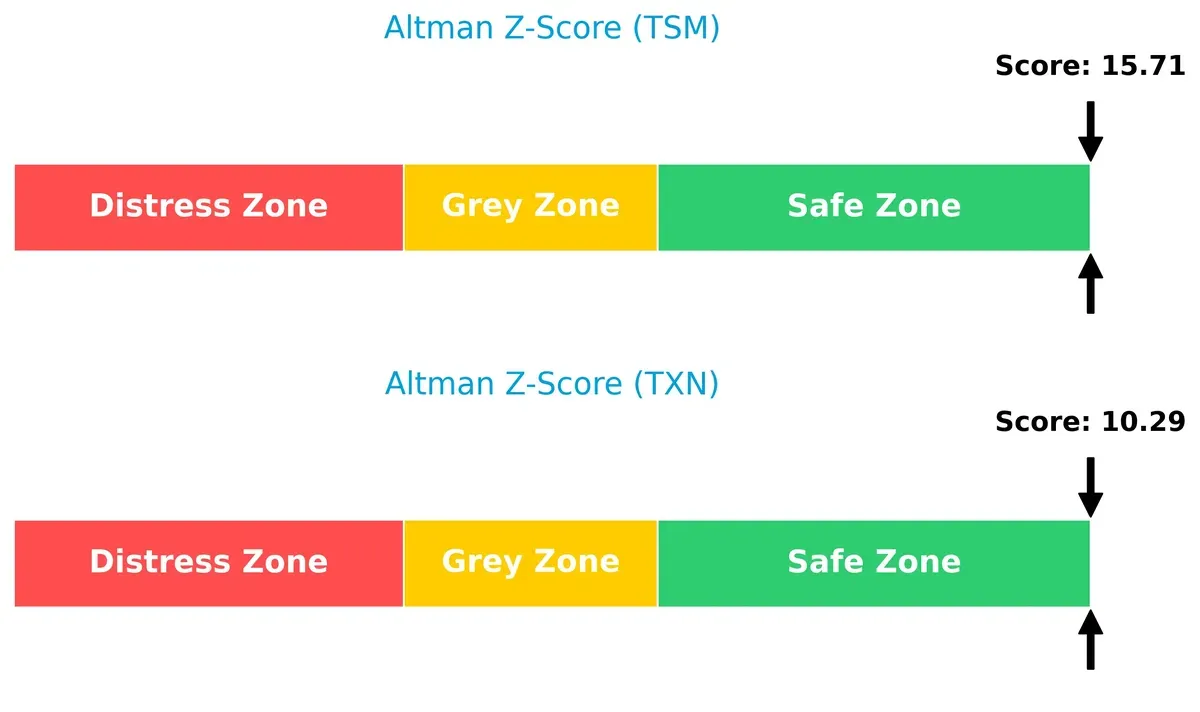
Bankruptcy Risk: Solvency Showdown
TSM’s Altman Z-Score of 15.7 far exceeds TXN’s 10.3, both safely in the “safe zone,” but TSM’s stronger buffer implies greater resilience against downturns in this cycle:
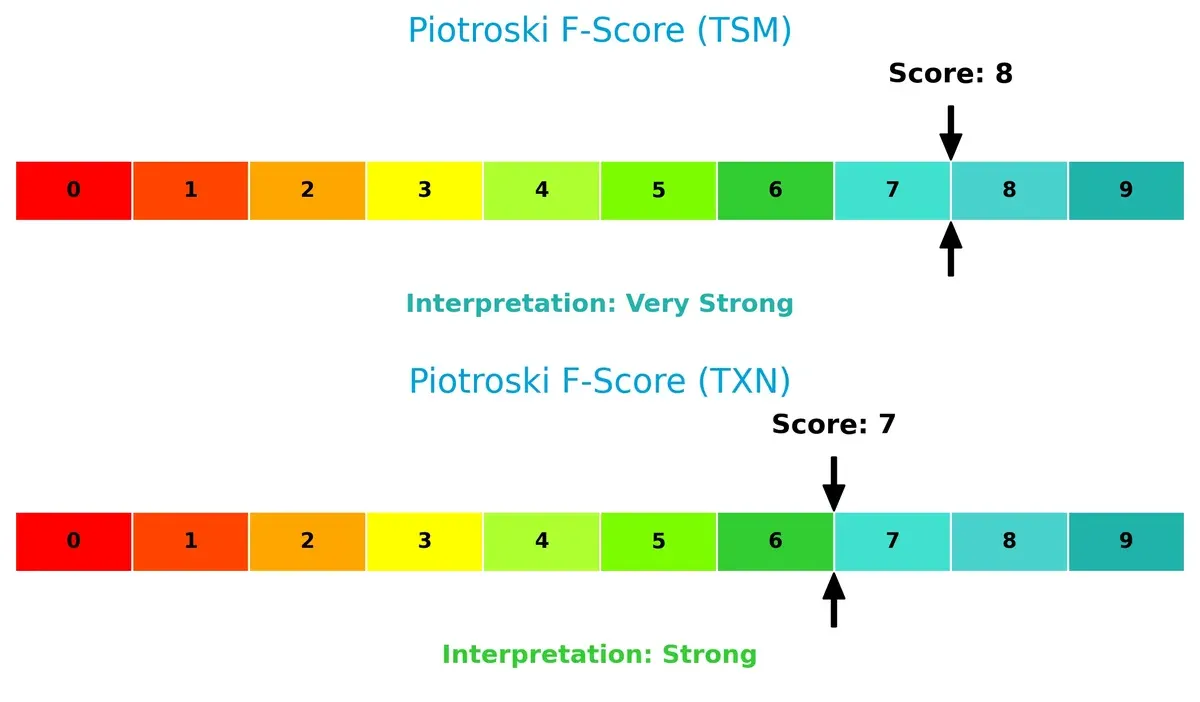
Financial Health: Quality of Operations
TSM scores an 8 on the Piotroski F-Score, indicating very strong financial health with robust internal metrics. TXN’s 7 is strong but slightly weaker, suggesting some caution on operational consistency:
How are the two companies positioned?
This section dissects the operational DNA of TSM and TXN by comparing their revenue distribution and internal dynamics. The goal is to confront their economic moats and identify which model offers the most resilient, sustainable competitive advantage today.
Revenue Segmentation: The Strategic Mix
This comparison dissects how Taiwan Semiconductor Manufacturing Company and Texas Instruments diversify income streams and where their primary sector bets lie:
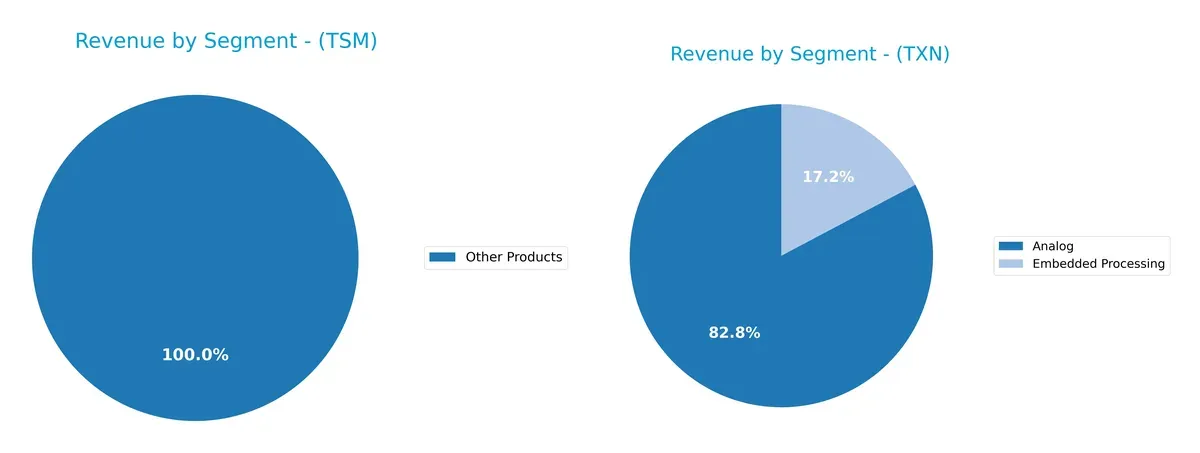
Taiwan Semiconductor anchors revenue heavily in its Wafer segment, generating over 1.9T TWD in 2022, dwarfing Other Products at 272B TWD. Texas Instruments exhibits a more balanced mix, with Analog at $12.2B and Embedded Processing at $2.5B in 2024. TSM’s wafer reliance signals infrastructure dominance but exposes concentration risk. TXN’s diversified portfolio mitigates risk and pivots on ecosystem lock-in through multiple semiconductor subfields.
Strengths and Weaknesses Comparison
This table compares the Strengths and Weaknesses of Taiwan Semiconductor Manufacturing Company Limited (TSM) and Texas Instruments Incorporated (TXN):
TSM Strengths
- High net margin at 45.1%
- ROE strong at 32.12%
- ROIC well above WACC at 24.92%
- Low debt-to-assets at 12.52%
- Excellent current and quick ratios above 2.4
- Dominant US revenue of 1.99T TWD
TXN Strengths
- Robust net margin at 28.28%
- Strong ROE of 30.73%
- Favorable interest coverage at 11.52
- Higher dividend yield at 3.17%
- Diverse geographic revenue including US and Asia
- Balanced product segments Analog and Embedded Processing
TSM Weaknesses
- Unfavorable P/E and P/B ratios at 28.45 and 9.14
- Asset turnover low at 0.49
- Dividend yield weak at 0.95%
- Moderate fixed asset turnover at 1.05
- Relies heavily on wafer segment revenue
TXN Weaknesses
- Unfavorable P/E and P/B ratios at 31.53 and 9.69
- Current ratio very high at 4.35 indicating excess liquidity
- Debt-to-assets neutral but higher at 40.62%
- Moderate asset and fixed asset turnover (0.51, 1.44)
TSM’s strengths lie in profitability and capital structure efficiency, but valuation metrics and asset utilization show caution. TXN offers solid profitability and dividend appeal, balanced by a heavier debt load and liquidity inefficiencies. Both companies show strategic focus on core segments and global markets, which frames their respective growth and risk profiles.
The Moat Duel: Analyzing Competitive Defensibility
A structural moat is the crucial shield that preserves long-term profits from relentless competitive pressures. Let’s examine the moat dynamics of two semiconductor giants:
Taiwan Semiconductor Manufacturing Company Limited: Scale-Driven Cost Advantage
TSMC’s moat stems from its unparalleled scale and advanced manufacturing tech. This drives a 15%+ ROIC well above WACC, fueling 53% EBIT margins and margin stability. In 2026, expanding advanced nodes and new markets deepen this advantage.
Texas Instruments Incorporated: Diversified Analog Expertise
Texas Instruments relies on its broad analog and embedded processing portfolio, emphasizing stable customer relationships and product niche. While it creates value (ROIC > WACC), its profitability trend declines, signaling margin pressure. Future growth hinges on innovation and market expansion.
Verdict: Scale Dominance vs. Product Diversification
TSMC commands a deeper moat with growing ROIC and superior margin profiles. Texas Instruments remains a value creator but faces shrinking profitability. TSMC’s scale and tech leadership better defend market share in a fiercely competitive semiconductor landscape.
Which stock offers better returns?
The past year shows Taiwan Semiconductor’s stock surging sharply with accelerating gains, while Texas Instruments also advances steadily with notable positive momentum.
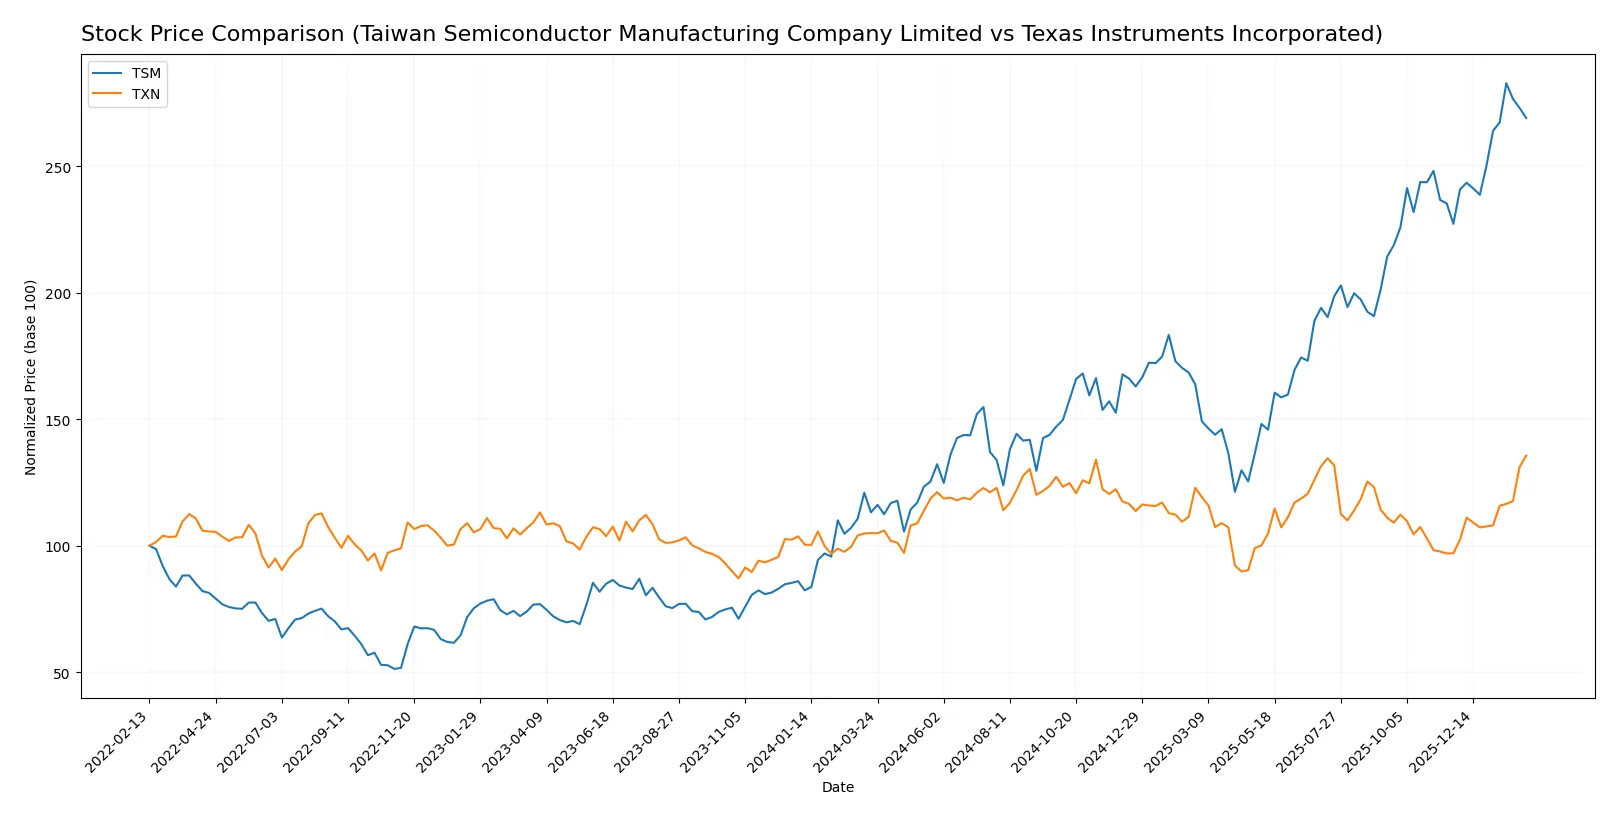
Trend Comparison
Taiwan Semiconductor’s stock rose 137.8% over the past 12 months, marking a bullish trend with accelerating gains and a high volatility of 54.49. It reached a peak of 342.4 and a low of 127.7.
Texas Instruments gained 29.21% over the same period, exhibiting a bullish and accelerating trend with lower volatility at 16.23. The stock peaked at 222.92 and bottomed at 147.6.
Taiwan Semiconductor outperformed Texas Instruments significantly in market returns, delivering the highest price appreciation by a wide margin.
Target Prices
Analysts present a moderate upside for both Taiwan Semiconductor Manufacturing Company Limited and Texas Instruments Incorporated.
| Company | Target Low | Target High | Consensus |
|---|---|---|---|
| Taiwan Semiconductor Manufacturing Company Limited | 330 | 450 | 397.5 |
| Texas Instruments Incorporated | 160 | 260 | 204.64 |
The target consensus for TSM implies a roughly 22% upside from the current 325.74, signaling confidence in its semiconductor leadership. TXN’s consensus target suggests a slight 8% downside, reflecting mixed sentiment despite its solid fundamentals.

Don’t Let Luck Decide Your Entry Point
Optimize your entry points with our advanced ProRealTime indicators. You’ll get efficient buy signals with precise price targets for maximum performance. Start outperforming now!
How do institutions grade them?
The latest institutional grades for Taiwan Semiconductor Manufacturing Company Limited and Texas Instruments Incorporated are as follows:
Taiwan Semiconductor Manufacturing Company Limited Grades
Here are the recent grades assigned by reliable grading companies for TSM:
| Grading Company | Action | New Grade | Date |
|---|---|---|---|
| TD Cowen | Maintain | Hold | 2026-01-16 |
| Barclays | Maintain | Overweight | 2026-01-16 |
| Needham | Maintain | Buy | 2026-01-15 |
| Bernstein | Maintain | Outperform | 2025-12-08 |
| Needham | Maintain | Buy | 2025-10-27 |
| Barclays | Maintain | Overweight | 2025-10-17 |
| Needham | Maintain | Buy | 2025-10-16 |
| Susquehanna | Maintain | Positive | 2025-10-10 |
| Barclays | Maintain | Overweight | 2025-10-09 |
| Barclays | Maintain | Overweight | 2025-09-16 |
Texas Instruments Incorporated Grades
Below are the latest grades from recognized institutions for TXN:
| Grading Company | Action | New Grade | Date |
|---|---|---|---|
| Jefferies | Maintain | Hold | 2026-01-28 |
| Cantor Fitzgerald | Maintain | Neutral | 2026-01-28 |
| Goldman Sachs | Maintain | Sell | 2026-01-28 |
| Truist Securities | Maintain | Hold | 2026-01-28 |
| Deutsche Bank | Maintain | Hold | 2026-01-28 |
| Stifel | Maintain | Hold | 2026-01-28 |
| UBS | Maintain | Buy | 2026-01-28 |
| B of A Securities | Upgrade | Neutral | 2026-01-28 |
| Wells Fargo | Maintain | Equal Weight | 2026-01-28 |
| JP Morgan | Maintain | Overweight | 2026-01-28 |
Which company has the best grades?
TSM consistently receives stronger grades such as Buy, Overweight, and Outperform, signaling greater institutional confidence. TXN’s grades skew more conservative, including Hold and Neutral, which may temper investor enthusiasm. This divergence can influence portfolio positioning and risk appetite.
Risks specific to each company
The following categories identify the critical pressure points and systemic threats facing both firms in the 2026 market environment:
1. Market & Competition
Taiwan Semiconductor Manufacturing Company Limited (TSM)
- Dominates advanced wafer fabrication but faces intense competition in cutting-edge nodes.
Texas Instruments Incorporated (TXN)
- Strong in analog and embedded markets but competes with diversified semiconductor firms globally.
2. Capital Structure & Debt
Taiwan Semiconductor Manufacturing Company Limited (TSM)
- Low debt ratios (D/E 0.18, debt/assets 12.5%) indicate conservative leverage.
Texas Instruments Incorporated (TXN)
- High debt levels (D/E 0.86, debt/assets 40.6%) raise financial risk moderately.
3. Stock Volatility
Taiwan Semiconductor Manufacturing Company Limited (TSM)
- Beta of 1.27 suggests above-market volatility.
Texas Instruments Incorporated (TXN)
- Beta near 1.0 indicates market-level volatility.
4. Regulatory & Legal
Taiwan Semiconductor Manufacturing Company Limited (TSM)
- Exposure to cross-strait tensions could trigger regulatory and operational risks.
Texas Instruments Incorporated (TXN)
- Subject to US regulatory scrutiny but benefits from a stable legal environment.
5. Supply Chain & Operations
Taiwan Semiconductor Manufacturing Company Limited (TSM)
- Relies heavily on Taiwan-based manufacturing, vulnerable to geopolitical disruption.
Texas Instruments Incorporated (TXN)
- More geographically diversified operations reduce supply chain concentration risk.
6. ESG & Climate Transition
Taiwan Semiconductor Manufacturing Company Limited (TSM)
- Faces pressure to enhance ESG disclosures amid global technology sector scrutiny.
Texas Instruments Incorporated (TXN)
- Shows gradual ESG integration aligned with US investor expectations.
7. Geopolitical Exposure
Taiwan Semiconductor Manufacturing Company Limited (TSM)
- High exposure to Taiwan-China tensions presents a significant geopolitical risk.
Texas Instruments Incorporated (TXN)
- Primarily exposed to US and global trade policies with less direct political risk.
Which company shows a better risk-adjusted profile?
TSM’s most impactful risk lies in geopolitical exposure and operational concentration in Taiwan, which could disrupt supply and growth. TXN’s biggest risk is its high leverage, increasing vulnerability to interest rate shifts and financial stress. Despite TSM’s geopolitical concerns, its conservative capital structure and superior profitability create a more favorable risk-adjusted profile. TXN’s elevated debt and moderate operational scale temper its risk appeal, despite a more stable geopolitical environment. The recent surge in Taiwan-China tensions underlines my concern for TSM’s operational continuity, while TXN’s debt ratios warrant caution in a rising rate cycle.
Final Verdict: Which stock to choose?
Taiwan Semiconductor Manufacturing Company Limited (TSM) excels as a cash-generating powerhouse with a very favorable moat, driven by its growing ROIC well above WACC. Its main point of vigilance lies in its relatively high valuation multiples, which might temper near-term upside. TSM suits investors seeking aggressive growth fueled by operational excellence and market leadership.
Texas Instruments Incorporated (TXN) boasts a strategic moat centered on stable recurring revenues and robust dividend yield, offering more safety through a stronger current ratio yet a declining ROIC trend. Its moderate valuation and solid cash flow profile make TXN appealing for Growth at a Reasonable Price (GARP) investors prioritizing income and steadiness.
If you prioritize aggressive expansion and capital efficiency, TSM outshines with superior profitability and sustainable competitive advantage. However, if you seek income stability and a defensive stance, TXN offers better stability and a reliable dividend despite some profitability erosion. Both present compelling but distinct analytical scenarios depending on your risk tolerance and investment horizon.
Disclaimer: Investment carries a risk of loss of initial capital. The past performance is not a reliable indicator of future results. Be sure to understand risks before making an investment decision.
Go Further
I encourage you to read the complete analyses of Taiwan Semiconductor Manufacturing Company Limited and Texas Instruments Incorporated to enhance your investment decisions: