Home > Comparison > Technology > TSM vs TER
The strategic rivalry between Taiwan Semiconductor Manufacturing Company Limited and Teradyne, Inc. shapes the semiconductor industry’s evolution. Taiwan Semiconductor dominates as a capital-intensive chip foundry, while Teradyne excels as a specialized test equipment provider with diversified automation offerings. This head-to-head pits manufacturing scale against technological precision. This analysis will clarify which model delivers superior risk-adjusted returns, guiding investors seeking resilient exposure in the complex semiconductor ecosystem.
Table of contents
Companies Overview
Taiwan Semiconductor Manufacturing Company Limited and Teradyne, Inc. both serve critical roles in the semiconductor technology ecosystem.
Taiwan Semiconductor Manufacturing Company Limited: Industry-Leading Chip Foundry
Taiwan Semiconductor Manufacturing Company Limited dominates as the world’s largest semiconductor foundry. It generates revenue by manufacturing and testing integrated circuits globally, serving sectors like high-performance computing and smartphones. In 2026, its strategic focus lies in advancing wafer fabrication technologies and expanding customer engineering support to sustain its competitive edge.
Teradyne, Inc.: Automated Test Equipment Specialist
Teradyne, Inc. leads in automatic test equipment for semiconductors and industrial automation. It profits by selling sophisticated test systems for semiconductor wafers, devices, and wireless products. Its 2026 strategy emphasizes scaling system test capabilities, industrial robotics, and wireless test solutions to address growing demand across automotive, communications, and IoT markets.
Strategic Collision: Similarities & Divergences
Both companies operate within the semiconductor industry but differ sharply in approach. Taiwan Semiconductor embraces a fabrication-centric model, while Teradyne focuses on testing and automation solutions. They compete indirectly yet critically across semiconductor supply chains. Taiwan Semiconductor offers scale and technology leadership; Teradyne provides precision testing and automation innovation. Their distinct roles define unique risk and growth profiles for investors.
Income Statement Comparison
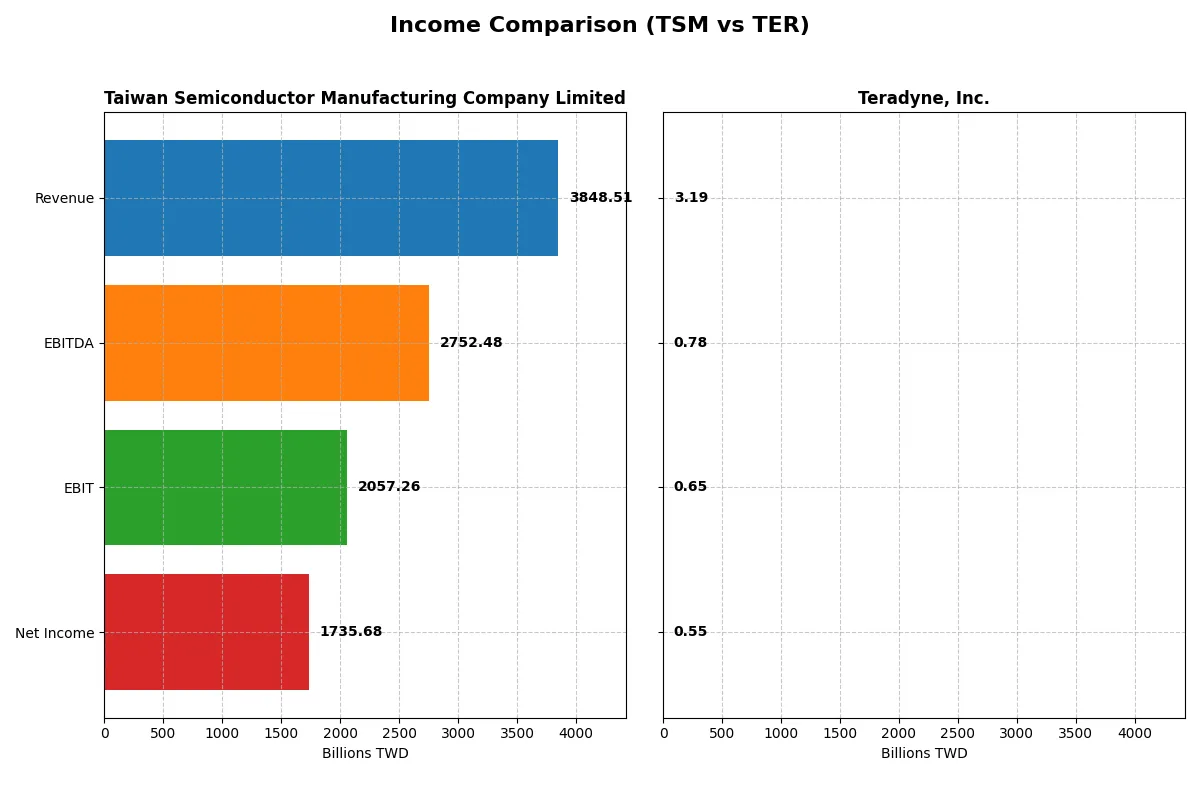
This data dissects the core profitability and scalability of both corporate engines to reveal who dominates the bottom line:
| Metric | Taiwan Semiconductor Manufacturing Company Limited (TSM) | Teradyne, Inc. (TER) |
|---|---|---|
| Revenue | 3.85T TWD | 3.19B USD |
| Cost of Revenue | 1.54T TWD | 1.32B USD |
| Operating Expenses | 349.2B TWD | 1.17B USD |
| Gross Profit | 2.30T TWD | 1.87B USD |
| EBITDA | 2.75T TWD | 780M USD |
| EBIT | 2.06T TWD | 653M USD |
| Interest Expense | 0 | 8.0M USD |
| Net Income | 1.74T TWD | 554M USD |
| EPS | 334.6 TWD | 3.49 USD |
| Fiscal Year | 2025 | 2025 |
Income Statement Analysis: The Bottom-Line Duel
This income statement comparison reveals how effectively each company converts sales into profits and manages operating costs.
Taiwan Semiconductor Manufacturing Company Limited Analysis
TSM’s revenue surged from 1.59T TWD in 2021 to 3.85T TWD in 2025, nearly doubling over five years. Net income expanded even faster, reaching 1.74T TWD in 2025. The company maintains robust gross margins near 60% and net margins above 45%, reflecting strong operational efficiency and scaling momentum in the latest fiscal year.
Teradyne, Inc. Analysis
Teradyne’s revenue declined from $3.7B in 2021 to $3.19B in 2025, with net income dropping to $554M. Despite a solid gross margin of 58.5%, its net margin stalled at 17.4%. Growth slowed, and net margin contracted over five years, signaling margin pressure and less pronounced operational leverage compared to the peer.
Verdict: Superior Scale and Margin Efficiency vs. Moderate Growth under Pressure
TSM decisively outperforms Teradyne in revenue expansion and margin improvement, showcasing a superior capacity to generate high returns on sales. Teradyne’s shrinking top line and lower net margins highlight challenges in sustaining profit growth. For investors, TSM’s profile offers stronger fundamentals and growth momentum.
Financial Ratios Comparison
These vital ratios act as a diagnostic tool to expose the underlying fiscal health, valuation premiums, and capital efficiency of these companies:
| Ratios | Taiwan Semiconductor Manufacturing Company Limited (TSM) | Teradyne, Inc. (TER) |
|---|---|---|
| ROE | 32.1% | 19.8% |
| ROIC | 24.9% | 18.4% |
| P/E | 28.5 | 54.6 |
| P/B | 9.14 | 10.8 |
| Current Ratio | 2.62 | 1.76 |
| Quick Ratio | 2.42 | 1.41 |
| D/E | 0.18 | 0.12 |
| Debt-to-Assets | 12.5% | 8.3% |
| Interest Coverage | 0 | 86.4 |
| Asset Turnover | 0.49 | 0.76 |
| Fixed Asset Turnover | 1.05 | 4.99 |
| Payout ratio | 27.2% | 13.8% |
| Dividend yield | 0.95% | 0.25% |
| Fiscal Year | 2025 | 2025 |
Efficiency & Valuation Duel: The Vital Signs
Financial ratios act as the company’s DNA, revealing hidden risks and operational excellence essential for discerning investors.
Taiwan Semiconductor Manufacturing Company Limited
Taiwan Semiconductor Manufacturing Company Limited (TSM) boasts a robust ROE of 32.12% and a strong net margin of 45.1%, demonstrating high profitability. However, its valuation appears stretched with a P/E of 28.45 and P/B of 9.14, signaling an expensive stock. The company returns value through modest dividends, complemented by strategic reinvestment in R&D to fuel growth.
Teradyne, Inc.
Teradyne, Inc. (TER) delivers solid profitability with a 19.82% ROE and a 17.37% net margin, reflecting operational efficiency. Its valuation is more stretched, sporting a high P/E of 54.64 and P/B of 10.83, indicating premium pricing. TER maintains shareholder returns primarily via reinvestment in innovation, as its dividend yield is low at 0.25%, emphasizing growth funding.
Balanced Profitability vs. Valuation Stretch
TSM offers superior profitability with a more balanced valuation despite some expensive metrics, while TER’s valuation is notably stretched relative to earnings. Investors prioritizing operational strength and moderate risk may prefer TSM, whereas those seeking growth exposure might consider TER’s innovation focus despite higher valuation risk.
Which one offers the Superior Shareholder Reward?
I see Taiwan Semiconductor Manufacturing Company Limited (TSM) delivers a more balanced and sustainable shareholder reward in 2026. TSM yields roughly 0.95% with a moderate 27% payout ratio, comfortably covered by free cash flow of 211 TWD/share. Its buyback intensity complements dividends, boosting total returns. Teradyne, Inc. (TER) pays a minimal 0.25% dividend, with a low 14% payout ratio, relying more on buybacks. However, TER’s high P/E of 55 and thin free cash flow coverage raise valuation risk. Historically in tech manufacturing, TSM’s blend of dividends and buybacks aligns better with long-term value creation than TER’s growth-focused distribution. I favor TSM for superior total return potential in 2026.
Comparative Score Analysis: The Strategic Profile
The radar chart reveals the fundamental DNA and trade-offs of Taiwan Semiconductor Manufacturing Company Limited and Teradyne, Inc.:
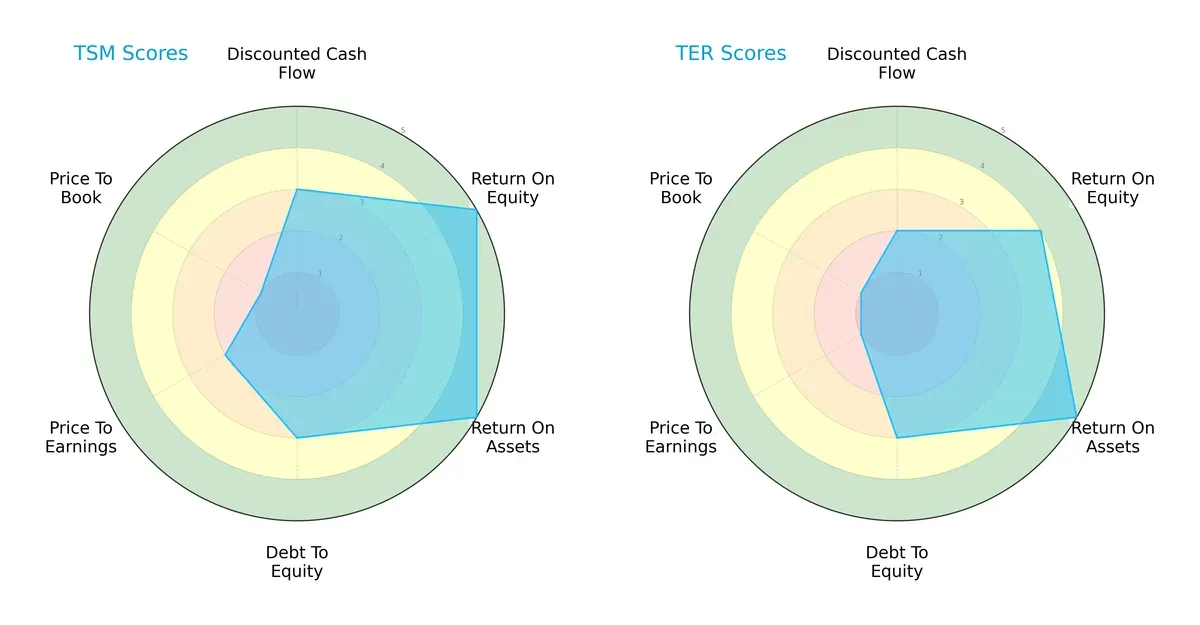
Taiwan Semiconductor shows superior profitability with very favorable ROE and ROA scores of 5 each, while Teradyne posts a slightly lower ROE at 4 but matches TSM’s ROA at 5. Both have moderate debt management (score 3), but TSM leads in discounted cash flow valuation (3 vs. 2). Teradyne’s valuation scores rank very unfavorable, indicating potential overvaluation risks. Overall, TSM presents a more balanced profile with strengths across profitability and valuation, whereas Teradyne leans heavily on operational efficiency but struggles with market pricing.
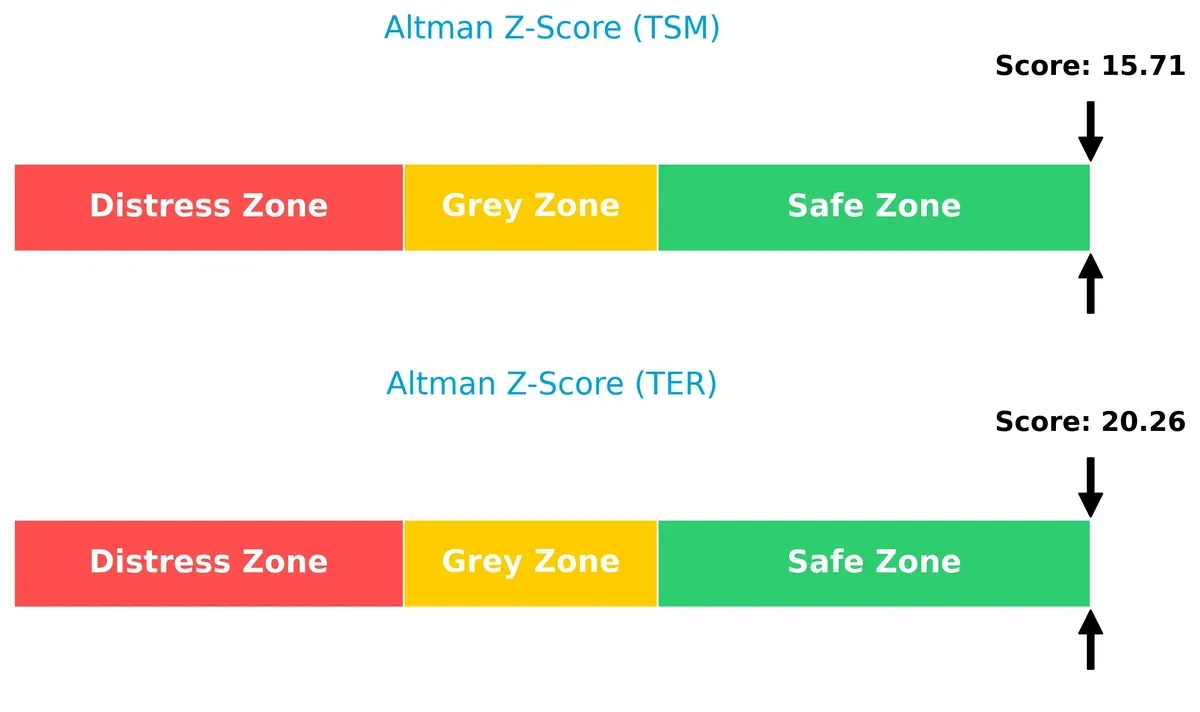
Bankruptcy Risk: Solvency Showdown
The Altman Z-Score comparison indicates both companies reside comfortably in the safe zone, with Teradyne (20.3) edging Taiwan Semiconductor (15.7), underscoring their robust solvency and low bankruptcy risk in the current economic cycle:
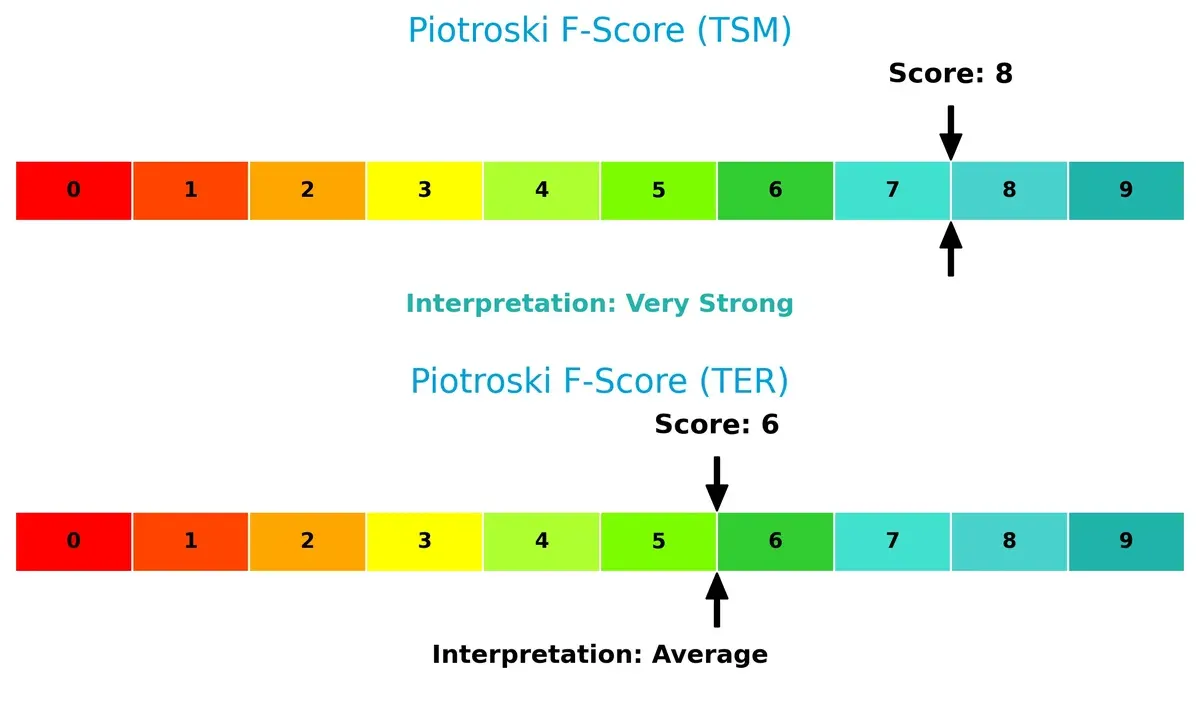
Financial Health: Quality of Operations
Taiwan Semiconductor’s Piotroski F-Score of 8 signals very strong financial health, outperforming Teradyne’s average score of 6. This suggests TSM maintains superior internal operations and fewer red flags, offering investors greater confidence in its financial stability:
How are the two companies positioned?
This section dissects the operational DNA of TSM and TER by comparing their revenue distribution by segment and internal strengths and weaknesses. The goal is to confront their economic moats to identify which business model delivers the most resilient, sustainable competitive advantage today.
Revenue Segmentation: The Strategic Mix
This visual comparison dissects how Taiwan Semiconductor Manufacturing Company Limited and Teradyne, Inc. diversify their income streams and where their primary sector bets lie:
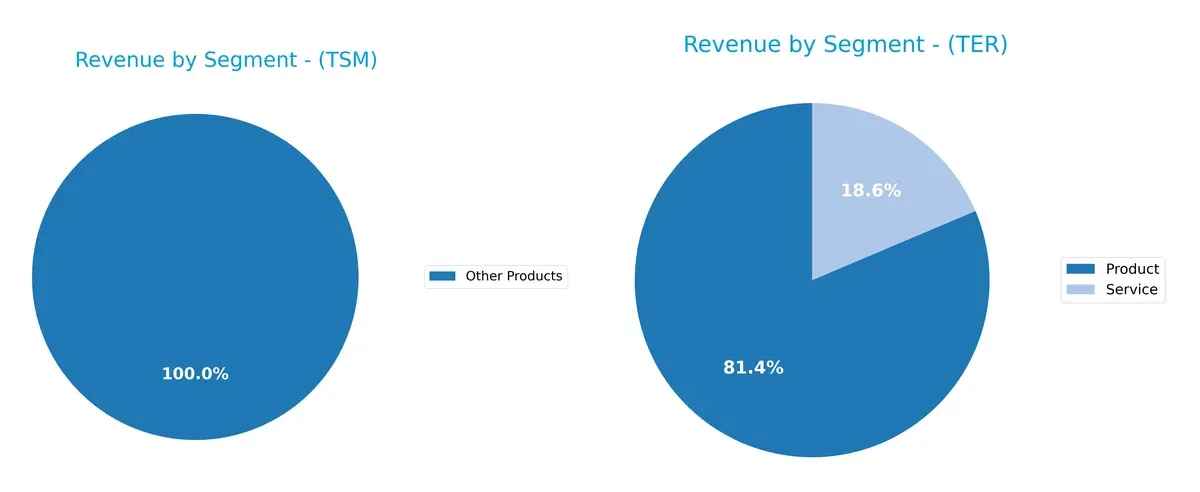
Taiwan Semiconductor Manufacturing Company Limited anchors its revenue in wafer sales, with 1.99T TWD in 2022, dwarfing its 272B TWD in other products. Teradyne, Inc. shows a more balanced mix, with $2.29B from product sales and $525M from services in 2024. TSM’s wafer dominance suggests infrastructure lock-in but exposes it to concentration risk. Teradyne’s split indicates strategic diversification, reducing vulnerability to any single segment’s downturn.
Strengths and Weaknesses Comparison
This table compares the strengths and weaknesses of Taiwan Semiconductor Manufacturing Company (TSM) and Teradyne, Inc. (TER):
TSM Strengths
- High net margin of 45.1%
- Strong ROE at 32.12%
- Favorable current and quick ratios above 2.4
- Low debt-to-assets ratio at 12.52%
- Large global revenue base including US, China, Taiwan
- Leading wafer manufacturing market share
TER Strengths
- Favorable net margin of 17.37%
- ROE and ROIC above 18% indicate solid profitability
- Strong interest coverage of 81.43
- High fixed asset turnover at 4.99
- Diversified product and service revenue streams
- Presence across multiple regions including US and Asia
TSM Weaknesses
- Unfavorable P/E at 28.45 and high P/B at 9.14 indicate expensive valuation
- Asset turnover low at 0.49 suggests underutilization
- Dividend yield low at 0.95%
- WACC neutral but less favorable than ROIC
- Concentrated product focus mainly on wafers
TER Weaknesses
- Unfavorable WACC at 12.35% above ROIC
- High P/E of 54.64 and P/B of 10.83 reflect overvaluation concerns
- Dividend yield very low at 0.25%
- Moderate current and quick ratios indicate less liquidity cushion
- Asset turnover neutral at 0.76
TSM exhibits robust profitability with strong liquidity and a dominant market share in wafer manufacturing, but its valuation and asset efficiency raise caution. TER shows solid profitability and asset utilization with broad geographic diversification, yet it faces valuation and capital cost challenges. Both companies demonstrate strengths that can support strategic growth but also bear risks requiring prudent financial management.
The Moat Duel: Analyzing Competitive Defensibility
A durable structural moat shields long-term profits from relentless competition and market pressures. Here’s how Taiwan Semiconductor Manufacturing Company and Teradyne defend their turf:
Taiwan Semiconductor Manufacturing Company Limited: Industry-Leading Cost Advantage
TSMC’s moat stems from unmatched scale and cutting-edge process technology. It sustains superior 53% EBIT margins and a rising ROIC +15% above WACC. Expansion into advanced nodes in 2026 should deepen this cost and technological edge.
Teradyne, Inc.: Specialized Test Equipment Niche
Teradyne relies on product specialization and customer relationships in semiconductor and industrial automation testing. Its moat is narrower, reflected in a modest 20% EBIT margin and declining ROIC. However, automation growth offers moderate upside potential.
Cost Leadership vs. Niche Specialization
TSMC’s wider moat outclasses Teradyne’s narrower niche. TSMC’s growing ROIC and margin dominance position it better to defend and expand market share in 2026. Teradyne faces pressure to reverse profitability decline to sustain its competitive position.
Which stock offers better returns?
Over the past year, Taiwan Semiconductor and Teradyne displayed strong bullish momentum with accelerating trends and notable price gains, reflecting dynamic trading activity and shifting buyer-seller dominance.
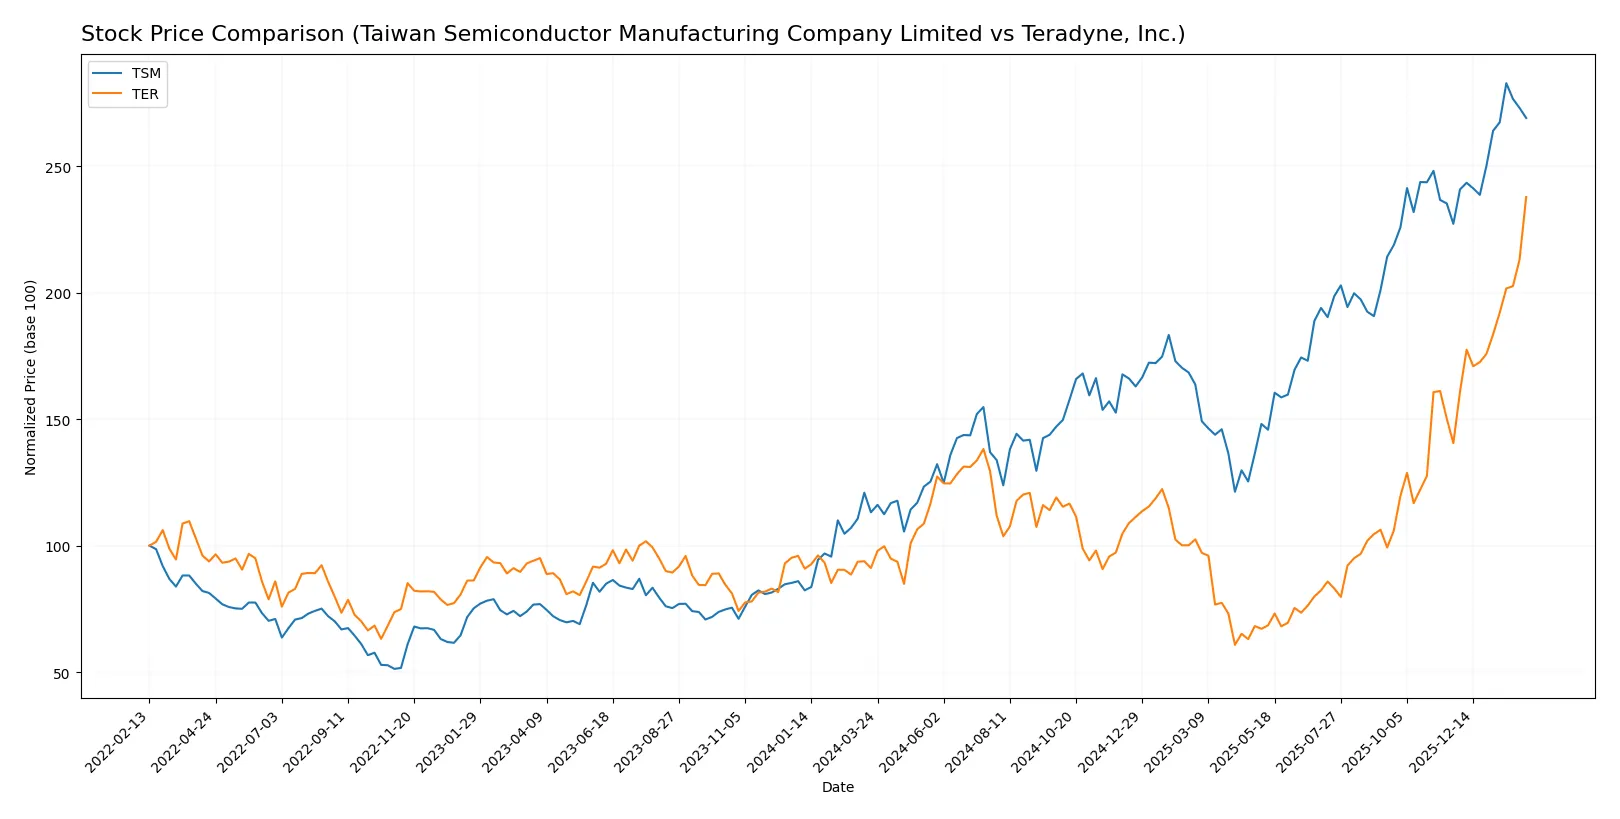
Trend Comparison
Taiwan Semiconductor’s stock rose 138% over 12 months, showing acceleration and a high volatility level with prices ranging from 128 to 342. The recent 18% gain suggests decelerating momentum.
Teradyne’s stock surged 161% in the same period, also accelerating but with lower overall volatility and a wider price range from 69 to 269. Recent gains accelerated further by 69%.
Teradyne outperformed Taiwan Semiconductor in total price appreciation and recent momentum, delivering the highest market performance over the past year.
Target Prices
The consensus analyst targets indicate upside potential for both Taiwan Semiconductor Manufacturing Company Limited and Teradyne, Inc.
| Company | Target Low | Target High | Consensus |
|---|---|---|---|
| Taiwan Semiconductor Manufacturing Company Limited | 330 | 450 | 397.5 |
| Teradyne, Inc. | 175 | 335 | 276.08 |
Analysts expect TSM’s shares to rise roughly 22% from the current 326 USD level, signaling confidence in its market moat. TER’s target consensus suggests a 3% upside, reflecting cautious optimism amid semiconductor sector volatility.

Don’t Let Luck Decide Your Entry Point
Optimize your entry points with our advanced ProRealTime indicators. You’ll get efficient buy signals with precise price targets for maximum performance. Start outperforming now!
How do institutions grade them?
The following sections summarize recent institutional grades for Taiwan Semiconductor Manufacturing Company Limited and Teradyne, Inc.:
Taiwan Semiconductor Manufacturing Company Limited Grades
This table shows recent grades from major financial institutions for TSM:
| Grading Company | Action | New Grade | Date |
|---|---|---|---|
| TD Cowen | Maintain | Hold | 2026-01-16 |
| Barclays | Maintain | Overweight | 2026-01-16 |
| Needham | Maintain | Buy | 2026-01-15 |
| Bernstein | Maintain | Outperform | 2025-12-08 |
| Needham | Maintain | Buy | 2025-10-27 |
| Barclays | Maintain | Overweight | 2025-10-17 |
| Needham | Maintain | Buy | 2025-10-16 |
| Susquehanna | Maintain | Positive | 2025-10-10 |
| Barclays | Maintain | Overweight | 2025-10-09 |
| Barclays | Maintain | Overweight | 2025-09-16 |
Teradyne, Inc. Grades
This table shows recent grades from major financial institutions for TER:
| Grading Company | Action | New Grade | Date |
|---|---|---|---|
| Cantor Fitzgerald | Maintain | Overweight | 2026-02-04 |
| Goldman Sachs | Maintain | Buy | 2026-02-04 |
| Stifel | Maintain | Buy | 2026-02-04 |
| Evercore ISI Group | Maintain | Outperform | 2026-02-04 |
| Citigroup | Maintain | Buy | 2026-02-04 |
| Evercore ISI Group | Maintain | Outperform | 2026-02-03 |
| Cantor Fitzgerald | Maintain | Overweight | 2026-02-02 |
| Stifel | Maintain | Buy | 2026-01-30 |
| UBS | Maintain | Buy | 2026-01-26 |
| B of A Securities | Maintain | Buy | 2026-01-22 |
Which company has the best grades?
Teradyne consistently receives “Buy” and “Outperform” ratings, slightly outperforming Taiwan Semiconductor’s mix of “Buy,” “Overweight,” and “Hold” grades. This suggests stronger institutional confidence in Teradyne’s near-term growth prospects, potentially influencing investor sentiment.
Risks specific to each company
The following categories identify the critical pressure points and systemic threats facing both firms in the 2026 market environment:
1. Market & Competition
Taiwan Semiconductor Manufacturing Company Limited
- Dominates semiconductor foundry market but faces intensifying rivalry from emerging Asian rivals.
Teradyne, Inc.
- Competes in diverse test equipment markets; exposed to cyclical demand and evolving tech standards.
2. Capital Structure & Debt
Taiwan Semiconductor Manufacturing Company Limited
- Maintains low debt-to-equity (0.18) and strong interest coverage, indicating conservative leverage.
Teradyne, Inc.
- Even lower debt-to-equity (0.12) with robust interest coverage (~81x), signaling solid balance sheet.
3. Stock Volatility
Taiwan Semiconductor Manufacturing Company Limited
- Beta of 1.27 suggests moderate market sensitivity, typical for tech sector leaders.
Teradyne, Inc.
- Higher beta of 1.82 reflects greater stock price swings and investor sentiment risk.
4. Regulatory & Legal
Taiwan Semiconductor Manufacturing Company Limited
- Faces geopolitical regulatory risk due to Taiwan’s sensitive geopolitical status.
Teradyne, Inc.
- Subject to US regulatory scrutiny but benefits from stable domestic environment.
5. Supply Chain & Operations
Taiwan Semiconductor Manufacturing Company Limited
- Highly exposed to global semiconductor supply chain disruptions and raw material price volatility.
Teradyne, Inc.
- Relies on complex global supply chains for test equipment components, vulnerable to logistics bottlenecks.
6. ESG & Climate Transition
Taiwan Semiconductor Manufacturing Company Limited
- Increasing pressure to reduce carbon footprint in energy-intensive chip manufacturing processes.
Teradyne, Inc.
- Faces growing demands for sustainable manufacturing and robotic automation energy efficiency.
7. Geopolitical Exposure
Taiwan Semiconductor Manufacturing Company Limited
- Significant geopolitical risk from cross-strait tensions impacting operations and investor confidence.
Teradyne, Inc.
- Limited direct geopolitical risk; more insulated due to US-based operations.
Which company shows a better risk-adjusted profile?
Teradyne’s stronger balance sheet and lower geopolitical risk contrast with Taiwan Semiconductor’s dominant market position but higher external vulnerabilities. Taiwan Semiconductor’s biggest risk is geopolitical exposure, which could disrupt supply chains and investor trust abruptly. Teradyne must navigate higher stock volatility and a demanding competitive landscape in multiple segments. Overall, Teradyne presents a more balanced risk-adjusted profile, supported by its robust liquidity and safer geopolitical positioning. Notably, Taiwan Semiconductor’s recent share price drop despite strong fundamentals signals market caution over geopolitical uncertainties.
Final Verdict: Which stock to choose?
Taiwan Semiconductor Manufacturing Company Limited (TSM) wields unmatched operational efficiency and a robust economic moat, evidenced by a sustained and growing ROIC well above its WACC. Its strength lies in value creation and resilience. A point of vigilance is its elevated valuation metrics, which could temper near-term upside. This stock suits aggressive growth portfolios willing to pay for quality and durability.
Teradyne, Inc. (TER) offers a strategic moat through specialized automation technology and steady recurring revenue streams. It demonstrates solid financial health and lower leverage, presenting a comparatively safer profile than TSM. However, its declining ROIC trend signals caution on profitability sustainability. TER fits well into GARP (Growth at a Reasonable Price) portfolios seeking balanced risk and moderate growth.
If you prioritize long-term value creation with high operational efficiency, TSM outshines due to its superior profitability and sustainable competitive advantage. However, if you seek better stability with a strategic niche and less valuation premium, TER offers a compelling option despite its challenged profitability trend. Each appeals to distinct investor profiles with differing appetites for growth and risk.
Disclaimer: Investment carries a risk of loss of initial capital. The past performance is not a reliable indicator of future results. Be sure to understand risks before making an investment decision.
Go Further
I encourage you to read the complete analyses of Taiwan Semiconductor Manufacturing Company Limited and Teradyne, Inc. to enhance your investment decisions: