Home > Comparison > Technology > TSM vs MU
The strategic rivalry between Taiwan Semiconductor Manufacturing Company Limited and Micron Technology, Inc. defines the current trajectory of the semiconductor industry. TSMC operates as a capital-intensive contract manufacturer specializing in advanced wafer fabrication, while Micron focuses on high-margin memory and storage solutions. This head-to-head frames a battle between manufacturing scale and product specialization. This analysis will assess which company’s strategic model delivers the superior risk-adjusted return for a diversified technology portfolio.
Table of contents
Companies Overview
Taiwan Semiconductor Manufacturing Company Limited and Micron Technology, Inc. command pivotal roles in the global semiconductor industry.
Taiwan Semiconductor Manufacturing Company Limited: The Foundry Powerhouse
Taiwan Semiconductor dominates as the world’s leading pure-play semiconductor foundry. Its core revenue derives from wafer fabrication for integrated circuits across diverse applications such as high-performance computing and smartphones. In 2026, TSM focuses strategically on advancing cutting-edge manufacturing processes, reinforcing its technological moat in CMOS and mixed-signal chip production.
Micron Technology, Inc.: Memory and Storage Innovator
Micron Technology is a key player in memory and storage solutions, specializing in DRAM and NAND products. It generates revenue by designing and selling high-speed semiconductor memory for cloud servers, mobile devices, and automotive markets. Micron’s 2026 strategy centers on expanding its embedded and storage product portfolios to capture growth in enterprise and consumer segments.
Strategic Collision: Similarities & Divergences
Both companies excel in semiconductors but diverge sharply in their business models: TSM offers an open foundry platform serving diverse chip designers, while Micron maintains a focused product line with proprietary memory technology. They compete primarily in the advanced semiconductor segment, where fabrication excellence and innovation drive market share. Their distinct investment profiles reflect TSM’s capital-intensive manufacturing scale and Micron’s innovation-led product specialization.
Income Statement Comparison
This data dissects the core profitability and scalability of both corporate engines to reveal who dominates the bottom line:
| Metric | Taiwan Semiconductor Manufacturing Company Limited (TSM) | Micron Technology, Inc. (MU) |
|---|---|---|
| Revenue | 3.85T TWD | 37.4B USD |
| Cost of Revenue | 1.54T TWD | 22.5B USD |
| Operating Expenses | 349.2B TWD | 5.00B USD |
| Gross Profit | 2.30T TWD | 14.9B USD |
| EBITDA | 2.75T TWD | 18.5B USD |
| EBIT | 2.06T TWD | 10.1B USD |
| Interest Expense | 0 TWD | 477M USD |
| Net Income | 1.74T TWD | 8.54B USD |
| EPS | 334.6 TWD | 7.65 USD |
| Fiscal Year | 2025 | 2025 |
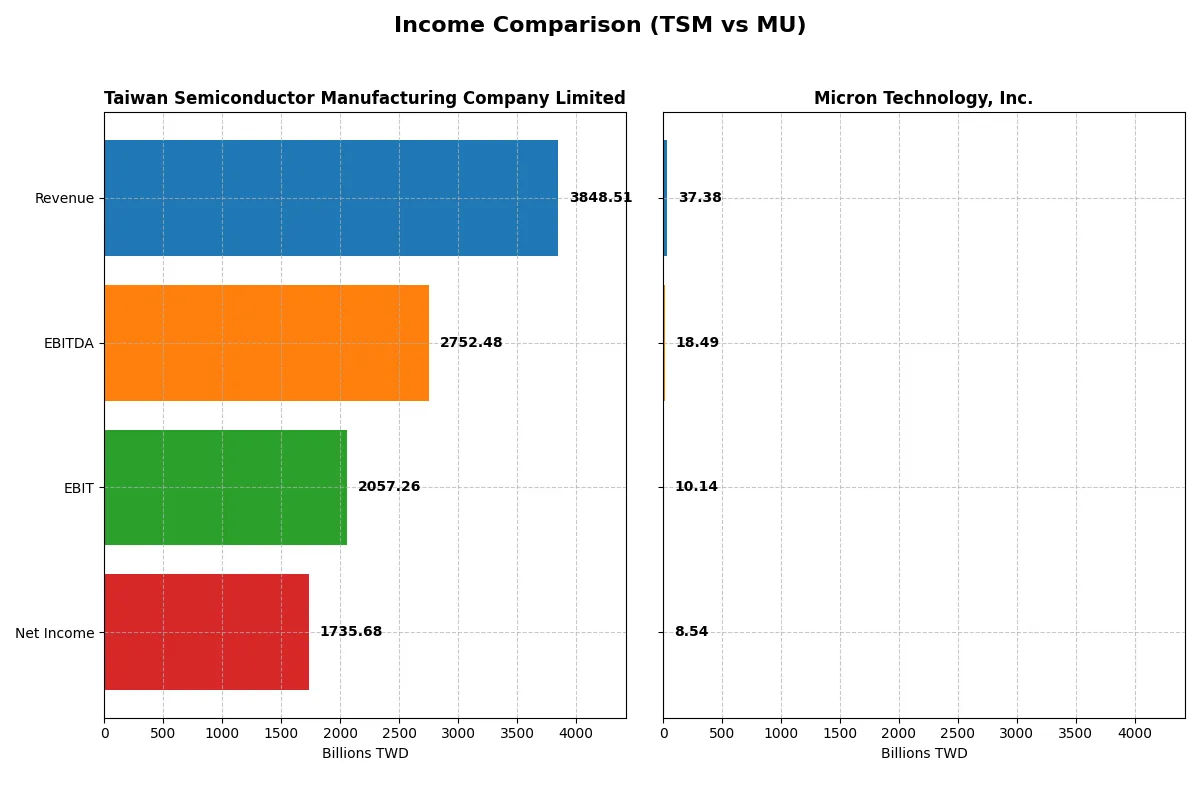
Income Statement Analysis: The Bottom-Line Duel
This income statement comparison reveals which company operates with greater efficiency and superior profit conversion in a competitive semiconductor market.
Taiwan Semiconductor Manufacturing Company Limited Analysis
TSM’s revenue surged from 1.59T TWD in 2021 to 3.85T TWD in 2025, with net income climbing 193% over five years to 1.74T TWD. Its gross margin remains robust near 60%, while net margin holds a strong 45%. The 2025 figures showcase exceptional operational leverage and margin expansion, reflecting disciplined cost control and innovation-driven growth.
Micron Technology, Inc. Analysis
MU’s revenue grew from $27.7B in 2021 to $37.4B in 2025, while net income rose 46% to $8.5B. Although margins are slimmer—with gross margin under 40% and net margin near 23%—MU posted a remarkable rebound from a net loss in 2023 to strong profitability in 2025. This reflects improving cost efficiency and rapid margin recovery, yet still trails TSM’s profitability levels.
Margin Dominance vs. Turnaround Momentum
TSM clearly outperforms MU in scale and profitability, boasting near double the net margin and a far higher absolute net income. TSM’s consistent margin expansion and strong revenue growth indicate a durable competitive moat. MU, while showing impressive recent recovery and growth rates, operates with thinner margins and lower overall profitability. Investors favoring steady margin power will gravitate toward TSM’s profile.
Financial Ratios Comparison
These vital ratios act as a diagnostic tool to expose the underlying fiscal health, valuation premiums, and capital efficiency of the companies compared below:
| Ratios | Taiwan Semiconductor Manufacturing Company Limited (TSM) | Micron Technology, Inc. (MU) |
|---|---|---|
| ROE | 32.1% | 15.8% |
| ROIC | 24.9% | 12.1% |
| P/E | 28.5 | 15.9 |
| P/B | 9.14 | 2.51 |
| Current Ratio | 2.62 | 2.52 |
| Quick Ratio | 2.42 | 1.79 |
| D/E | 0.18 | 0.28 |
| Debt-to-Assets | 12.5% | 18.5% |
| Interest Coverage | 0 (no data reported) | 20.7 |
| Asset Turnover | 0.49 | 0.45 |
| Fixed Asset Turnover | 1.05 | 0.79 |
| Payout ratio | 27.2% | 6.1% |
| Dividend yield | 0.95% | 0.38% |
| Fiscal Year | 2025 | 2025 |
Efficiency & Valuation Duel: The Vital Signs
Financial ratios act as the company’s DNA, revealing hidden risks and operational excellence that shape investment decisions.
Taiwan Semiconductor Manufacturing Company Limited
TSMC displays robust profitability with a 32.12% ROE and a commanding 45.1% net margin, signaling operational strength. Its valuation appears stretched with a P/E of 28.45 and P/B of 9.14, above typical sector norms. The firm maintains shareholder value through stable dividends, despite a modest 0.95% yield, balancing reinvestment in R&D.
Micron Technology, Inc.
Micron posts a solid 15.76% ROE and a 22.84% net margin, indicating healthy profitability but less dominance than TSMC. Its valuation is more reasonable, with a P/E of 15.94 and P/B of 2.51, closer to industry averages. Micron’s dividend yield is low at 0.38%, reflecting a cautious shareholder return amid less favorable capital cost metrics.
Premium Valuation vs. Operational Safety
TSMC commands a premium valuation justified by superior profitability and capital efficiency, though it carries valuation risk. Micron offers a more moderate entry point with decent profitability but faces challenges in capital cost management. Investors preferring growth and operational strength may lean toward TSMC, while those valuing valuation discipline may find Micron’s profile more fitting.
Which one offers the Superior Shareholder Reward?
I compare Taiwan Semiconductor Manufacturing Company (TSM) and Micron Technology (MU) focusing on dividends, payout ratios, and buybacks. TSM yields ~0.96% with a 27% payout, supported by robust FCF of 211TWD/share. MU yields a scant 0.38% with a 6% payout, reflecting restrained cash returns. TSM’s consistent buyback intensity complements dividends, enhancing total return. MU’s free cash flow is minimal (~1.5USD/share), limiting buybacks and dividends, signaling reinvestment or caution. TSM’s distribution balances yield and sustainability, backed by solid margins and cash ratios. MU’s model shows weaker cash return and riskier coverage. I find TSM offers a more compelling, sustainable total shareholder reward in 2026.
Comparative Score Analysis: The Strategic Profile
The radar chart reveals the fundamental DNA and trade-offs of Taiwan Semiconductor Manufacturing Company Limited and Micron Technology, Inc.:
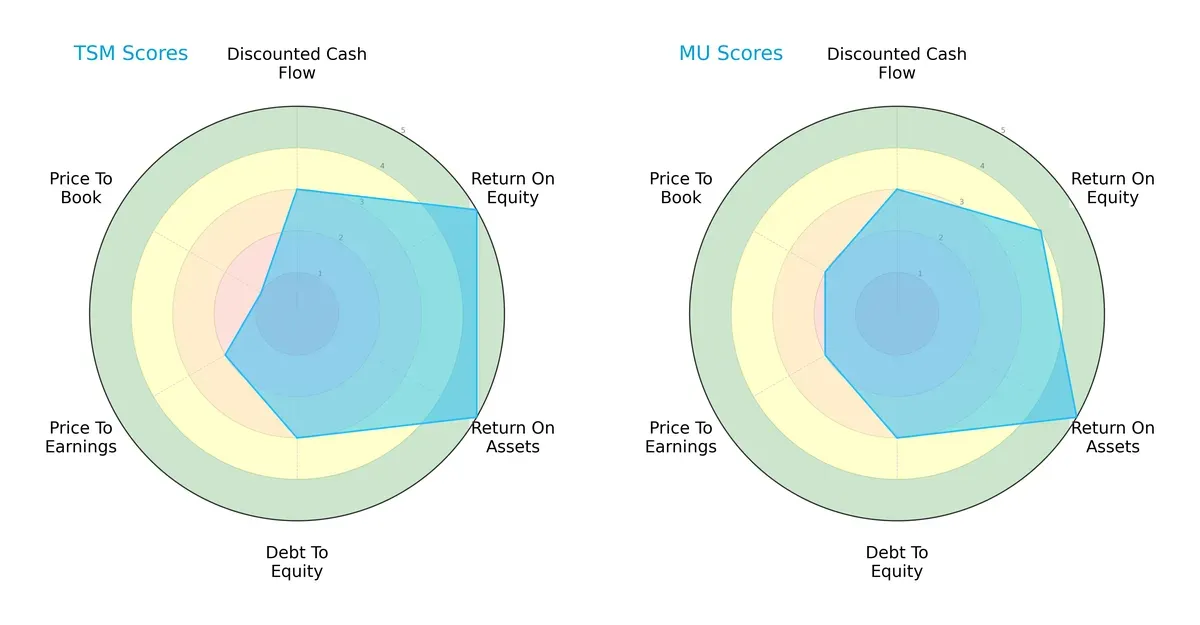
Taiwan Semiconductor leads with a superior ROE score of 5 versus Micron’s 4, showing stronger equity efficiency. Both share a perfect ROA score of 5, reflecting effective asset use. Debt-to-equity is moderate at 3 for both, indicating balanced leverage. Valuation metrics favor Micron slightly, with a better Price-to-Book score (2 vs. 1), suggesting TSM faces valuation challenges. Overall, TSM’s profile is more concentrated on profitability, while Micron offers a more balanced valuation approach.
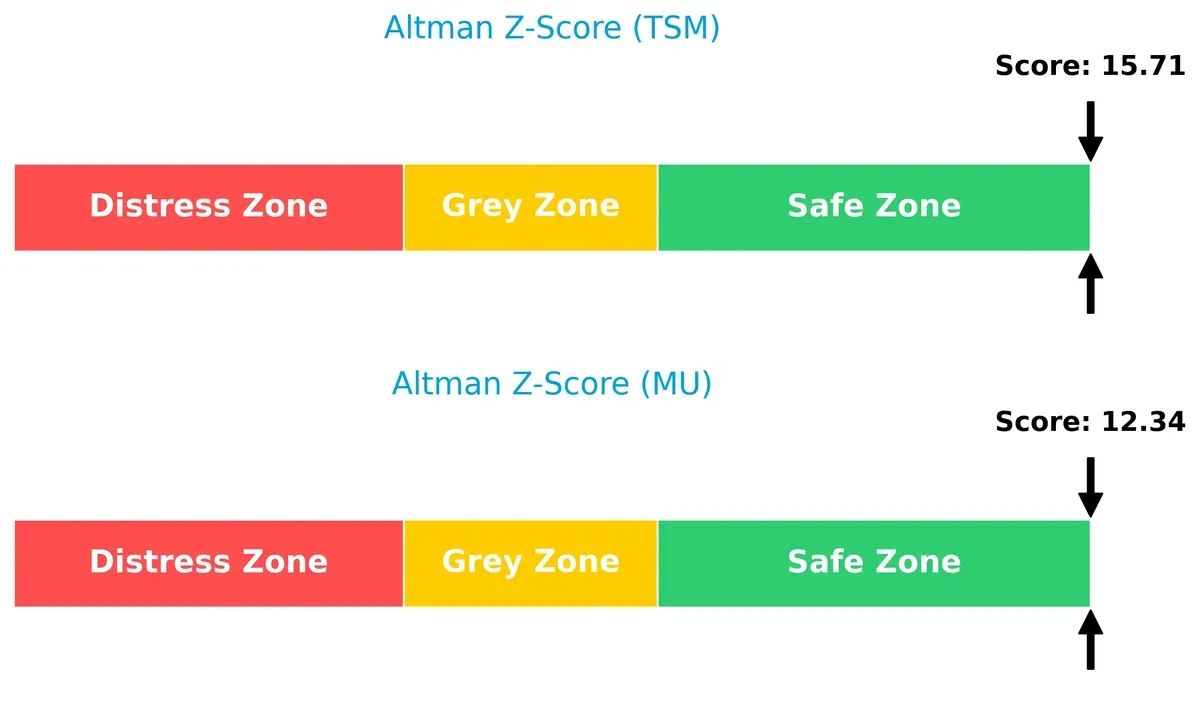
Bankruptcy Risk: Solvency Showdown
TSM’s Altman Z-Score of 15.7 significantly outpaces Micron’s 12.3, signaling a stronger solvency buffer and lower bankruptcy risk in this economic cycle:
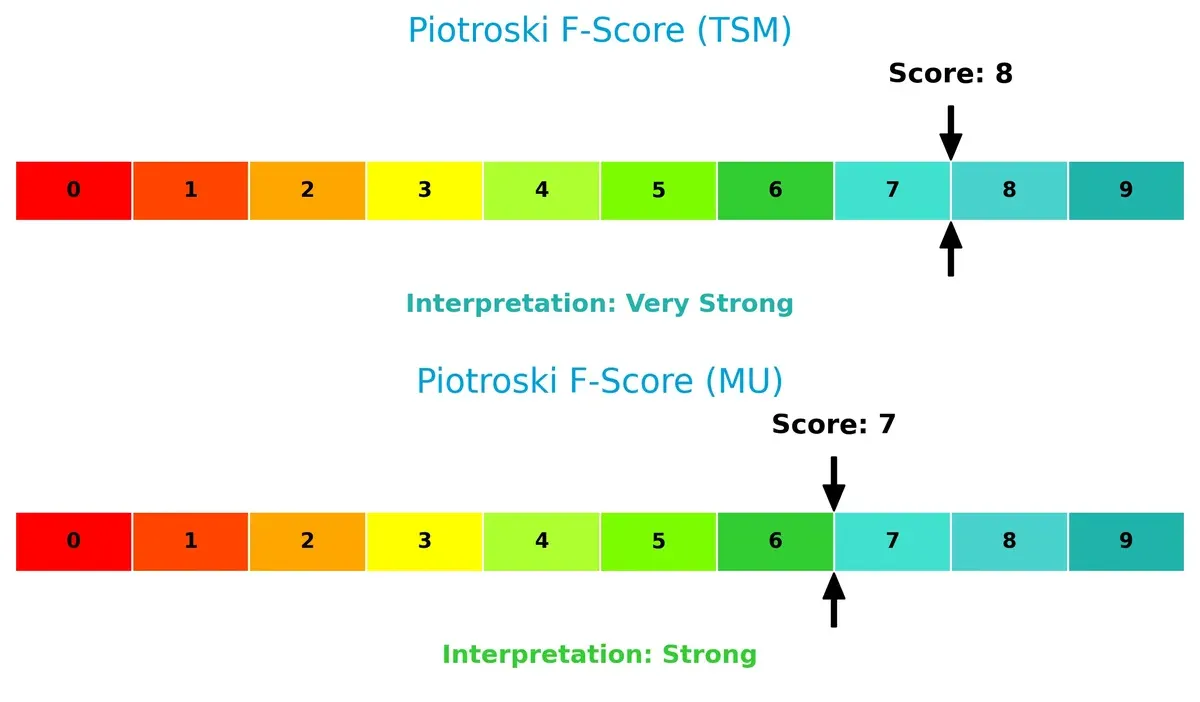
Financial Health: Quality of Operations
TSM’s Piotroski F-Score of 8 edges out Micron’s 7, indicating superior operational quality and fewer financial red flags. Both companies demonstrate strong internal financial health:
How are the two companies positioned?
This section dissects the operational DNA of TSM and MU by comparing their revenue distribution and internal dynamics. The objective is to confront their economic moats and reveal which model offers the most resilient, sustainable competitive advantage today.
Revenue Segmentation: The Strategic Mix
The following visual comparison dissects how Taiwan Semiconductor Manufacturing Company Limited and Micron Technology, Inc. diversify their income streams and where their primary sector bets lie:
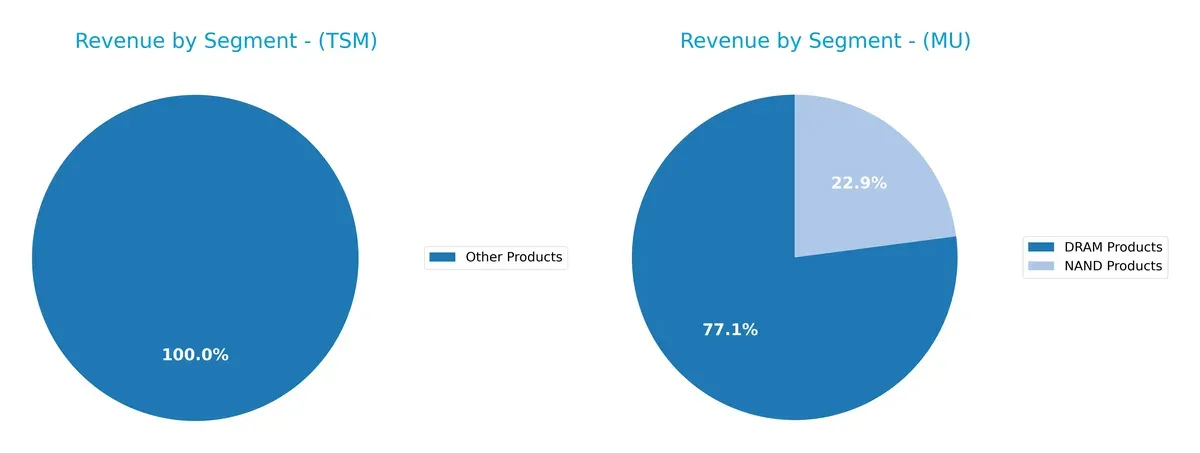
TSM anchors its revenue heavily in wafer sales, generating over 1.9T TWD in 2022, with a smaller contribution from other products around 272B TWD. This concentration signals dominance in semiconductor manufacturing infrastructure. MU shows a more diversified profile with DRAM products at $22.4B and NAND products at $7.8B in 2022, reflecting a broader memory product mix but exposing it to end-market cyclicality. TSM’s focus limits diversification risk but increases dependency on wafer demand.
Strengths and Weaknesses Comparison
This table compares the Strengths and Weaknesses of Taiwan Semiconductor Manufacturing Company Limited (TSM) and Micron Technology, Inc. (MU):
TSM Strengths
- High net margin (45.1%) and ROE (32.12%) indicate strong profitability
- Favorable leverage ratios with low debt-to-assets (12.52%)
- Robust liquidity shown by current ratio (2.62) and quick ratio (2.42)
- Diverse global revenue base including US, China, Taiwan, Japan
- Leading wafer manufacturing with substantial market share
- Strong ROIC (24.92%) well above WACC (9.73%), signaling efficient capital use
MU Strengths
- Solid net margin (22.84%) and positive ROE (15.76%) reflect good profitability
- Favorable current (2.52) and quick (1.79) ratios demonstrate liquidity
- Global presence across US, China, Taiwan, Japan, Europe with diversified product segments
- Moderate leverage with debt-to-assets at 18.45% and interest coverage of 21.26
- Reasonable PE (15.94) and PB (2.51) ratios suggest valuation appeal
TSM Weaknesses
- High PE (28.45) and PB (9.14) ratios could imply overvaluation risk
- Asset turnover (0.49) below ideal, indicating less efficient asset use
- Dividend yield low at 0.95%, limiting income appeal
- Fixed asset turnover only neutral (1.05)
MU Weaknesses
- ROIC (12.12%) below WACC (22.1%) signals potential value destruction
- Unfavorable fixed asset turnover (0.79) and asset turnover (0.45) ratios
- Lower dividend yield (0.38%) reduces income attractiveness
- Elevated WACC (22.1%) increases capital cost burden
Overall, TSM demonstrates superior profitability and capital efficiency supported by a strong global footprint, though valuation metrics raise caution. MU shows balanced liquidity and global diversification but faces challenges in capital returns and higher financing costs. These factors are critical for each company’s strategic financial management and market positioning.
The Moat Duel: Analyzing Competitive Defensibility
A structural moat is the only reliable shield protecting a company’s long-term profits from relentless competitive erosion:
Taiwan Semiconductor Manufacturing Company Limited: Capital Efficiency Moat
TSMC’s moat stems from superior capital allocation and advanced manufacturing scale. It delivers a 15% ROIC premium over WACC and margin stability. New process nodes in 2026 could deepen this advantage.
Micron Technology, Inc.: Innovation-Driven Cost Moat
Micron’s moat relies on cost advantages through memory tech innovation, unlike TSMC’s scale. Its ROIC lags WACC, signaling value erosion despite improving profitability. Growth in AI memory markets offers upside.
Capital Efficiency vs. Innovation Cost Control
TSMC’s wider moat emerges from durable capital returns far exceeding cost of capital, while Micron struggles with value destruction. TSMC stands better equipped to defend and expand market share in 2026.
Which stock offers better returns?
The past year shows strong upward momentum in both stocks, with Micron surging sharply and Taiwan Semiconductor gaining steadily amid shifting buyer dynamics.
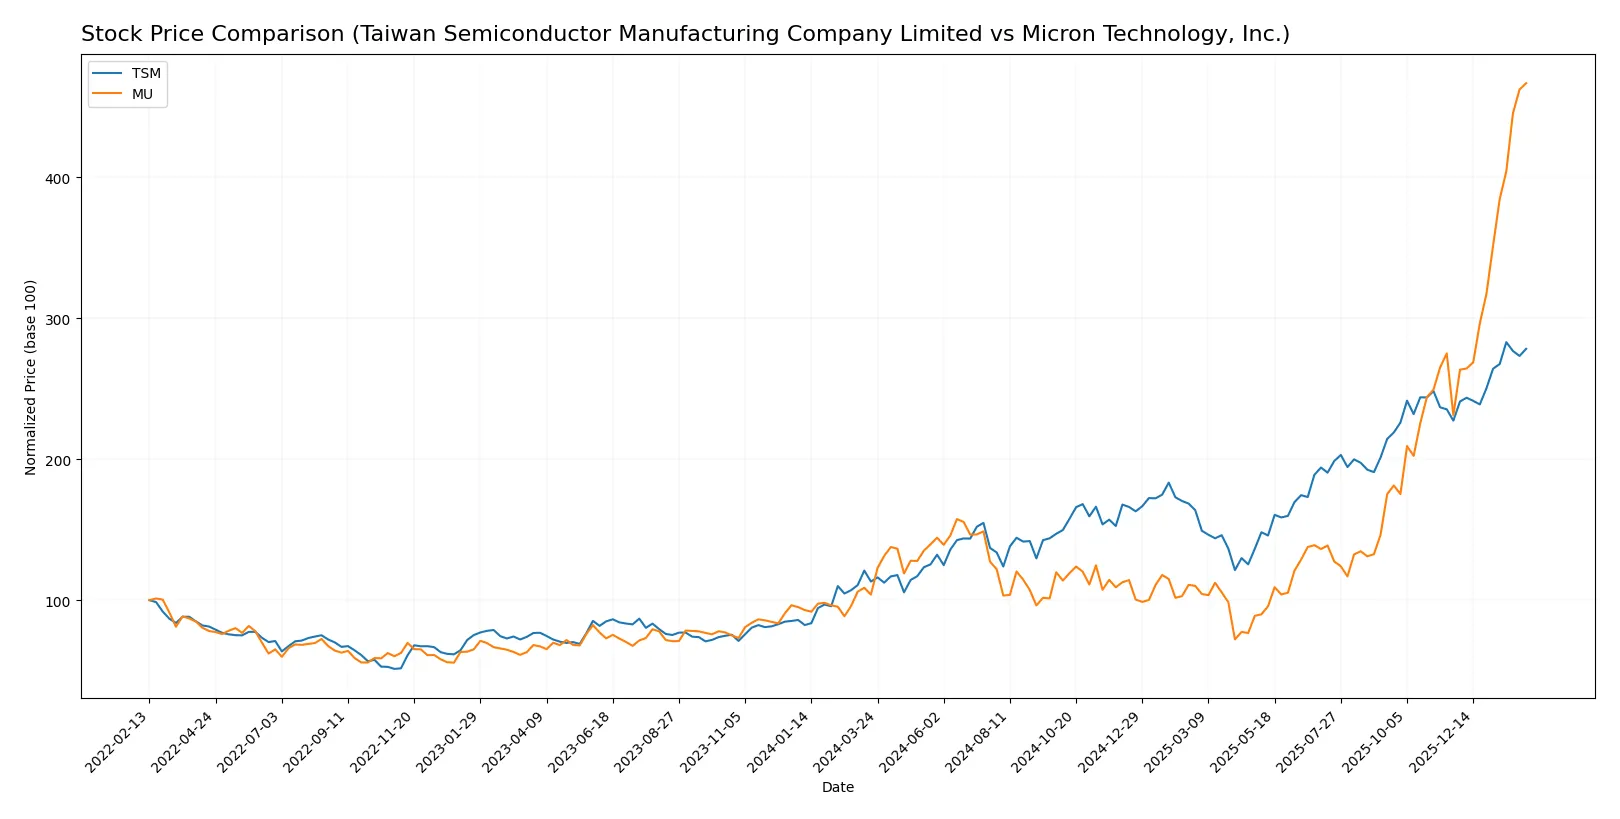
Trend Comparison
Taiwan Semiconductor’s stock rose 146% over the past year, marking a bullish trend with accelerating gains and a high volatility of 54.73. The price ranged from 127.7 to 342.4.
Micron’s stock climbed 349% over the same period, also bullish with acceleration and higher volatility at 75.35. It reached a low of 64.72 and a high of 418.87.
Micron outperformed Taiwan Semiconductor significantly, delivering the highest market returns with stronger recent price growth and more pronounced buyer dominance.
Target Prices
Analysts present a mixed but optimistic target price consensus for these semiconductor giants.
| Company | Target Low | Target High | Consensus |
|---|---|---|---|
| Taiwan Semiconductor Manufacturing Company Limited | 330 | 450 | 397.5 |
| Micron Technology, Inc. | 190 | 480 | 345.61 |
Taiwan Semiconductor’s consensus target sits about 18% above its current 336 price, signaling moderate upside. Micron’s target consensus is roughly 17% below its current 418 price, indicating expected price normalization or downside risk.

Don’t Let Luck Decide Your Entry Point
Optimize your entry points with our advanced ProRealTime indicators. You’ll get efficient buy signals with precise price targets for maximum performance. Start outperforming now!
How do institutions grade them?
Here is a summary of institutional grades assigned to Taiwan Semiconductor Manufacturing Company Limited and Micron Technology, Inc.:
Taiwan Semiconductor Manufacturing Company Limited Grades
Below are recent grades from recognized financial institutions for Taiwan Semiconductor Manufacturing Company Limited.
| Grading Company | Action | New Grade | Date |
|---|---|---|---|
| TD Cowen | Maintain | Hold | 2026-01-16 |
| Barclays | Maintain | Overweight | 2026-01-16 |
| Needham | Maintain | Buy | 2026-01-15 |
| Bernstein | Maintain | Outperform | 2025-12-08 |
| Needham | Maintain | Buy | 2025-10-27 |
| Barclays | Maintain | Overweight | 2025-10-17 |
| Needham | Maintain | Buy | 2025-10-16 |
| Susquehanna | Maintain | Positive | 2025-10-10 |
| Barclays | Maintain | Overweight | 2025-10-09 |
| Barclays | Maintain | Overweight | 2025-09-16 |
Micron Technology, Inc. Grades
Below are recent grades from recognized financial institutions for Micron Technology, Inc.
| Grading Company | Action | New Grade | Date |
|---|---|---|---|
| Mizuho | Maintain | Outperform | 2026-01-27 |
| Stifel | Maintain | Buy | 2026-01-20 |
| Rosenblatt | Maintain | Buy | 2026-01-20 |
| TD Cowen | Maintain | Buy | 2026-01-20 |
| Citigroup | Maintain | Buy | 2026-01-15 |
| Wells Fargo | Maintain | Overweight | 2026-01-15 |
| Cantor Fitzgerald | Maintain | Overweight | 2026-01-14 |
| Keybanc | Maintain | Overweight | 2026-01-13 |
| B of A Securities | Maintain | Buy | 2026-01-13 |
| Lynx Global | Maintain | Buy | 2026-01-12 |
Which company has the best grades?
Micron Technology, Inc. consistently receives Buy and Outperform ratings, slightly stronger than Taiwan Semiconductor’s mix of Buy, Overweight, and Hold grades. This difference may influence investor sentiment toward Micron.
Risks specific to each company
The following categories identify critical pressure points and systemic threats facing Taiwan Semiconductor Manufacturing Company Limited (TSM) and Micron Technology, Inc. (MU) in the 2026 market environment:
1. Market & Competition
Taiwan Semiconductor Manufacturing Company Limited
- Dominates foundry segment but faces intense competition from Intel and Samsung in advanced nodes.
Micron Technology, Inc.
- Strong in memory market but highly cyclical with fierce pricing pressure and competition from Samsung and SK Hynix.
2. Capital Structure & Debt
Taiwan Semiconductor Manufacturing Company Limited
- Low debt-to-equity (0.18) and debt to assets (12.5%) indicate strong balance sheet and financial flexibility.
Micron Technology, Inc.
- Higher leverage (debt-to-equity 0.28) but still manageable; interest coverage healthy at 21x, supporting debt servicing.
3. Stock Volatility
Taiwan Semiconductor Manufacturing Company Limited
- Beta of 1.27 shows moderate volatility relative to the market, reflecting stable investor confidence.
Micron Technology, Inc.
- Higher beta at 1.51 signals greater stock price swings and sensitivity to semiconductor cyclicality.
4. Regulatory & Legal
Taiwan Semiconductor Manufacturing Company Limited
- Exposed to Taiwan-China geopolitical tensions which may trigger regulatory risks and supply disruptions.
Micron Technology, Inc.
- Faces US trade policies and export controls that could limit access to key markets like China.
5. Supply Chain & Operations
Taiwan Semiconductor Manufacturing Company Limited
- Operates cutting-edge fabs with advanced processes but relies heavily on Taiwan’s stable infrastructure.
Micron Technology, Inc.
- Supply chain exposed to global memory demand fluctuations; manufacturing complexity affects margins.
6. ESG & Climate Transition
Taiwan Semiconductor Manufacturing Company Limited
- Strong ESG initiatives; emphasis on energy efficiency in fabs aligns with global climate goals.
Micron Technology, Inc.
- Improving ESG scores but faces challenges due to high energy consumption in memory production.
7. Geopolitical Exposure
Taiwan Semiconductor Manufacturing Company Limited
- High geopolitical risk from Taiwan Strait tensions; any conflict would severely disrupt operations.
Micron Technology, Inc.
- Moderate geopolitical risk; US-China tensions impact supply and sales but less direct than TSM.
Which company shows a better risk-adjusted profile?
TSM’s dominant market position and strong financials mitigate risks but geopolitical exposure is a major threat. MU faces higher cyclicality and operational risks but benefits from a more diversified geographical base. TSM’s superior Altman Z-Score (15.7 vs. 12.3) and Piotroski score (8 vs. 7) reflect stronger financial stability and resilience. However, MU’s higher beta warns of greater stock volatility. Overall, TSM shows a better risk-adjusted profile, though investors must closely monitor geopolitical developments around Taiwan.
Final Verdict: Which stock to choose?
Taiwan Semiconductor Manufacturing Company Limited (TSM) commands an exceptional efficiency in capital allocation, generating returns well above its cost of capital. Its superpower lies in a durable competitive moat supported by expanding profitability. A point of vigilance is its relatively high valuation multiples, which could temper near-term upside. TSM suits investors targeting steady, long-term aggressive growth.
Micron Technology, Inc. (MU) builds its strategic moat on dynamic revenue growth and operational momentum, fueled by robust R&D investments. Its lower valuation and solid balance sheet offer comparatively greater safety than TSM, despite weaker capital efficiency. MU fits portfolios focused on Growth at a Reasonable Price (GARP), blending growth potential with moderate risk.
If you prioritize consistent value creation and a proven moat, TSM outshines due to its superior return on invested capital and financial strength. However, if you seek accelerated growth with a reasonable entry point and can tolerate higher volatility, MU offers better stability in valuation and an improving profitability trend. Both present analytical scenarios aligned with distinct investor profiles.
Disclaimer: Investment carries a risk of loss of initial capital. The past performance is not a reliable indicator of future results. Be sure to understand risks before making an investment decision.
Go Further
I encourage you to read the complete analyses of Taiwan Semiconductor Manufacturing Company Limited and Micron Technology, Inc. to enhance your investment decisions: