In the rapidly evolving semiconductor industry, two giants stand out: Taiwan Semiconductor Manufacturing Company Limited (TSM) and Micron Technology, Inc. (MU). Both companies are crucial players in the tech sector, sharing a market overlap through their innovative approaches to manufacturing and technology development. While TSM focuses on integrated circuits, Micron specializes in memory and storage solutions. As an investor, understanding the strengths and strategies of these companies is essential. In this article, I will help you identify which company may be the most compelling addition to your investment portfolio.
Table of contents
Company Overview
TSM Overview
Taiwan Semiconductor Manufacturing Company Limited (TSM) stands as a global leader in semiconductor manufacturing, providing advanced processes for a variety of applications including high-performance computing and mobile devices. Founded in 1987 and headquartered in Hsinchu City, Taiwan, TSM operates with a mission to deliver high-quality, innovative semiconductor solutions. With a market capitalization of approximately $1.51T and a diverse product range, TSM supports industries from automotive to consumer electronics. The company emphasizes collaborative engineering and customer support, ensuring a robust ecosystem for technology development. TSM is recognized for its commitment to research and development, positioning itself as a trusted partner for tech giants worldwide.
MU Overview
Micron Technology, Inc. is a prominent player in the memory and storage solutions sector, specializing in DRAM and NAND products. Established in 1978 and based in Boise, Idaho, Micron operates through four major segments, catering to diverse markets including cloud computing, mobile devices, and automotive applications. With a market cap of around $264B, Micron focuses on innovation to enhance data storage capabilities, striving to meet the increasing demand for high-speed memory solutions. The company’s strategic approach combines direct sales with a strong distribution network, enabling it to reach a broad customer base and solidify its position in the competitive semiconductor landscape.
Key similarities and differences
Both TSM and Micron operate in the semiconductor industry, yet they focus on different aspects of the market. TSM primarily specializes in semiconductor manufacturing services for various clients, while Micron concentrates on producing memory and storage products. Their business models reflect a collaboration with technology companies, but TSM relies more on manufacturing capabilities, whereas Micron emphasizes the design and production of memory solutions.
Income Statement Comparison
In this section, I present a comparative analysis of the income statements for Taiwan Semiconductor Manufacturing Company (TSM) and Micron Technology, Inc. (MU) for their most recent fiscal years.
| Metric | TSM | MU |
|---|---|---|
| Market Cap | 1.51T | 264.0B |
| Revenue | 2.89T | 37.38B |
| EBITDA | 1.98T | 18.49B |
| EBIT | 1.32T | 10.14B |
| Net Income | 1.16T | 8.54B |
| EPS | 223.40 | 7.65 |
| Fiscal Year | 2024 | 2025 |
Interpretation of Income Statement
In reviewing the income statements, TSM displays a significant increase in both revenue and net income compared to the previous year, highlighting robust operational efficiency and market demand. The gross and operating margins remain stable, indicating effective cost management despite rising expenses. Conversely, MU shows a recovery in revenue, but its recent net income reflects challenges with margins, particularly due to increased costs impacting profitability. This trend suggests that while TSM is capitalizing on growth opportunities, MU must focus on enhancing its operational efficiency to improve margins moving forward.
Financial Ratios Comparison
In this section, I compare the financial ratios of Taiwan Semiconductor Manufacturing Company Limited (TSM) and Micron Technology, Inc. (MU) based on the latest available data.
| Metric | TSM | MU |
|---|---|---|
| ROE | 27.29% | 15.76% |
| ROIC | 19.99% | 12.12% |
| P/E | 29.04 | 15.94 |
| P/B | 7.92 | 2.51 |
| Current Ratio | 2.36 | 2.52 |
| Quick Ratio | 2.14 | 1.79 |
| D/E | 0.25 | 0.28 |
| Debt-to-Assets | 15.65% | 18.45% |
| Interest Coverage | 125.96 | 20.69 |
| Asset Turnover | 0.43 | 0.45 |
| Fixed Asset Turnover | 0.88 | 0.79 |
| Payout ratio | 31.34% | 6.11% |
| Dividend yield | 1.08% | 0.38% |
Interpretation of Financial Ratios
TSM demonstrates robust financial health, with strong ROE and ROIC, indicating effective capital utilization. Its P/E ratio suggests investors are willing to pay a premium for its earnings potential. Conversely, MU reflects lower profitability metrics and a higher debt-to-assets ratio, raising concerns about financial stability. While MU’s current ratio is solid, its interest coverage is significantly weaker, suggesting increased risk. Investors should weigh these factors carefully when considering investments in either company.
Dividend and Shareholder Returns
Taiwan Semiconductor Manufacturing Company (TSM) pays a dividend with a current yield of 1.08% and a payout ratio of approximately 31%. The trend shows a steady increase in dividends, supported by robust free cash flow, though risks include potential unsustainable distributions due to market volatility. Conversely, Micron Technology, Inc. (MU) does not pay dividends, focusing instead on reinvesting in growth amidst a fluctuating market. MU has a minimal dividend payout ratio, but engages in share buybacks to enhance shareholder value. Both approaches reflect differing strategies towards long-term value creation, with TSM indicating stability and MU emphasizing growth potential.
Strategic Positioning
In the semiconductor market, Taiwan Semiconductor Manufacturing Company (TSM) holds a commanding market share, largely due to its advanced process technologies and extensive client base, including major tech companies. Micron Technology (MU), while also significant, faces intense competitive pressure in memory products, particularly from emerging technologies and rivals. Both companies must navigate technological disruptions, such as the shift towards 5G and AI applications, which could redefine their market dynamics and profitability.
Stock Comparison
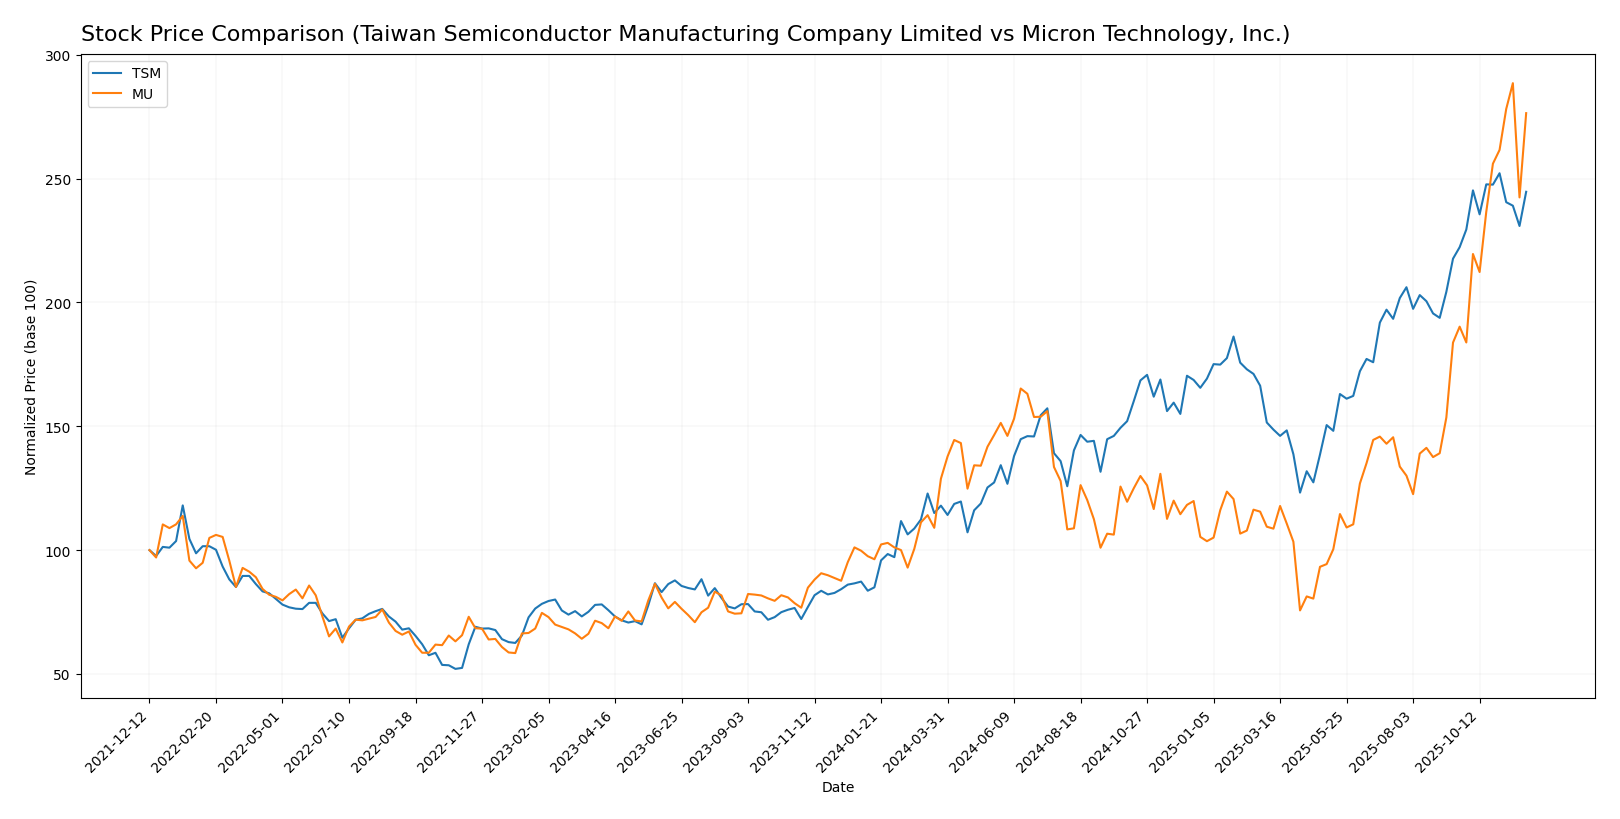
Over the past year, both Taiwan Semiconductor Manufacturing Company Limited (TSM) and Micron Technology, Inc. (MU) have exhibited significant price movements, reflecting robust trading dynamics and investor sentiment in the semiconductor sector.
Trend Analysis
Analyzing TSM’s stock performance over the past year, the percentage change stands at an impressive +192.65%. This indicates a strong bullish trend, supported by an acceleration in price movement, which saw notable highs at 300.43 and lows at 99.61. The average standard deviation of 47.5 suggests a relatively high level of volatility, which traders should consider when assessing risk.
For MU, the stock has also demonstrated a solid bullish trend with a percentage change of +183.38% over the same period. Similar to TSM, MU’s trend is characterized by acceleration, with the highest price recorded at 246.83 and the lowest at 64.72. The standard deviation of 36.98 indicates moderate volatility, presenting potential opportunities for both traders and long-term investors.
In recent weeks (from September 14 to November 30, 2025), TSM has experienced a price increase of +12.41%, with a standard deviation of 12.3, suggesting a stable yet positive trend. Conversely, MU has seen an even more pronounced increase of +50.4% during the same period, with a higher trend slope of 8.02, reinforcing its strong upward momentum.
Both stocks are currently experiencing increasing volume trends, with TSM showing a buyer dominance of 59.19% and MU at a stronger 54.27%. This indicates sustained interest from investors, further validating the bullish outlook for both companies.
Analyst Opinions
Recent analyst recommendations indicate a mixed outlook for key players in the semiconductor sector. For Taiwan Semiconductor Manufacturing Company Limited (TSM), analysts have rated it as “A-“, highlighting strong metrics in return on equity and assets, with a consensus recommendation leaning toward a buy. In contrast, Micron Technology, Inc. (MU) received a “B+” rating, reflecting concerns over discounted cash flow, though its return on assets remains robust. Analysts are generally cautious about MU, suggesting a hold position. Overall, the consensus for TSM is a buy, while MU leans towards a hold.
Stock Grades
As of late October 2025, I have gathered reliable stock grades for two prominent companies in the technology sector: Taiwan Semiconductor Manufacturing Company Limited (TSM) and Micron Technology, Inc. (MU). Here’s a look at their current assessments.
Taiwan Semiconductor Manufacturing Company Limited (TSM) Grades
| Grading Company | Action | New Grade | Date |
|---|---|---|---|
| Needham | maintain | Buy | 2025-10-27 |
| Barclays | maintain | Overweight | 2025-10-17 |
| Needham | maintain | Buy | 2025-10-16 |
| Susquehanna | maintain | Positive | 2025-10-10 |
| Barclays | maintain | Overweight | 2025-10-09 |
| Barclays | maintain | Overweight | 2025-09-16 |
| Needham | maintain | Buy | 2025-07-17 |
| Susquehanna | maintain | Positive | 2025-07-14 |
| Needham | maintain | Buy | 2025-07-01 |
| Susquehanna | maintain | Positive | 2025-06-17 |
Micron Technology, Inc. (MU) Grades
| Grading Company | Action | New Grade | Date |
|---|---|---|---|
| Morgan Stanley | maintain | Overweight | 2025-11-24 |
| UBS | maintain | Buy | 2025-11-20 |
| Rosenblatt | maintain | Buy | 2025-11-17 |
| Morgan Stanley | maintain | Overweight | 2025-11-13 |
| Wells Fargo | maintain | Overweight | 2025-11-07 |
| Mizuho | maintain | Outperform | 2025-10-28 |
| Citigroup | maintain | Buy | 2025-10-27 |
| Barclays | maintain | Overweight | 2025-10-20 |
| Mizuho | maintain | Outperform | 2025-10-17 |
| Citigroup | maintain | Buy | 2025-10-16 |
Both TSM and MU maintain strong positions in their grades, with a consistent “Buy” and “Overweight” sentiment from multiple reputable grading companies. This indicates a positive outlook for these stocks, suggesting that they could be solid additions to an investment portfolio.
Target Prices
The consensus target prices from reliable analysts indicate optimistic expectations for both Taiwan Semiconductor Manufacturing Company Limited (TSM) and Micron Technology, Inc. (MU).
| Company | Target High | Target Low | Consensus |
|---|---|---|---|
| TSM | 400 | 355 | 371.67 |
| MU | 338 | 150 | 215.47 |
For TSM, the consensus target price of 371.67 suggests a significant upside potential compared to the current price of 291.64. In contrast, MU’s consensus of 215.47 indicates a more moderate expectation, given its current price of 236.48.
Strengths and Weaknesses
The following table outlines the strengths and weaknesses of Taiwan Semiconductor Manufacturing Company Limited (TSM) and Micron Technology, Inc. (MU) based on the most recent data:
| Criterion | TSM | MU |
|---|---|---|
| Diversification | Strong global presence | Focused on memory tech |
| Profitability | High profit margins | Lower profit margins |
| Innovation | Leading in tech | Moderate innovation |
| Global presence | Extensive worldwide | Limited compared to TSM |
| Market Share | Dominant in semiconductors | Competitive but smaller |
| Debt level | Low debt-to-equity | Moderate debt level |
Key takeaways indicate that TSM holds a stronger market position and profitability compared to MU, which faces challenges in profitability and market share. Investors should weigh these factors when considering investments in these companies.
Risk Analysis
In the table below, I outline the key risks associated with Taiwan Semiconductor Manufacturing Company (TSM) and Micron Technology, Inc. (MU) as of the most recent year.
| Metric | TSM | MU |
|---|---|---|
| Market Risk | High | Moderate |
| Regulatory Risk | Moderate | High |
| Operational Risk | Low | High |
| Environmental Risk | Moderate | Moderate |
| Geopolitical Risk | High | Moderate |
Both companies face significant market and geopolitical risks, especially TSM, which is heavily influenced by global semiconductor demand and trade policies. Furthermore, regulatory pressures are intensifying for both, with MU facing more scrutiny potentially affecting operations.
Which one to choose?
When comparing Taiwan Semiconductor Manufacturing Company Limited (TSM) and Micron Technology, Inc. (MU), TSM appears more favorable due to its stronger financial metrics. TSM boasts a robust gross profit margin of 56.12% and a net profit margin of 40.02%, paired with an “A-” rating from analysts. In contrast, MU reflects a lower gross profit margin of 39.79% and a net profit margin of 22.84%, with a “B+” rating. TSM’s price-to-earnings ratio of 29.04 indicates a premium valuation, yet analysts maintain a bullish outlook due to its strong market position and growth potential.
For growth-focused investors, TSM may be the better choice. Conversely, MU might appeal to those seeking potential recovery from current valuations, albeit with higher inherent risks, including competitive pressures and market volatility.
Disclaimer: This article is not financial advice. Each investor is responsible for their own investment decisions.
Go further
I encourage you to read the complete analyses of Taiwan Semiconductor Manufacturing Company Limited and Micron Technology, Inc. to enhance your investment decisions: