Home > Comparison > Financial Services > BK vs TROW
The strategic rivalry between The Bank of New York Mellon Corporation and T. Rowe Price Group defines the trajectory of the asset management industry. BK operates as a diversified financial services powerhouse with extensive custody and wealth management capabilities. In contrast, TROW focuses on active investment management with a strong emphasis on fundamental and quantitative research. This analysis evaluates which company’s business model offers superior risk-adjusted returns for a diversified portfolio in today’s complex market environment.

Table of contents
Companies Overview
The Bank of New York Mellon and T. Rowe Price anchor the financial services industry with distinct asset management strengths.
The Bank of New York Mellon Corporation: Global Custody and Investment Solutions Leader
The Bank of New York Mellon Corporation dominates as a custody and securities services provider. It generates revenue through custody, asset servicing, wealth management, and market services. In 2026, it prioritizes expanding integrated cash management and data analytics to enhance client solutions across central banks, asset managers, and high-net-worth individuals.
T. Rowe Price Group, Inc.: Premier Investment Management Firm
T. Rowe Price Group thrives as a publicly owned investment manager. Its core revenue derives from managing equity and fixed income mutual funds globally. In 2026, it sharpens its focus on leveraging fundamental and quantitative analysis with an ESG-driven investment approach, targeting institutional investors and retirement plans worldwide.
Strategic Collision: Similarities & Divergences
Both firms excel in asset management but diverge in business philosophy: BNY Mellon emphasizes a service-driven custody and infrastructure model, while T. Rowe Price pursues active fund management with a bottom-up investment process. Their competition centers on capturing institutional client assets. Their investment profiles contrast sharply—BNY Mellon offers infrastructure stability; T. Rowe Price offers growth through active portfolio management.
Income Statement Comparison
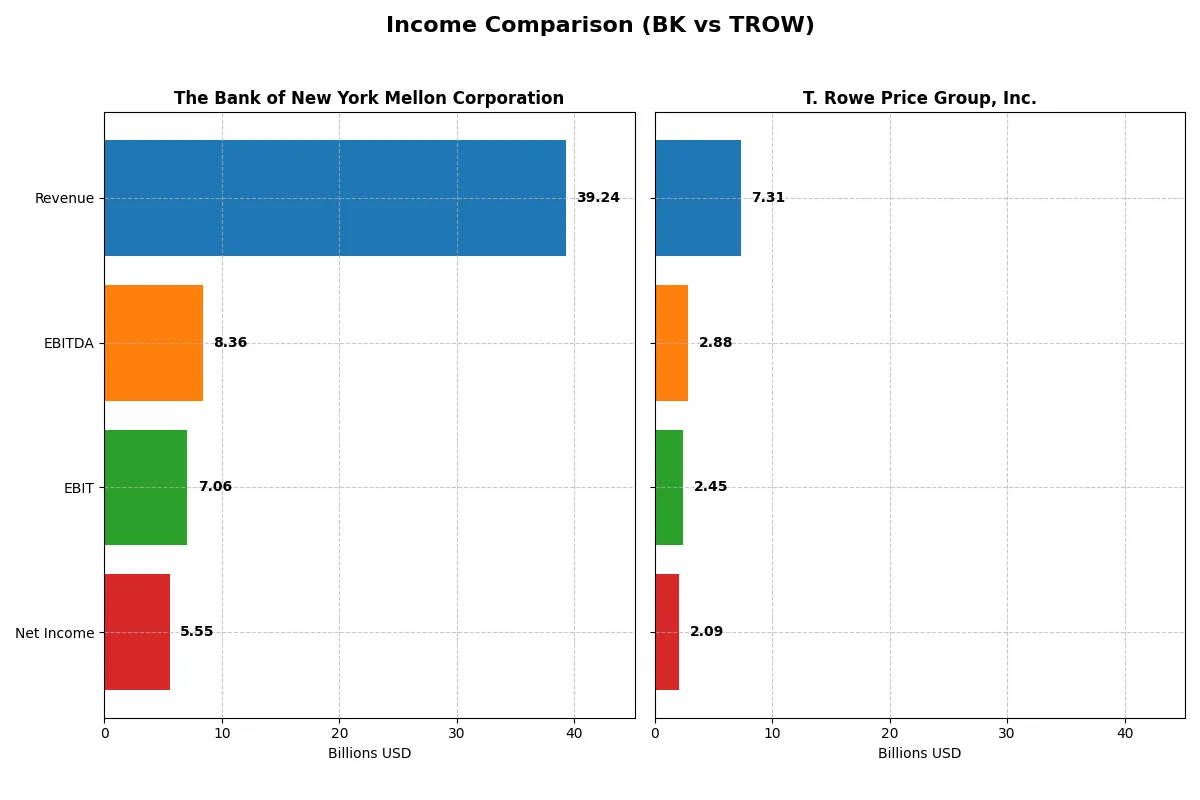
This data dissects the core profitability and scalability of both corporate engines to reveal who dominates the bottom line:
| Metric | The Bank of New York Mellon Corporation (BK) | T. Rowe Price Group, Inc. (TROW) |
|---|---|---|
| Revenue | 39.2B | 7.3B |
| Cost of Revenue | 19.4B | 2.7B |
| Operating Expenses | 12.8B | 2.4B |
| Gross Profit | 19.9B | 4.6B |
| EBITDA | 8.4B | 2.9B |
| EBIT | 7.1B | 2.4B |
| Interest Expense | 20.7B | 0 |
| Net Income | 5.5B | 2.1B |
| EPS | 7.46 | 9.26 |
| Fiscal Year | 2025 | 2025 |
Income Statement Analysis: The Bottom-Line Duel
This income statement comparison reveals which company runs a more efficient and profitable financial engine in the current market environment.
The Bank of New York Mellon Corporation Analysis
BK’s revenue grew from $15.9B in 2021 to $39.2B in 2025, showing strong top-line momentum despite a slight dip last year. Net income expanded robustly to $5.5B in 2025, with gross and net margins holding firm at 50.6% and 14.1%, respectively. EBIT margin improved to 18%, signaling enhanced operational efficiency and margin expansion.
T. Rowe Price Group, Inc. Analysis
TROW’s revenue declined modestly over five years, settling at $7.3B in 2025, with net income dropping to $2.1B. Despite a strong gross margin of 62.7%, the net margin narrowed to 28.5%, reflecting rising operating expenses. EBIT margin slipped slightly to 33.4%, indicating margin pressure amid flat revenue growth and subdued earnings momentum.
Margin Strength vs. Revenue Growth
BK outperforms with significant revenue and net income growth, coupled with improving margins and operational efficiency. In contrast, TROW’s margins remain high but face pressure from stagnant top-line growth and declining net income. For investors, BK’s profile offers a compelling blend of scale and margin expansion, while TROW reflects a more challenged growth trajectory.
Financial Ratios Comparison
These vital ratios act as a diagnostic tool to expose the underlying fiscal health, valuation premiums, and capital efficiency of the companies analyzed:
| Ratios | The Bank of New York Mellon Corporation (BK) | T. Rowe Price Group, Inc. (TROW) |
|---|---|---|
| ROE | 12.5% | 19.2% |
| ROIC | 6.4% | 22.2% |
| P/E | 14.7 | 11.0 |
| P/B | 1.85 | 2.11 |
| Current Ratio | 0.70 | 0.00* |
| Quick Ratio | 0.70 | 0.00* |
| D/E | 0.76 | 0.00* |
| Debt-to-Assets | 7.2% | 0.0%* |
| Interest Coverage | 0.34 | 0.00* |
| Asset Turnover | 0.08 | 0.51 |
| Fixed Asset Turnover | 10.96 | 5.96 |
| Payout ratio | 25.4% | 54.5% |
| Dividend yield | 1.72% | 4.96% |
| Fiscal Year | 2025 | 2025 |
*Note: T. Rowe Price Group (TROW) shows zero or no reported values for some liquidity and debt ratios, indicating potentially different capital structures or reporting standards.
Efficiency & Valuation Duel: The Vital Signs
Financial ratios act as a company’s DNA, exposing hidden risks and highlighting operational excellence critical for investors’ decisions.
The Bank of New York Mellon Corporation
BK shows moderate profitability with a 12.5% ROE and a net margin of 14.1%. Its P/E of 14.7 suggests a fairly valued stock, though some operational metrics flag caution. The company provides a 1.7% dividend yield, balancing shareholder returns with selective reinvestment, reflecting a measured capital allocation approach.
T. Rowe Price Group, Inc.
TROW demonstrates robust profitability, posting a 19.2% ROE and a strong net margin of 28.5%. Trading at a P/E of 11.0, the stock appears attractively priced relative to its earnings. A 5.0% dividend yield and low leverage indicate disciplined capital deployment, rewarding shareholders while sustaining growth momentum effectively.
Operational Strength vs. Valuation Appeal
TROW offers a superior blend of profitability and shareholder returns with a favorable valuation profile. BK exhibits moderate efficiency but carries more operational risks. Investors seeking higher returns with manageable risk may prefer TROW’s profile, while BK suits those valuing steady income and cautious growth.
Which one offers the Superior Shareholder Reward?
I see The Bank of New York Mellon (BK) pays a modest dividend yield around 1.7-3.6% with payout ratios between 25-54%, supported by mixed free cash flow coverage. BK’s buybacks are modest but consistent. T. Rowe Price (TROW) delivers a higher dividend yield near 4.5-5%, with payout ratios around 54-70%, backed by strong free cash flow and steady buybacks. TROW’s disciplined capital allocation and robust margins fuel sustainable distributions. I conclude TROW offers a superior total shareholder return in 2026 due to higher yield, buyback intensity, and sustainable payout backed by strong cash flow.
Comparative Score Analysis: The Strategic Profile
The radar chart reveals the fundamental DNA and trade-offs of The Bank of New York Mellon Corporation and T. Rowe Price Group, Inc.:
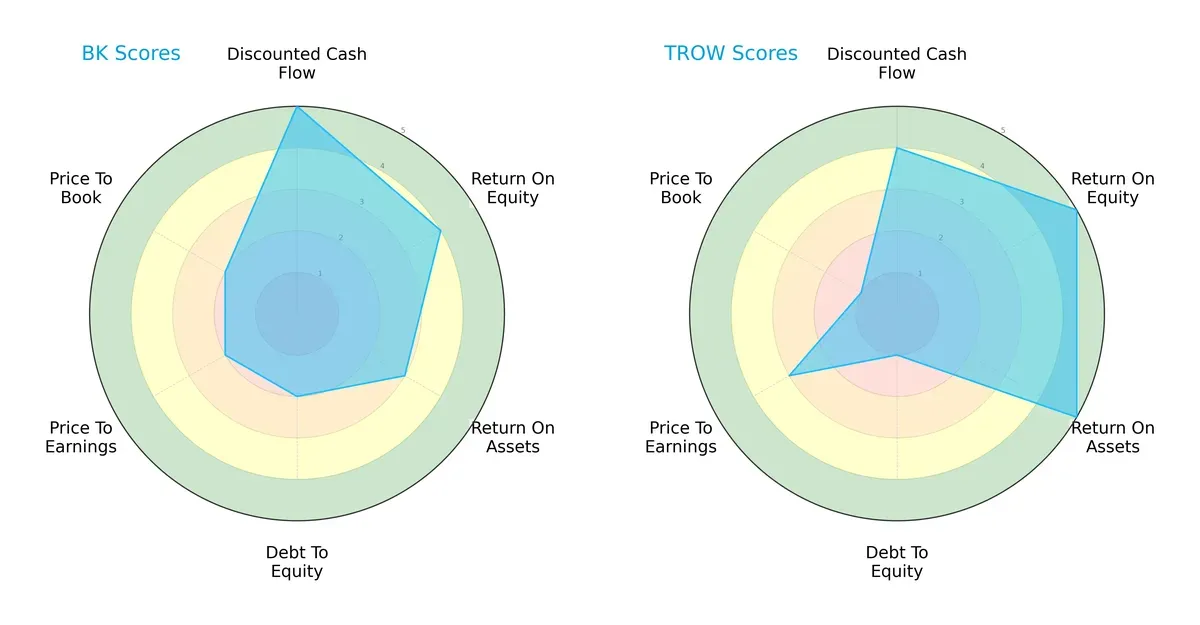
BK exhibits strength in discounted cash flow (DCF) with a very favorable score of 5, while TROW leads in return on equity (ROE) and return on assets (ROA) with top scores of 5 each. BK shows weaknesses in debt-to-equity and valuation metrics (P/E and P/B), scoring 2s, indicating higher financial leverage and less attractive pricing. TROW’s debt-to-equity and price-to-book scores are weaker, signaling higher financial risk and valuation concerns. Overall, TROW offers a more balanced profitability profile, whereas BK relies on strong cash flow valuation metrics.
Bankruptcy Risk: Solvency Showdown
The Altman Z-Score gap highlights divergent solvency prospects between BK and TROW:
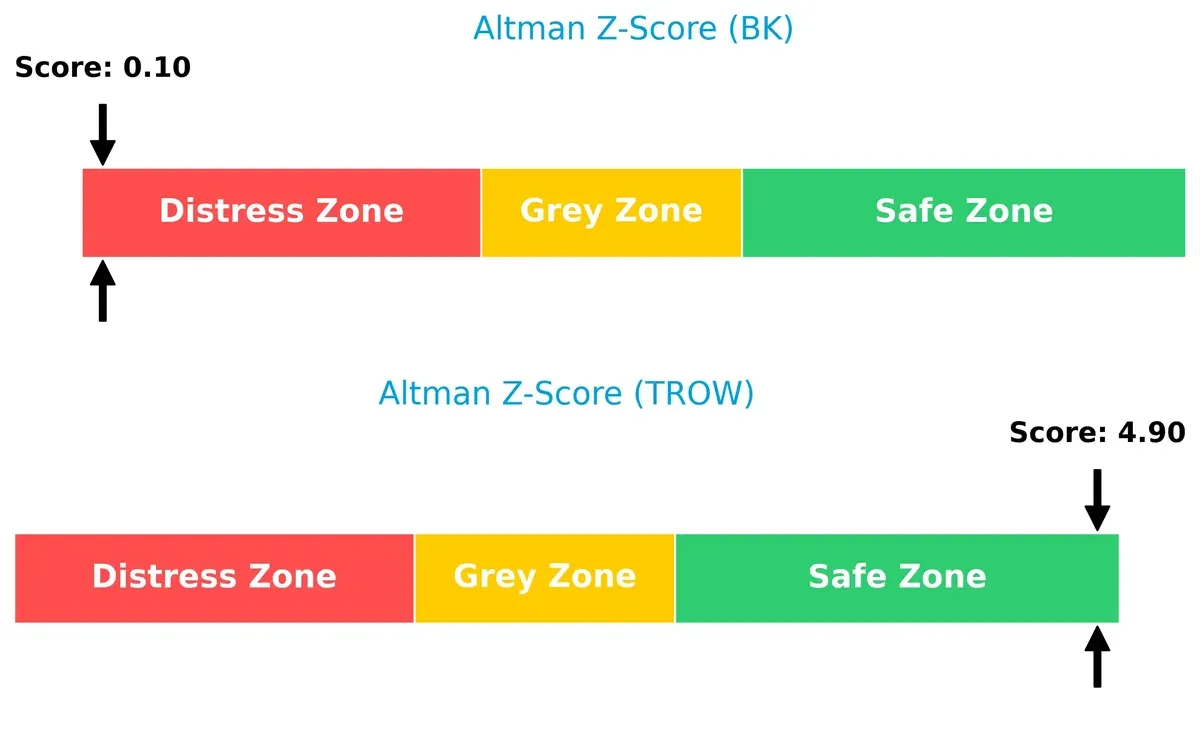
BK’s distress zone score (~0.1) signals serious bankruptcy risk, reflecting financial fragility in this challenging cycle. In contrast, TROW’s safe zone score (~4.9) suggests robust solvency and strong long-term survival odds. This stark delta underscores TROW’s superior financial stability in turbulent markets.
Financial Health: Quality of Operations
Piotroski F-Scores indicate relative operational quality between the two firms:
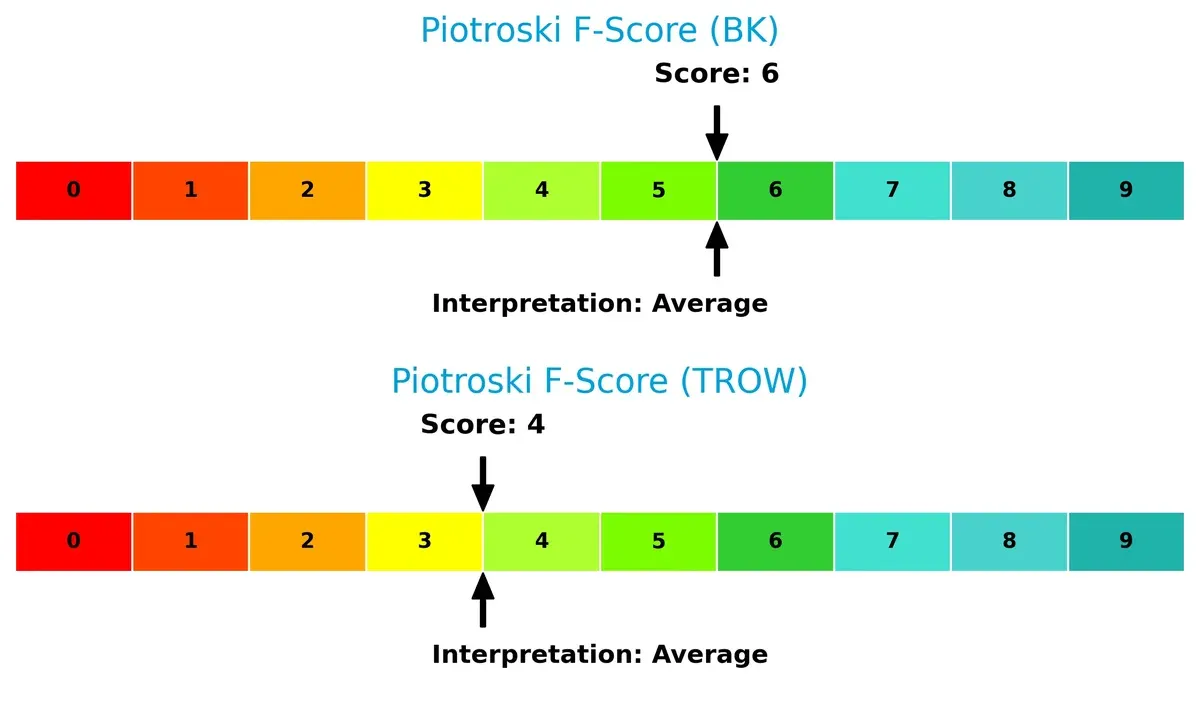
BK scores a solid 6, reflecting average but stable financial health with no immediate red flags. TROW’s score of 4 is also average but comparatively weaker, hinting at potential internal efficiency or profitability concerns. Neither company is at peak financial health, but BK shows a slight edge in operational quality.
How are the two companies positioned?
This section dissects the operational DNA of BK and TROW by comparing their revenue distribution and internal dynamics. The final objective confronts their economic moats to identify which model offers the most resilient, sustainable advantage today.
Revenue Segmentation: The Strategic Mix
The following visual comparison dissects how both firms diversify their income streams and where their primary sector bets lie:
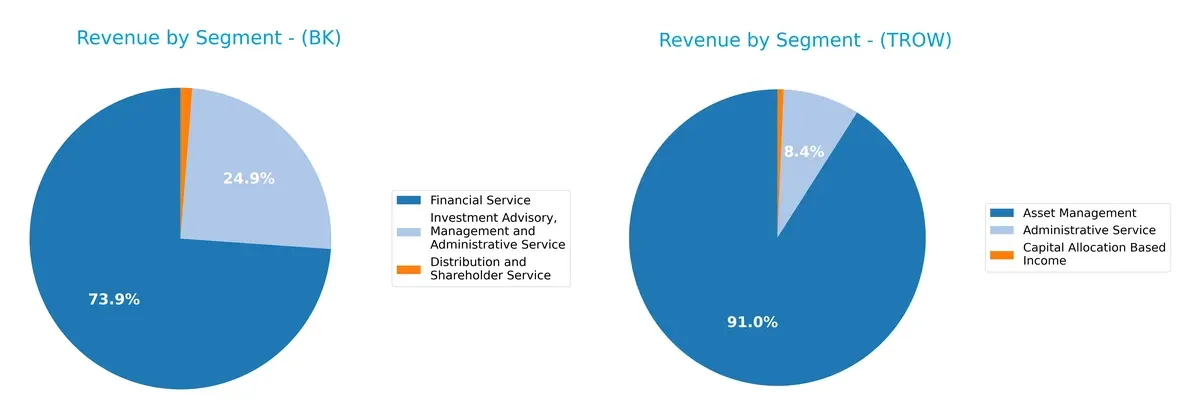
The Bank of New York Mellon Corporation (BK) anchors its revenue heavily in Financial Service at $9.34B, complemented by $3.14B in Investment Advisory. This mix shows moderate diversification across financial services. In contrast, T. Rowe Price Group, Inc. (TROW) pivots almost exclusively on Asset Management at $6.4B, with a smaller Administrative Service slice of $588M. BK’s broader portfolio suggests ecosystem lock-in, while TROW’s concentration signals higher reliance on asset management performance.
Strengths and Weaknesses Comparison
This table compares the Strengths and Weaknesses of The Bank of New York Mellon Corporation (BK) and T. Rowe Price Group, Inc. (TROW):
BK Strengths
- Diversified revenue streams across multiple financial and investment services
- Presence in U.S., EMEA, Asia Pacific, and other countries
- Favorable net margin and fixed asset turnover
- Low debt-to-assets ratio supports financial stability
TROW Strengths
- High net margin, ROE, and ROIC indicating strong profitability
- Zero debt and infinite interest coverage highlight conservative leverage
- Favorable P/E and dividend yield support investor returns
- Focused asset management with steady administrative income
BK Weaknesses
- Current and quick ratios below 1 signal liquidity concerns
- WACC exceeds ROIC, indicating value destruction
- Low asset turnover and interest coverage ratios
- Slightly unfavorable overall financial ratio profile
TROW Weaknesses
- Current and quick ratios at zero indicate potential liquidity issues
- WACC remains higher than ideal despite strong returns
- Some neutral asset turnover metrics
- Smaller geographic diversification compared to BK
Overall, BK shows strength in geographic diversification and stable revenue streams but faces liquidity and capital efficiency challenges. TROW excels in profitability and conservative balance sheet management but has limited geographic scope and liquidity red flags. These factors shape their distinct strategic profiles.
The Moat Duel: Analyzing Competitive Defensibility
A structural moat is the only reliable shield protecting long-term profits from relentless competitive erosion in asset management firms:
The Bank of New York Mellon Corporation: Custody & Scale Moat
I see BNY Mellon’s primary moat in its extensive custody and securities services network. This manifests as stable margins and growing ROIC, despite value erosion. New tech-driven wealth solutions in 2026 could deepen its moat if executed well.
T. Rowe Price Group, Inc.: Investment Expertise Moat
T. Rowe Price’s moat centers on strong investment management and brand trust, contrasting BNY Mellon’s service scale. It commands a high ROIC well above WACC, but its declining ROIC trend signals caution. Global market expansion remains a key opportunity.
Scale Networks vs. Investment Excellence: Who Holds the Moat Edge?
BNY Mellon’s moat suffers from value destruction but shows rising profitability, while T. Rowe Price creates value with a wider moat but faces margin pressure. I judge T. Rowe Price better positioned to defend market share through investment performance.
Which stock offers better returns?
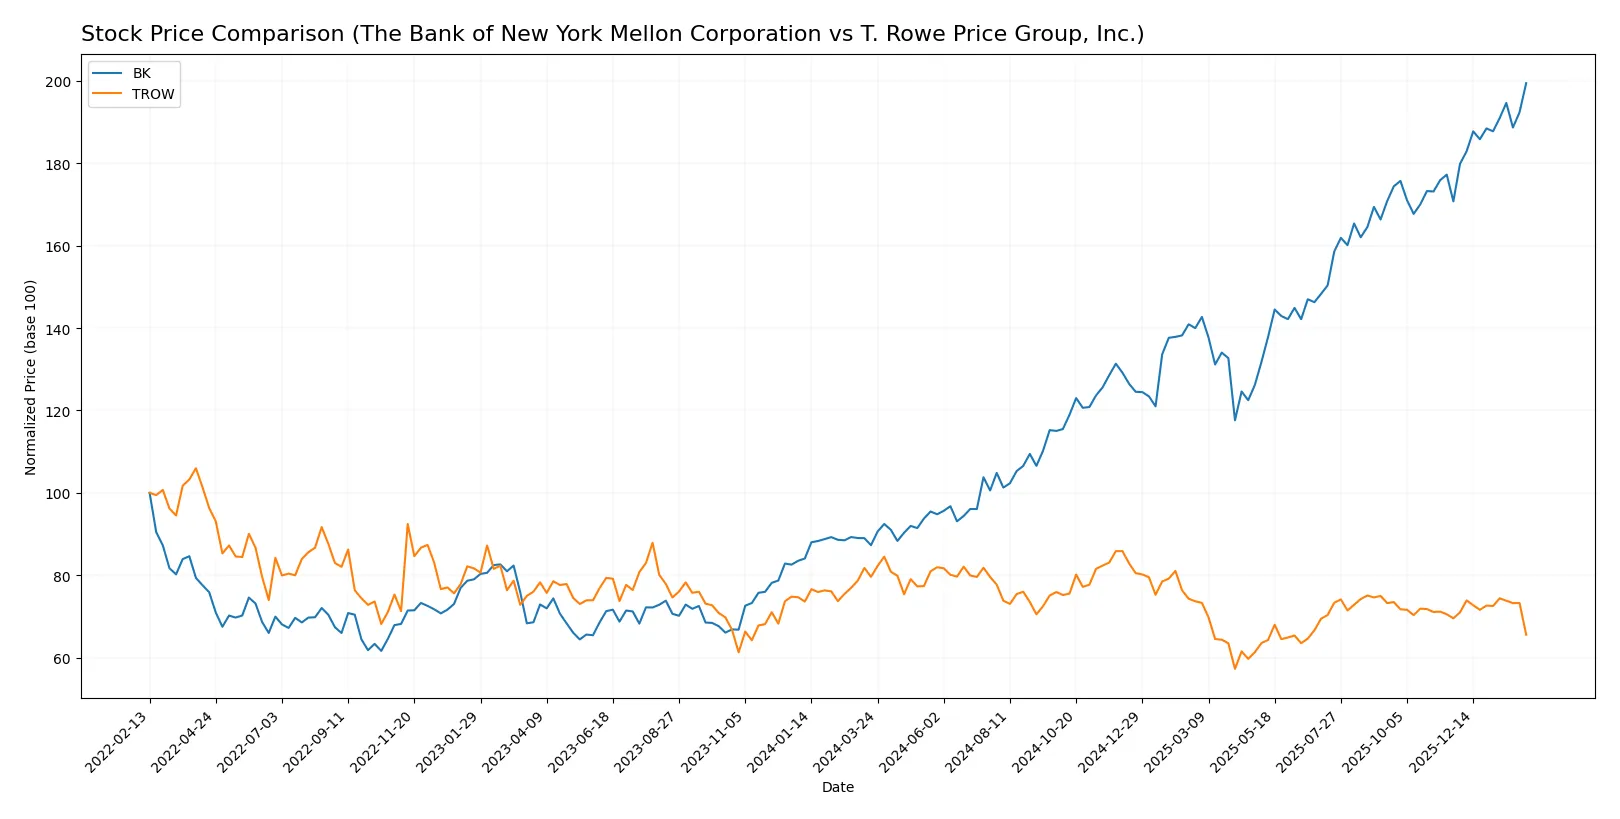
The past 12 months reveal stark contrasts in price dynamics: The Bank of New York Mellon rallies sharply, while T. Rowe Price slides with mounting bearish pressure.
Trend Comparison
The Bank of New York Mellon’s stock surged 128.49% over the past year, marking a bullish trend with accelerating momentum and a high volatility standard deviation of 19.58%. It hit a peak of 124.32 and a low of 54.41.
T. Rowe Price’s shares declined 17.66% over the same period, reflecting a bearish trend with accelerating downward pressure and moderate volatility at an 8.86 standard deviation. Prices ranged between 82.6 and 123.84.
Comparatively, The Bank of New York Mellon outperformed T. Rowe Price, delivering the highest market returns with strong upward acceleration versus T. Rowe Price’s sustained decline.
Target Prices
Analysts provide a confident target price consensus for both The Bank of New York Mellon Corporation and T. Rowe Price Group, Inc.
| Company | Target Low | Target High | Consensus |
|---|---|---|---|
| The Bank of New York Mellon Corporation | 110 | 143 | 130.25 |
| T. Rowe Price Group, Inc. | 94 | 123 | 108.25 |
The target consensus for BK suggests upside from its current 124.32 price, indicating moderate growth expectations. TROW’s consensus at 108.25 is notably above its 94.58 current price, signaling bullish analyst sentiment.

Don’t Let Luck Decide Your Entry Point
Optimize your entry points with our advanced ProRealTime indicators. You’ll get efficient buy signals with precise price targets for maximum performance. Start outperforming now!
How do institutions grade them?
The Bank of New York Mellon Corporation Grades
The following table summarizes recent grades from reputable institutions for The Bank of New York Mellon Corporation:
| Grading Company | Action | New Grade | Date |
|---|---|---|---|
| Keefe, Bruyette & Woods | Maintain | Outperform | 2026-01-14 |
| Citigroup | Maintain | Neutral | 2026-01-14 |
| RBC Capital | Maintain | Sector Perform | 2026-01-14 |
| Wells Fargo | Maintain | Equal Weight | 2026-01-14 |
| Morgan Stanley | Maintain | Overweight | 2026-01-14 |
| TD Cowen | Maintain | Buy | 2026-01-07 |
| Truist Securities | Upgrade | Buy | 2026-01-07 |
| Barclays | Maintain | Overweight | 2026-01-05 |
| Morgan Stanley | Maintain | Overweight | 2025-12-17 |
| TD Cowen | Maintain | Buy | 2025-10-20 |
T. Rowe Price Group, Inc. Grades
This table presents the latest credible grades published for T. Rowe Price Group, Inc.:
| Grading Company | Action | New Grade | Date |
|---|---|---|---|
| JP Morgan | Maintain | Underweight | 2026-02-05 |
| Evercore ISI Group | Maintain | In Line | 2026-02-05 |
| Keefe, Bruyette & Woods | Maintain | Market Perform | 2026-02-05 |
| TD Cowen | Maintain | Hold | 2026-02-05 |
| Morgan Stanley | Maintain | Equal Weight | 2026-02-03 |
| JP Morgan | Maintain | Underweight | 2026-01-20 |
| Barclays | Maintain | Underweight | 2026-01-15 |
| TD Cowen | Maintain | Hold | 2026-01-14 |
| Morgan Stanley | Maintain | Equal Weight | 2025-12-17 |
| Keefe, Bruyette & Woods | Maintain | Market Perform | 2025-12-17 |
Which company has the best grades?
The Bank of New York Mellon Corporation consistently receives positive grades, including multiple “Buy” and “Outperform” ratings. In contrast, T. Rowe Price Group, Inc. mostly holds “Hold,” “Market Perform,” or “Underweight” assessments. This divergence signals stronger institutional confidence in The Bank of New York Mellon Corporation, potentially influencing investor sentiment and portfolio positioning.
Risks specific to each company
The following categories identify critical pressure points and systemic threats facing both firms in the 2026 market environment:
1. Market & Competition
The Bank of New York Mellon Corporation
- Faces fierce competition in custody and wealth services, with moderate ROE and net margin pressure.
T. Rowe Price Group, Inc.
- Benefits from strong net margin and ROE, yet competes in a highly volatile asset management segment.
2. Capital Structure & Debt
The Bank of New York Mellon Corporation
- Moderate debt-to-equity ratio (0.76) but weak interest coverage (0.34) signals financial risk.
T. Rowe Price Group, Inc.
- No debt reported, excellent interest coverage, reflecting a strong, debt-free balance sheet.
3. Stock Volatility
The Bank of New York Mellon Corporation
- Beta at 1.09 indicates moderate market sensitivity and stock volatility.
T. Rowe Price Group, Inc.
- Higher beta of 1.54 suggests greater stock price swings and risk exposure.
4. Regulatory & Legal
The Bank of New York Mellon Corporation
- Subject to stringent banking and securities regulations, increasing compliance costs and risk.
T. Rowe Price Group, Inc.
- Faces regulatory scrutiny typical for asset managers, with growing ESG compliance demands.
5. Supply Chain & Operations
The Bank of New York Mellon Corporation
- Operational complexity in custody and clearing services exposes it to technology and process risks.
T. Rowe Price Group, Inc.
- Operational focus on fund management reduces supply chain risk but requires constant innovation.
6. ESG & Climate Transition
The Bank of New York Mellon Corporation
- Engages in renewable energy investments but faces challenges integrating ESG in legacy operations.
T. Rowe Price Group, Inc.
- Strong ESG commitment with socially responsible investing as a core strategy, enhancing reputation.
7. Geopolitical Exposure
The Bank of New York Mellon Corporation
- Global custody services expose it to cross-border regulatory and geopolitical risks.
T. Rowe Price Group, Inc.
- Diverse global presence, but asset management business is less exposed to geopolitical disruptions.
Which company shows a better risk-adjusted profile?
T. Rowe Price faces less capital structure risk and boasts superior profitability metrics. However, its higher stock volatility and weaker regulatory rating add caution. BNY Mellon’s debt and interest coverage weaknesses pose significant risk despite its stable market position. T. Rowe Price’s Altman Z-score firmly in the safe zone versus BNY Mellon’s distress zone confirms a stronger risk-adjusted profile overall. The stark contrast in interest coverage and debt levels justifies heightened concern for BNY Mellon’s financial resilience.
Final Verdict: Which stock to choose?
The Bank of New York Mellon Corporation (BK) boasts unmatched efficiency as a cash generator within the financial sector. Its ability to convert assets into free cash flow, despite some liquidity constraints, signals operational strength. This stock suits investors with an appetite for cyclical recovery and aggressive growth potential. The point of vigilance remains its below-par current ratio, indicating short-term liquidity risk.
T. Rowe Price Group, Inc. (TROW) stands out with a robust strategic moat rooted in strong return on invested capital and recurring revenue streams. It offers superior profitability metrics and a safer balance sheet compared to BK, making it a more stable choice. TROW fits well within Growth at a Reasonable Price (GARP) portfolios seeking steady income and moderate growth.
If you prioritize aggressive growth and cash flow momentum, BK is the compelling choice due to its accelerating price trend and improving profitability. However, if you seek better stability and consistent value creation, TROW offers superior financial health and a durable moat despite its recent stock weakness. Each scenario demands careful risk assessment aligned with your investment profile.
Disclaimer: Investment carries a risk of loss of initial capital. The past performance is not a reliable indicator of future results. Be sure to understand risks before making an investment decision.
Go Further
I encourage you to read the complete analyses of The Bank of New York Mellon Corporation and T. Rowe Price Group, Inc. to enhance your investment decisions: