Home > Comparison > Communication Services > TMUS vs VZ
The strategic rivalry between T-Mobile US, Inc. and Verizon Communications Inc. defines the trajectory of the communication services sector. T-Mobile operates as a dynamic wireless service provider focused on mobile connectivity and retail distribution. Verizon combines comprehensive telecommunications with technology and entertainment services, emphasizing network infrastructure and enterprise solutions. This analysis explores which model offers superior risk-adjusted returns amid evolving consumer demands and technological shifts, guiding portfolio allocation in a competitive landscape.
Table of contents
Companies Overview
T-Mobile US and Verizon Communications dominate the U.S. telecommunications landscape with vast subscriber bases and aggressive growth strategies.
T-Mobile US, Inc.: Mobile Communications Powerhouse
T-Mobile US leads in mobile communications services across the U.S., Puerto Rico, and the Virgin Islands. Its core revenue comes from voice, messaging, and data services to 108.7M customers via postpaid, prepaid, and wholesale markets. In 2021, T-Mobile sharpened its focus on expanding network infrastructure, operating 102K macro cells and 41K small cells to boost coverage and capacity.
Verizon Communications Inc.: Comprehensive Telecom & Tech Leader
Verizon commands a broad footprint in communications, technology, and entertainment worldwide. It generates revenue from consumer postpaid/prepaid plans, fixed internet/video/voice services, and business network solutions. By the end of 2021, Verizon’s strategic emphasis included enhancing private networking, cloud connectivity, and IoT offerings, serving 115M wireless retail connections and expanding enterprise tech solutions.
Strategic Collision: Similarities & Divergences
Both companies prioritize wireless connectivity but differ in business philosophy: T-Mobile focuses on a mobile-centric network with retail control, while Verizon offers a diversified mix of consumer and enterprise services. They clash fiercely over subscriber growth and 5G leadership. T-Mobile’s nimble growth contrasts with Verizon’s stable, tech-integrated approach, creating distinct investment profiles for growth seekers versus income-focused investors.
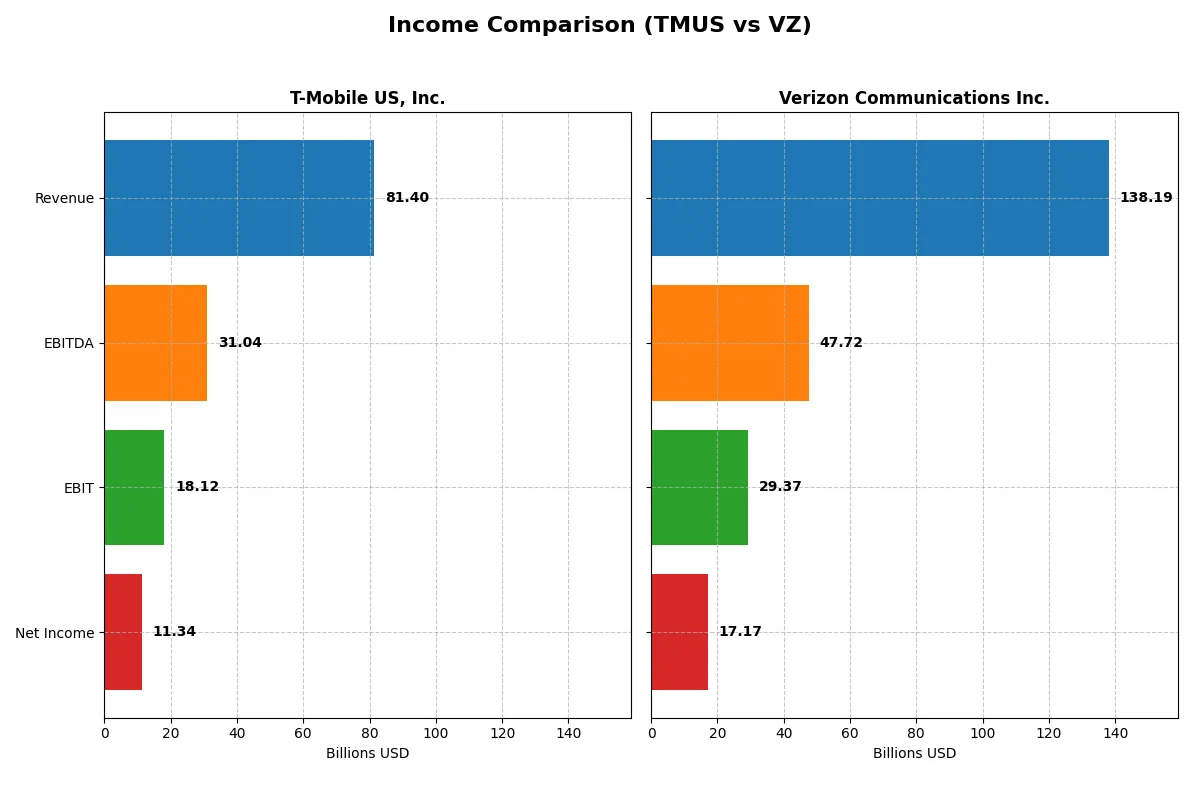
Income Statement Comparison
This data dissects the core profitability and scalability of both corporate engines to reveal who dominates the bottom line:
| Metric | T-Mobile US, Inc. (TMUS) | Verizon Communications Inc. (VZ) |
|---|---|---|
| Revenue | 81.4B | 134.8B |
| Cost of Revenue | 29.7B | 72.0B |
| Operating Expenses | 33.7B | 32.2B |
| Gross Profit | 51.7B | 62.8B |
| EBITDA | 31.0B | 47.5B |
| EBIT | 18.1B | 29.6B |
| Interest Expense | 3.4B | 6.7B |
| Net Income | 11.3B | 17.5B |
| EPS | 9.7 | 4.15 |
| Fiscal Year | 2024 | 2024 |
Income Statement Analysis: The Bottom-Line Duel
This income statement comparison reveals which company drives superior profitability and operational efficiency in a competitive telecom landscape.
T-Mobile US, Inc. Analysis
T-Mobile’s revenue rose steadily from $68B in 2020 to $81B in 2024, with net income surging from $3B to $11.3B. The company sustains strong gross margins near 64% and net margins improving to 13.9%, reflecting disciplined cost control. In 2024, T-Mobile’s EBIT jumped 26%, signaling robust operational momentum and efficient capital deployment.
Verizon Communications Inc. Analysis
Verizon’s revenue hovered around $134B to $138B from 2021 to 2025, but net income declined from $22B to $17.2B in 2025. Gross margin stands at a healthy 46%, yet net margin shrank to 12.4%, indicating margin pressure. The slight revenue growth in 2025 contrasts with a 4% net margin drop, pointing to challenges in sustaining profitability momentum.
Margin Expansion vs. Revenue Stability
T-Mobile outperforms Verizon by delivering consistent margin expansion and striking net income growth despite smaller revenue scale. Verizon’s higher revenue base faces shrinking profitability and soft earnings growth. For investors, T-Mobile’s profile offers a more attractive growth and margin trajectory amid evolving sector dynamics.
Financial Ratios Comparison
These vital ratios act as a diagnostic tool to expose the underlying fiscal health, valuation premiums, and capital efficiency of each company:
| Ratios | T-Mobile US, Inc. (TMUS) | Verizon Communications Inc. (VZ) |
|---|---|---|
| ROE | 18.37% | 16.44% |
| ROIC | 7.05% | 6.22% |
| P/E | 22.76 | 10.02 |
| P/B | 4.18 | 1.65 |
| Current Ratio | 0.91 | 0.91 |
| Quick Ratio | 0.83 | 0.87 |
| D/E | 1.85 | 1.92 |
| Debt-to-Assets | 55.0% | 49.6% |
| Interest Coverage | 5.28 | 4.37 |
| Asset Turnover | 0.39 | 0.34 |
| Fixed Asset Turnover | 1.21 | 1.04 |
| Payout Ratio | 29.1% | 66.9% |
| Dividend Yield | 1.28% | 6.67% |
| Fiscal Year | 2024 | 2025 |
Efficiency & Valuation Duel: The Vital Signs
Financial ratios act as a company’s DNA, unveiling hidden risks and operational strengths behind its market presence and growth potential.
T-Mobile US, Inc.
T-Mobile posts a strong 18.4% ROE and a favorable 13.9% net margin, signaling solid profitability. However, its P/E of 22.8 and a high P/B of 4.18 suggest the stock is moderately stretched. Shareholder returns lean on a modest 1.28% dividend yield, indicating a balanced approach with some reinvestment in growth rather than heavy buybacks.
Verizon Communications Inc.
Verizon delivers a robust 16.4% ROE and a slightly lower 12.4% net margin, maintaining operational efficiency. Its P/E of 10.0 and P/B of 1.65 point to an attractive valuation, implying the stock trades at a discount relative to earnings and book value. Verizon’s 6.67% dividend yield highlights a strong income focus, rewarding shareholders steadily.
Valuation Discipline vs. Profitability Edge
Verizon offers a more favorable valuation with a compelling dividend, balancing risk and reward prudently. T-Mobile shows higher profitability but trades at a premium. Investors seeking income may prefer Verizon’s profile, while growth-oriented investors might lean toward T-Mobile’s operational strength.
Which one offers the Superior Shareholder Reward?
T-Mobile US, Inc. (TMUS) pays a modest 1.28% dividend yield with a low 29% payout ratio, preserving significant free cash flow for growth and buybacks. Verizon Communications Inc. (VZ) delivers a high 6.7% yield, but with a hefty 67% payout ratio, limiting reinvestment. Both run strong buyback programs; TMUS’s free cash flow per share of $8.5 supports sustainable buybacks and dividend growth. VZ’s free cash flow per share is $4.5, sustaining its generous dividend but with less leftover for expansion. I judge TMUS’s balanced distribution—moderate dividends plus aggressive buybacks and reinvestment—offers a more durable total return in 2026. VZ’s yield is attractive but risks dividend cuts if cash flow falters. Thus, TMUS provides superior shareholder reward over the long term.
Comparative Score Analysis: The Strategic Profile
The radar chart reveals the fundamental DNA and trade-offs of T-Mobile US, Inc. and Verizon Communications Inc., highlighting their financial strengths and valuation nuances:
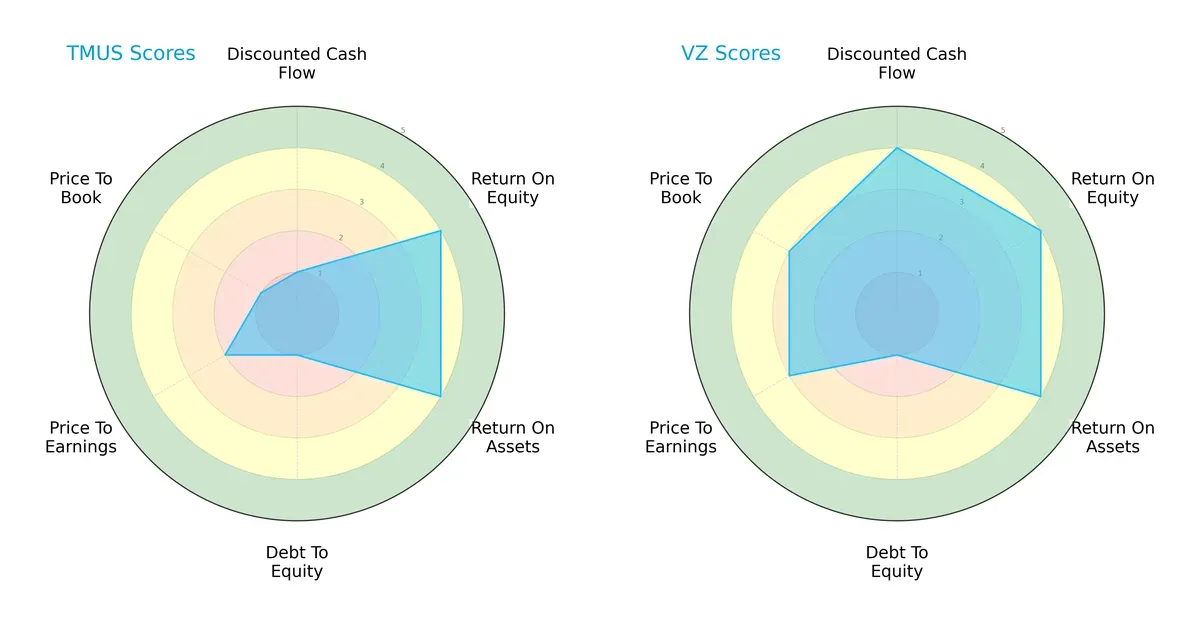
Verizon demonstrates a stronger DCF score (4 vs. 1) and better valuation metrics (P/E 3 vs. 2; P/B 3 vs. 1), reflecting a more balanced financial profile. Both firms share high ROE and ROA scores (4 each), indicating efficient profit generation and asset use. However, each holds a pronounced weakness in debt management with a very unfavorable Debt/Equity score of 1. T-Mobile relies heavily on operational efficiency but suffers from poor cash flow and valuation scores, signaling riskier capital allocation.
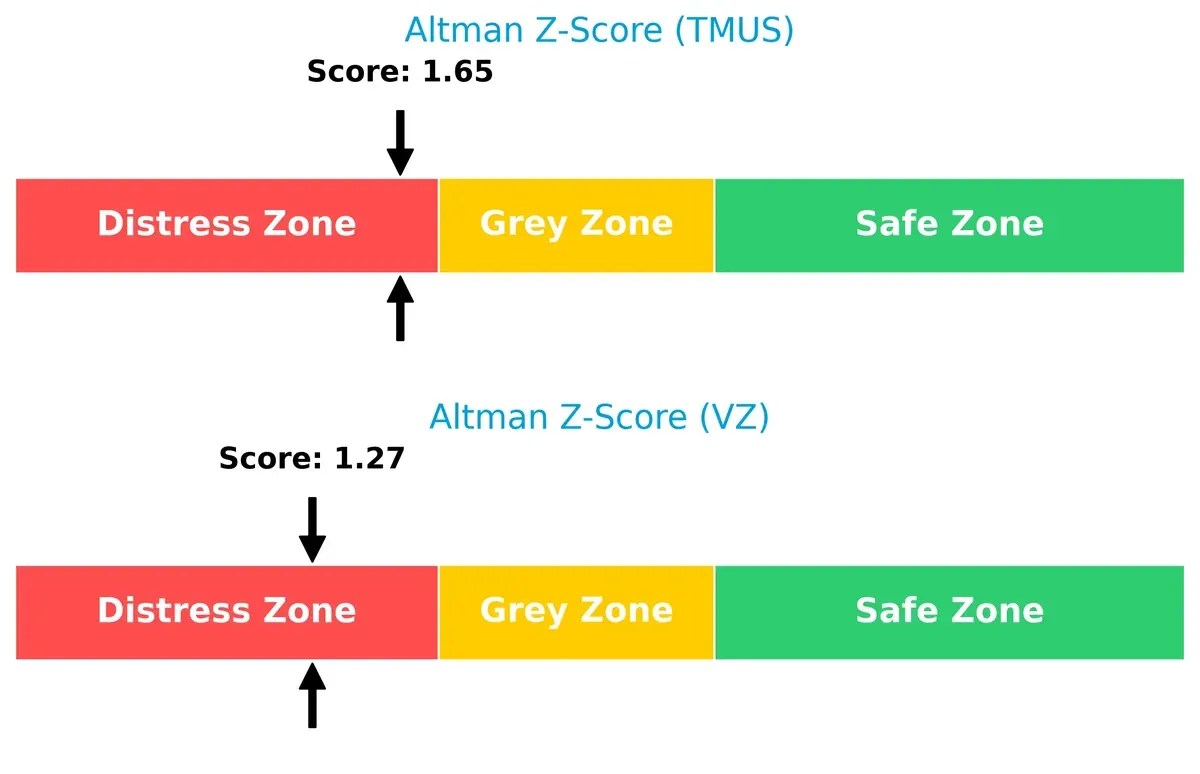
Bankruptcy Risk: Solvency Showdown
Verizon and T-Mobile both face distress zone Altman Z-Scores, with Verizon at 1.27 and T-Mobile slightly higher at 1.65, suggesting significant solvency risk in this cycle:
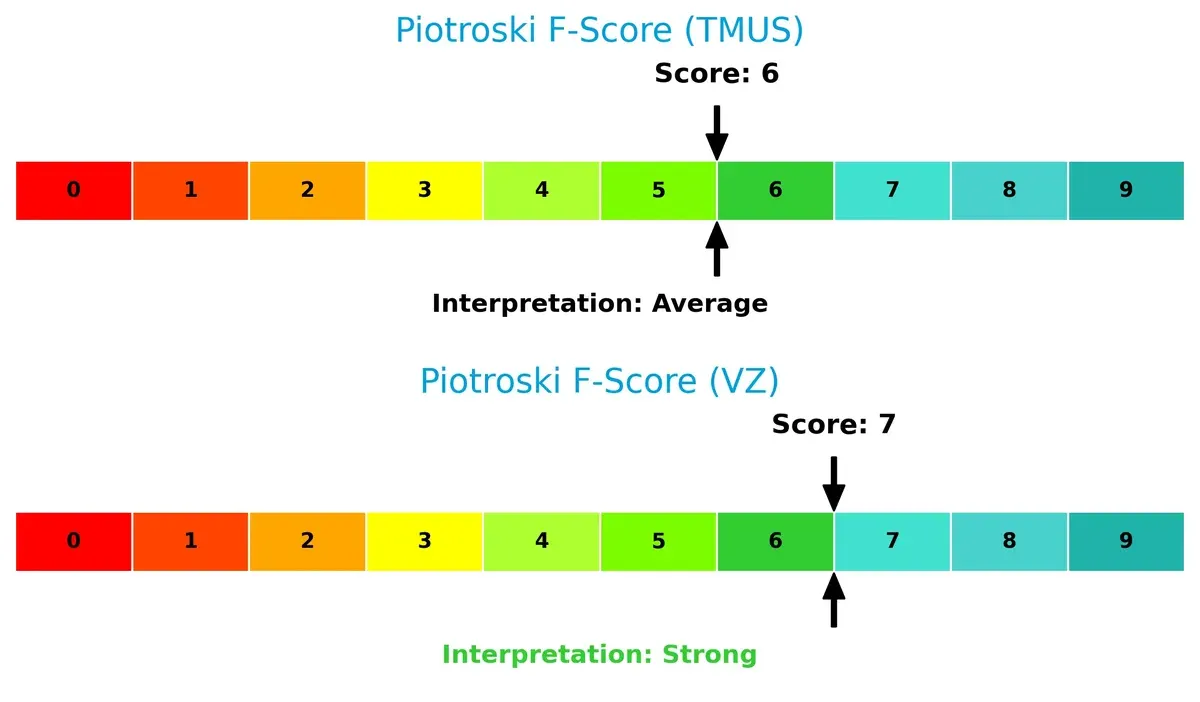
Financial Health: Quality of Operations
Verizon edges ahead with a Piotroski F-Score of 7, indicating strong financial health. T-Mobile’s score of 6 is average, raising moderate concerns about its internal financial strength:
How are the two companies positioned?
This section dissects TMUS and VZ’s operational DNA by comparing revenue distribution and internal dynamics. The goal is to confront their economic moats and identify which model offers the most resilient competitive advantage today.
Revenue Segmentation: The Strategic Mix
The following visual comparison dissects how T-Mobile US, Inc. and Verizon Communications Inc. diversify their income streams and where their primary sector bets lie:
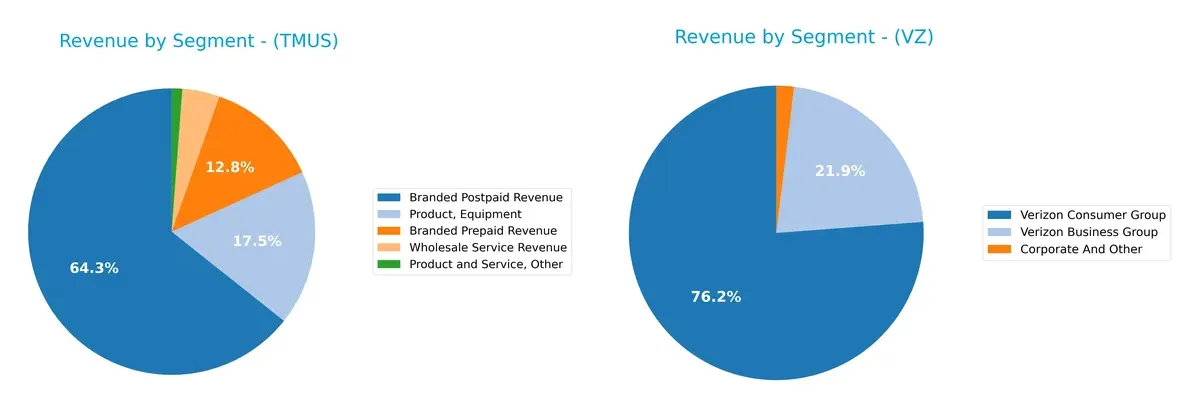
T-Mobile pivots heavily on Branded Postpaid revenue with $52.3B, supported by significant Equipment sales at $14.3B, showing moderate diversification. Verizon relies predominantly on its Consumer Group at $103B, dwarfing its Business Group’s $29.5B. Verizon’s concentration in consumer services signals infrastructure dominance but exposes it to consumer market shifts. T-Mobile’s mix suggests a balanced approach with less single-segment risk but greater exposure to equipment cycles.
Strengths and Weaknesses Comparison
This table compares the strengths and weaknesses of T-Mobile US, Inc. and Verizon Communications Inc.:
TMUS Strengths
- Favorable net margin at 13.93%
- Strong ROE at 18.37%
- WACC lower than ROIC, indicating value creation
- Interest coverage solid at 5.31
- Diverse revenue streams including branded postpaid and prepaid
- Significant equipment sales supporting revenue
VZ Strengths
- Favorable net margin at 12.43%
- Strong ROE at 16.44%
- Lower WACC at 4.07% supporting capital efficiency
- Favorable P/E ratio of 10.02
- Large, diversified revenue from business and consumer groups
- Higher dividend yield at 6.67% providing shareholder returns
TMUS Weaknesses
- Unfavorable PB ratio at 4.18 indicating possible overvaluation
- Current ratio below 1 at 0.91 signaling liquidity risk
- High debt-to-assets at 54.99% increasing financial leverage
- Unfavorable asset turnover at 0.39 reflecting efficiency challenges
- Elevated debt-to-equity at 1.85 increasing financial risk
VZ Weaknesses
- Current ratio below 1 at 0.91 indicating liquidity constraints
- Unfavorable debt-to-equity at 1.92 raising leverage concerns
- Asset turnover low at 0.34 showing weaker asset utilization
- Interest coverage moderate at 4.39 possibly limiting margin for debt costs
- Neutral PB at 1.65 suggesting market values stock fairly
Both companies show solid profitability and capital efficiency, leveraging diversified revenue streams. However, liquidity and leverage metrics highlight financial risks that each must manage carefully to sustain competitive positioning and strategic flexibility.
The Moat Duel: Analyzing Competitive Defensibility
A structural moat alone shields long-term profits from relentless competitive pressures and market dynamics. Here’s how two telecom giants stack up:
T-Mobile US, Inc.: Disruptive Cost Advantage
T-Mobile’s primary moat lies in its cost advantage fueled by lean operations and aggressive pricing. This translates into a robust ROIC growing 157% over five years, underpinning margin stability. New 5G expansions may deepen this moat further in 2026.
Verizon Communications Inc.: Network Scale & Brand Strength
Verizon’s moat centers on its vast network infrastructure and brand recognition, contrasting with T-Mobile’s cost edge. Despite a solid ROIC above WACC, its profitability is declining, signaling margin pressure. Diversification into enterprise services offers growth but faces stiff competition.
Verdict: Cost Efficiency vs. Network Dominance
T-Mobile wields a wider and deepening moat due to accelerating ROIC and margin expansion. Verizon’s scale is formidable but hampered by declining returns. I see T-Mobile better positioned to defend and grow market share in the evolving telecom landscape.
Which stock offers better returns?
The past year reveals distinct price movements: T-Mobile US shows strong gains with recent pullback, while Verizon Communications accelerates steadily with notable upside momentum.
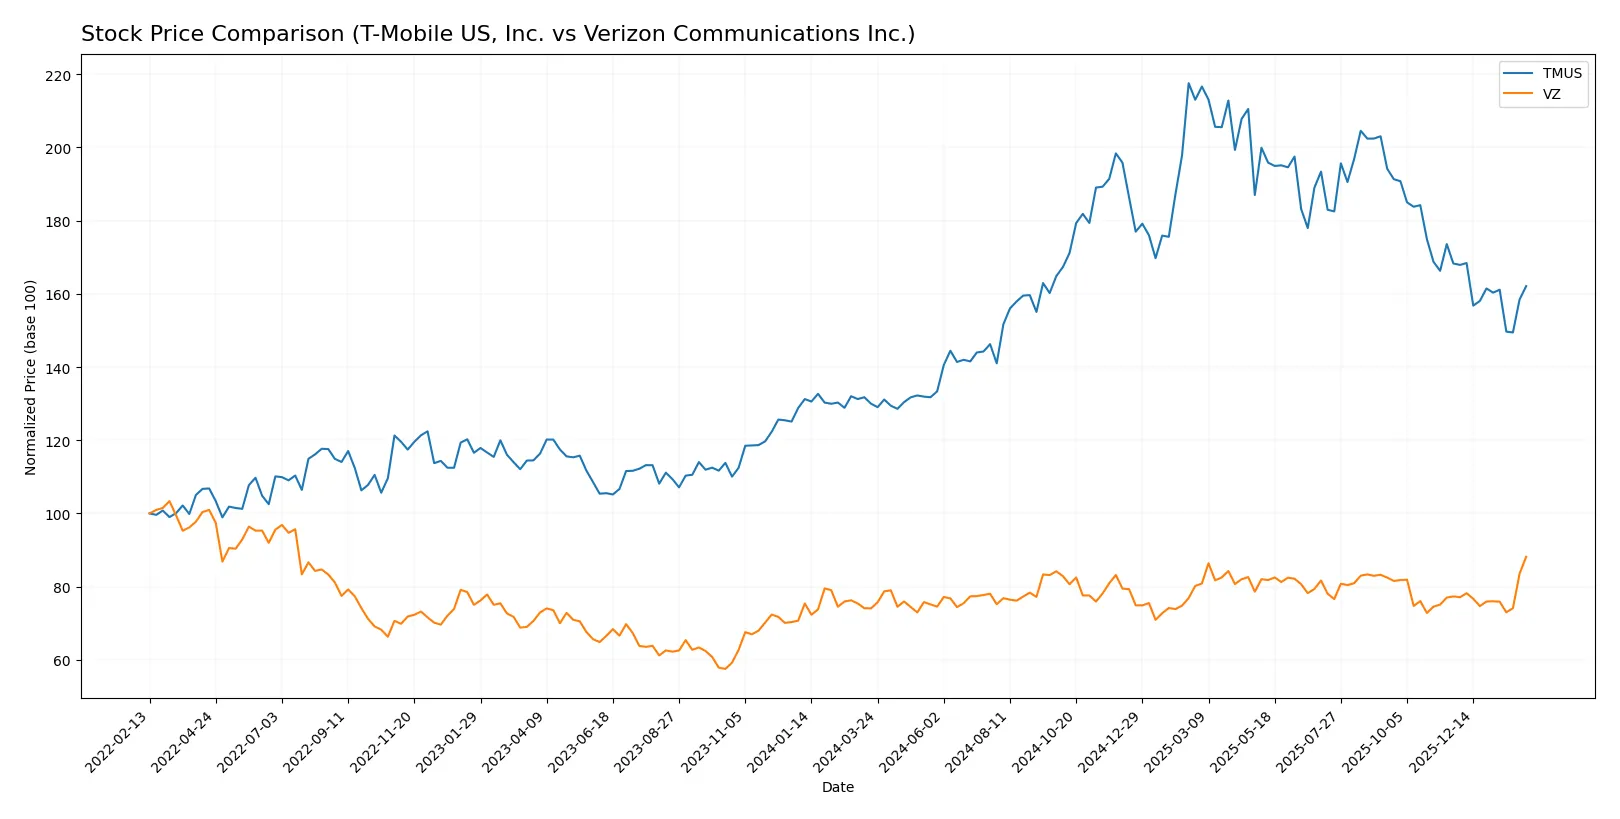
Trend Comparison
T-Mobile US’s stock rose 24.7% over the past 12 months, signaling a bullish trend despite recent deceleration and a 3.7% drop since November 2025. Volatility remains high with a 30.65 standard deviation.
Verizon Communications gained 19% over 12 months, also bullish with accelerating momentum. Recent gains of 14% since late 2025 reflect steady upward slope and low volatility at a 1.87 standard deviation.
T-Mobile US outperformed Verizon overall despite recent weakness, delivering the highest market return over the 12-month span analyzed.
Target Prices
Analysts present a clear consensus on target prices for key telecom players in 2026.
| Company | Target Low | Target High | Consensus |
|---|---|---|---|
| T-Mobile US, Inc. | 225 | 310 | 260.75 |
| Verizon Communications Inc. | 44 | 54 | 48.28 |
The target consensus for T-Mobile exceeds its current price of 201.79 by nearly 29%, signaling bullish analyst expectations. Verizon’s target consensus at 48.28 is just above its current 47.01, suggesting modest upside potential.

Don’t Let Luck Decide Your Entry Point
Optimize your entry points with our advanced ProRealTime indicators. You’ll get efficient buy signals with precise price targets for maximum performance. Start outperforming now!
How do institutions grade them?
T-Mobile US, Inc. Grades
The following table summarizes recent grades from major financial institutions for T-Mobile US, Inc.:
| Grading Company | Action | New Grade | Date |
|---|---|---|---|
| Wells Fargo | Maintain | Overweight | 2026-01-26 |
| Bernstein | Maintain | Market Perform | 2026-01-16 |
| Citigroup | Maintain | Neutral | 2025-12-19 |
| Goldman Sachs | Maintain | Buy | 2025-12-12 |
| Morgan Stanley | Maintain | Overweight | 2025-12-10 |
| Argus Research | Maintain | Buy | 2025-12-09 |
| Keybanc | Upgrade | Sector Weight | 2025-12-02 |
| Oppenheimer | Downgrade | Perform | 2025-11-21 |
| Tigress Financial | Maintain | Buy | 2025-11-11 |
| Morgan Stanley | Maintain | Overweight | 2025-10-27 |
Verizon Communications Inc. Grades
Below are recent grades from established grading firms for Verizon Communications Inc.:
| Grading Company | Action | New Grade | Date |
|---|---|---|---|
| JP Morgan | Maintain | Neutral | 2026-02-03 |
| Citigroup | Maintain | Buy | 2026-02-03 |
| RBC Capital | Maintain | Sector Perform | 2026-02-03 |
| Morgan Stanley | Maintain | Equal Weight | 2026-02-02 |
| Wells Fargo | Maintain | Equal Weight | 2026-02-02 |
| Evercore ISI Group | Maintain | Outperform | 2026-02-02 |
| Scotiabank | Maintain | Sector Perform | 2026-02-02 |
| Wells Fargo | Maintain | Equal Weight | 2026-01-26 |
| Bernstein | Maintain | Market Perform | 2026-01-16 |
| Morgan Stanley | Maintain | Equal Weight | 2025-12-10 |
Which company has the best grades?
T-Mobile US, Inc. generally receives more bullish grades, including multiple Buy and Overweight ratings. Verizon Communications Inc. mostly holds Neutral to Equal Weight grades with fewer Buy or Outperform calls. This suggests investors might perceive T-Mobile as having stronger near-term potential, though risks remain for both.
Risks specific to each company
The following categories spotlight critical pressure points and systemic threats confronting T-Mobile US, Inc. and Verizon Communications Inc. in the 2026 market environment:
1. Market & Competition
T-Mobile US, Inc.
- Faces intense competition with aggressive pricing and innovation from rivals; market share gains depend on network expansion and 5G leadership.
Verizon Communications Inc.
- Competes on scale and enterprise solutions but risks losing ground to nimble competitors; brand loyalty stable but challenged by price wars.
2. Capital Structure & Debt
T-Mobile US, Inc.
- High debt-to-equity ratio at 1.85 signals leverage risk; interest coverage of 5.31 cushions short-term pressures.
Verizon Communications Inc.
- Slightly higher debt-to-equity at 1.92 with weaker interest coverage at 4.39; manageable but warrants caution.
3. Stock Volatility
T-Mobile US, Inc.
- Beta of 0.435 indicates moderate stock volatility, implying relative stability amid telecom sector fluctuations.
Verizon Communications Inc.
- Lower beta of 0.316 suggests less price volatility, appealing for conservative investors seeking steady returns.
4. Regulatory & Legal
T-Mobile US, Inc.
- Regulatory scrutiny on spectrum acquisition and competition law remains a risk; past merger approvals add complexity.
Verizon Communications Inc.
- Faces ongoing regulatory challenges in net neutrality and privacy; compliance costs may rise with evolving laws.
5. Supply Chain & Operations
T-Mobile US, Inc.
- Network expansion depends on securing hardware and technology supply; recent chip shortages have tightened timelines.
Verizon Communications Inc.
- Large-scale operations diversify supply risks but complex logistics and legacy infrastructure may slow agility.
6. ESG & Climate Transition
T-Mobile US, Inc.
- Faces pressure to reduce carbon footprint in network operations; ESG initiatives progressing but need acceleration.
Verizon Communications Inc.
- Strong ESG programs in place; climate transition risks mitigated by investments in renewable energy and sustainable practices.
7. Geopolitical Exposure
T-Mobile US, Inc.
- Primarily US-focused, limiting geopolitical risk but vulnerable to domestic policy shifts and trade tensions.
Verizon Communications Inc.
- Global footprint exposes Verizon to international risks, including regulatory changes and geopolitical tensions affecting supply chains.
Which company shows a better risk-adjusted profile?
Verizon’s strongest risk lies in its elevated leverage and regulatory complexities, while T-Mobile contends with capital structure pressure and competitive intensity. Verizon’s superior Piotroski score and slightly favorable financial ratios suggest a marginally better risk-adjusted profile. Yet, both firms remain in the Altman Z-score distress zone, highlighting persistent financial vulnerability. Notably, T-Mobile’s unfavorable debt metrics and asset turnover raise red flags about operational efficiency under debt strain.
Final Verdict: Which stock to choose?
T-Mobile US, Inc. wields a clear superpower in its rapidly growing profitability and expanding return on invested capital, signaling a strong growth engine. Its main point of vigilance is its heavy reliance on intangible assets and leverage, which could pressure financial flexibility. It fits well in aggressive growth portfolios seeking dynamic expansion.
Verizon Communications Inc. commands a strategic moat through its entrenched network infrastructure and steady cash flow generation, offering a defensive edge. Compared to T-Mobile, Verizon provides a stronger value proposition with a more attractive valuation and safer dividend profile. It suits GARP investors who prize stability with moderate growth.
If you prioritize aggressive growth and rising profitability, T-Mobile outshines due to its expanding ROIC and accelerating income trends. However, if you seek better valuation and income stability, Verizon offers a compelling scenario with a durable moat and less volatile price action. Each appeals to distinct investor profiles balancing growth and risk.
Disclaimer: Investment carries a risk of loss of initial capital. The past performance is not a reliable indicator of future results. Be sure to understand risks before making an investment decision.
Go Further
I encourage you to read the complete analyses of T-Mobile US, Inc. and Verizon Communications Inc. to enhance your investment decisions: