Sysco Corporation and US Foods Holding Corp. are two leading players in the competitive food distribution industry, serving a broad range of foodservice customers across the United States. Both companies focus on innovation and operational efficiency to capture market share in this essential sector. This article will analyze their strengths and risks to help you decide which company could be the best addition to your investment portfolio.
Table of contents
Companies Overview
I will begin the comparison between Sysco Corporation and US Foods Holding Corp. by providing an overview of these two companies and their main differences.
Sysco Corporation Overview
Sysco Corporation focuses on marketing and distributing a wide range of food and related products primarily to the foodservice industry across the US, Canada, the UK, France, and internationally. The company operates through multiple segments, supplying frozen, canned, fresh, and dairy products, along with non-food items like paper products and kitchen equipment. Sysco’s extensive network includes 343 distribution facilities, supporting restaurants, hospitals, schools, and other venues.
US Foods Holding Corp. Overview
US Foods Holding Corp. markets and distributes fresh, frozen, dry food, and non-food products to diverse foodservice customers across the United States. Its clientele includes independent restaurants, national chains, hospitals, government organizations, and retail locations. Operating 70 broadline and 80 cash and carry facilities, US Foods serves a broad market with a focus on foodservice distribution, headquartered in Rosemont, Illinois, with a workforce of approximately 30,000 employees.
Key similarities and differences
Both Sysco and US Foods operate in the food distribution industry, targeting foodservice clients such as restaurants and healthcare facilities. Sysco has a larger market cap of about 36B USD and broader international reach compared to US Foods’ 17B USD market cap and primarily US-based operations. While both offer food and non-food products, Sysco’s scale and facility count significantly exceed US Foods, reflecting differences in geographic scope and operational scale.
Income Statement Comparison
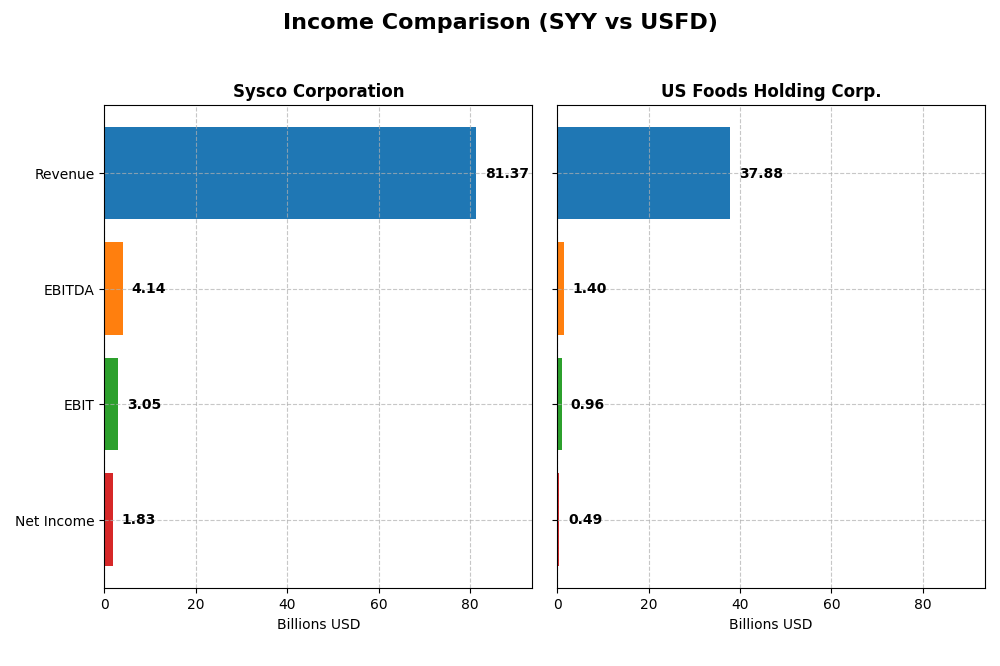
The table below presents a side-by-side comparison of key income statement metrics for Sysco Corporation and US Foods Holding Corp. for their most recent fiscal years.
| Metric | Sysco Corporation (SYY) | US Foods Holding Corp. (USFD) |
|---|---|---|
| Market Cap | 36.0B | 17.2B |
| Revenue | 81.4B | 37.9B |
| EBITDA | 4.1B | 1.4B |
| EBIT | 3.1B | 959M |
| Net Income | 1.8B | 494M |
| EPS | 3.74 | 2.05 |
| Fiscal Year | 2025 | 2024 |
Income Statement Interpretations
Sysco Corporation
Sysco’s revenue and net income exhibited consistent growth from 2021 to 2025, with revenue rising from 51.3B to 81.4B and net income from 524M to 1.83B. Margins showed relative stability, with a gross margin near 18.4% and net margin around 2.25%. The latest year saw revenue growth slow to 3.2%, while net income and EBIT margins declined slightly, indicating margin pressure.
US Foods Holding Corp.
US Foods demonstrated robust revenue growth from 22.9B in 2020 to 37.9B in 2024, alongside an increase in net income from a loss of 226M to 494M. Margins remained stable, with a gross margin of 17.25% and net margin of 1.3%. The most recent year showed a 6.4% revenue increase, but EBIT and net margin contracted, reflecting some operational challenges despite overall improvement.
Which one has the stronger fundamentals?
Both companies show favorable long-term revenue and net income growth, with US Foods posting higher overall margin improvements and a stronger recovery from prior losses. Sysco maintains higher absolute revenue and net income levels with stable margins, while US Foods benefits from more favorable cost control trends. Each exhibits mixed recent margin trends, making fundamentals relatively balanced but context-dependent.
Financial Ratios Comparison
The table below compares the most recent key financial ratios of Sysco Corporation (SYY) and US Foods Holding Corp. (USFD), reflecting their fiscal year 2025 and 2024 results respectively.
| Ratios | Sysco Corporation (SYY) FY 2025 | US Foods Holding Corp. (USFD) FY 2024 |
|---|---|---|
| ROE | 99.9% | 10.9% |
| ROIC | 13.0% | 8.0% |
| P/E | 20.0 | 33.3 |
| P/B | 20.0 | 3.63 |
| Current Ratio | 1.21 | 1.21 |
| Quick Ratio | 0.70 | 0.71 |
| D/E | 7.92 | 1.20 |
| Debt-to-Assets | 54.1% | 40.4% |
| Interest Coverage | 4.86 | 3.49 |
| Asset Turnover | 3.04 | 2.82 |
| Fixed Asset Turnover | 11.28 | 15.80 |
| Payout ratio | 54.7% | 0% |
| Dividend yield | 2.73% | 0% |
Interpretation of the Ratios
Sysco Corporation
Sysco shows a mix of strengths and weaknesses in its ratios. Notably, it has a very high return on equity (99.89%) and return on invested capital (13.03%), indicating efficient capital use. However, concerns arise from its unfavorable net margin (2.25%) and high debt-related metrics, including a debt-to-equity ratio of 7.92 and debt-to-assets at 54.13%. Its dividend yield is favorable at 2.73%, supported by a manageable payout ratio and consistent dividend payments, reflecting a shareholder-friendly return policy.
US Foods Holding Corp.
US Foods presents weaker ratio results overall, with a low net margin of 1.3% and neutral returns on equity (10.91%) and invested capital (8.02%). Its elevated price-to-earnings ratio of 33.26 and unfavorable debt metrics such as debt-to-equity at 1.2 raise some concerns. The company does not pay dividends, likely prioritizing reinvestment or managing growth, which limits direct shareholder returns and suggests a focus on operational improvement over immediate distributions.
Which one has the best ratios?
Sysco Corporation exhibits a more favorable ratio profile with stronger profitability and returns, despite some leverage concerns. Meanwhile, US Foods shows a higher proportion of unfavorable ratios and no dividend yield, reflecting a more cautious investor outlook. Based solely on the ratio evaluations, Sysco appears to be in a relatively better financial position than US Foods.
Strategic Positioning
This section compares the strategic positioning of Sysco Corporation and US Foods Holding Corp. in terms of Market position, Key segments, and Exposure to technological disruption:
Sysco Corporation
- Largest market cap in food distribution, facing moderate competitive pressure (36B).
- Diverse product portfolio including meats, dairy, produce, equipment, and disposables.
- No explicit mention of technological disruption exposure in the data provided.
US Foods Holding Corp.
- Smaller market cap with higher beta, indicating more market volatility and pressure (17B).
- Broadline foodservice products with fresh, frozen, dry foods, and cash & carry locations.
- No explicit mention of technological disruption exposure in the data provided.
Sysco Corporation vs US Foods Holding Corp. Positioning
Sysco operates a highly diversified product range and a larger distribution network, while US Foods focuses on broadline services with fewer facilities. Sysco’s scale offers broader market coverage; US Foods has a more concentrated footprint but with multiple service channels.
Which has the best competitive advantage?
Sysco exhibits a very favorable moat with ROIC well above WACC and growing profitability, indicating a durable competitive advantage. US Foods shows only a slightly favorable moat, with ROIC near WACC but improving, suggesting less established competitive strength.
Stock Comparison
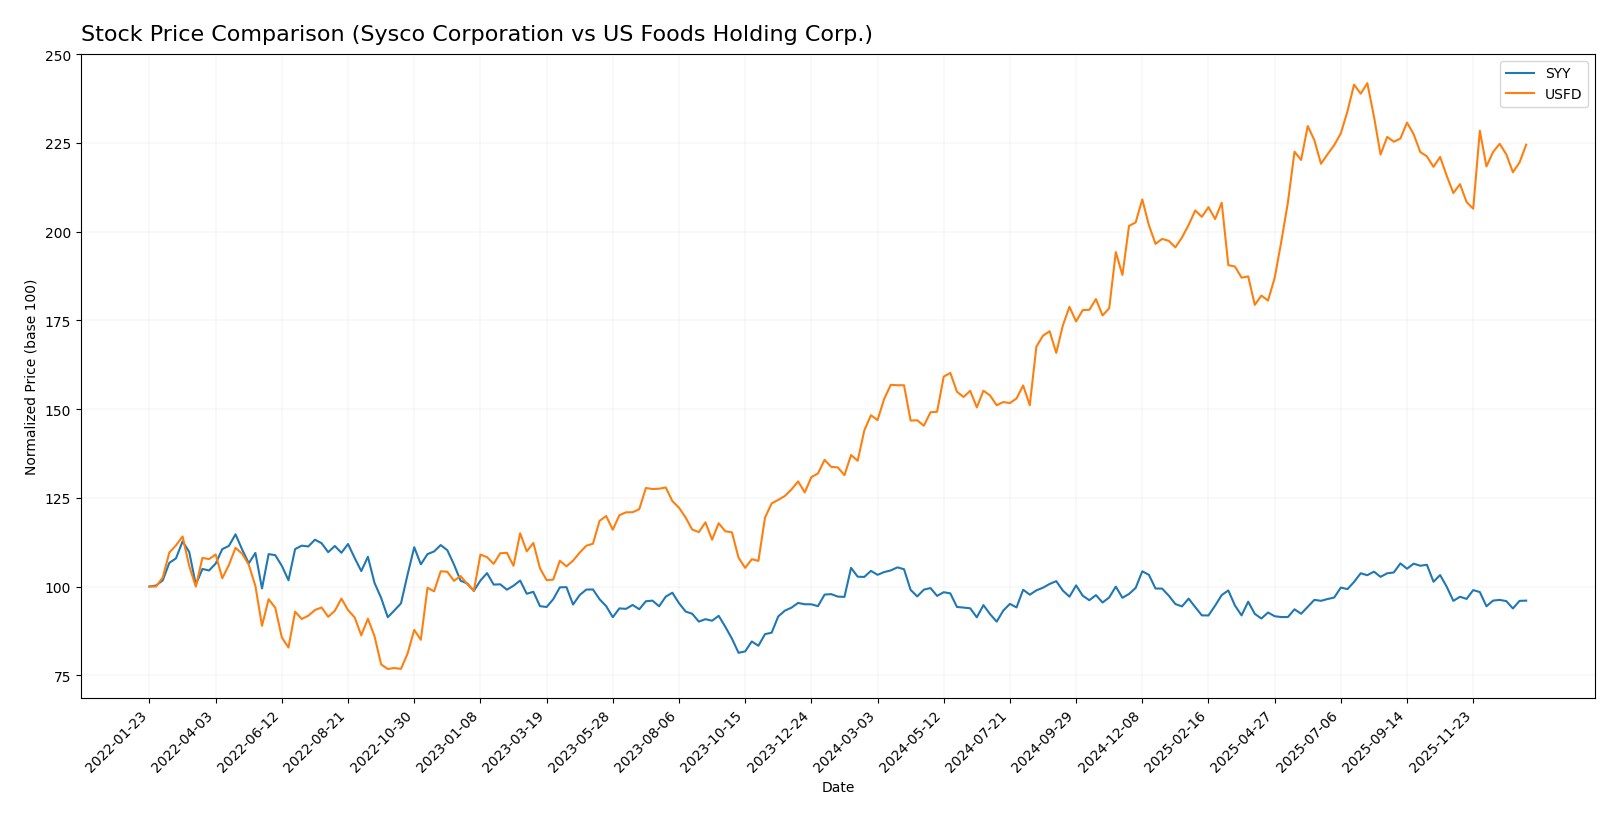
The past year revealed contrasting stock movements between Sysco Corporation and US Foods Holding Corp., with Sysco showing a decelerating bearish trend while US Foods demonstrated accelerating bullish momentum.
Trend Analysis
Sysco Corporation’s stock declined by 8.03% over the past 12 months, indicating a bearish trend with deceleration and moderate volatility (3.23 std deviation). The stock ranged between 69.75 and 82.45.
US Foods Holding Corp. experienced a 51.41% gain over the same period, reflecting a bullish trend with acceleration and higher volatility (9.99 std deviation). Its price fluctuated from 50.04 to 83.28.
Comparing both, US Foods Holding Corp. delivered the highest market performance with a strong bullish trend, significantly outperforming Sysco’s bearish trajectory.
Target Prices
Here is the current consensus target price overview for the key players in the food distribution sector.
| Company | Target High | Target Low | Consensus |
|---|---|---|---|
| Sysco Corporation | 90 | 80 | 86.29 |
| US Foods Holding Corp. | 95 | 85 | 89.33 |
Analysts expect both Sysco and US Foods to appreciate from current prices, indicating moderate upside potential with consensus targets significantly above their trading prices of $74.33 and $77.31 respectively.
Analyst Opinions Comparison
This section compares analysts’ ratings and financial scores for Sysco Corporation and US Foods Holding Corp.:
Rating Comparison
Sysco Corporation Rating
- Rating: B, indicating a very favorable overall assessment.
- Discounted Cash Flow Score: 4, showing a favorable valuation.
- ROE Score: 5, a very favorable measure of profit efficiency.
- ROA Score: 4, favorable asset utilization.
- Debt To Equity Score: 1, very unfavorable due to high leverage.
- Overall Score: 3, reflecting a moderate overall financial health.
US Foods Holding Corp. Rating
- Rating: B-, also considered very favorable but slightly lower.
- Discounted Cash Flow Score: 3, indicating a moderate valuation.
- ROE Score: 4, favorable but below Sysco’s level.
- ROA Score: 3, moderate effectiveness in asset use.
- Debt To Equity Score: 1, also very unfavorable financial risk.
- Overall Score: 3, similarly moderate overall financial health.
Which one is the best rated?
Based strictly on the provided data, Sysco Corporation has a higher rating and stronger scores in discounted cash flow, ROE, and ROA compared to US Foods Holding Corp., despite both sharing the same overall and debt-to-equity scores.
Scores Comparison
Here is a comparison of the Altman Z-Score and Piotroski Score for Sysco Corporation and US Foods Holding Corp.:
SYY Scores
- Altman Z-Score of 5.04 indicates a safe zone status.
- Piotroski Score of 7 denotes strong financial health.
USFD Scores
- Altman Z-Score of 4.34 places the company in the safe zone.
- Piotroski Score of 7 also reflects strong financial health.
Which company has the best scores?
Both SYY and USFD have Altman Z-Scores in the safe zone and identical Piotroski Scores of 7, reflecting similarly strong financial health and low bankruptcy risk based on the provided data.
Grades Comparison
The grades from reputable financial institutions for Sysco Corporation and US Foods Holding Corp. are as follows:
Sysco Corporation Grades
This table summarizes recent grades issued by well-known grading companies for Sysco Corporation.
| Grading Company | Action | New Grade | Date |
|---|---|---|---|
| Citigroup | Maintain | Neutral | 2026-01-07 |
| Barclays | Maintain | Overweight | 2026-01-07 |
| Piper Sandler | Maintain | Neutral | 2025-12-12 |
| Citigroup | Maintain | Neutral | 2025-11-03 |
| Barclays | Maintain | Overweight | 2025-10-29 |
| Citigroup | Maintain | Neutral | 2025-10-15 |
| Guggenheim | Maintain | Buy | 2025-10-06 |
| Guggenheim | Maintain | Buy | 2025-08-06 |
| Guggenheim | Maintain | Buy | 2025-07-31 |
| Barclays | Maintain | Overweight | 2025-07-30 |
Sysco’s grades consistently reflect a neutral to overweight/buy consensus, indicating steady analyst confidence with no recent downgrades.
US Foods Holding Corp. Grades
This table presents recent grades from established grading companies for US Foods Holding Corp.
| Grading Company | Action | New Grade | Date |
|---|---|---|---|
| Citigroup | Maintain | Buy | 2026-01-07 |
| Barclays | Maintain | Overweight | 2025-11-07 |
| Piper Sandler | Maintain | Overweight | 2025-09-02 |
| Guggenheim | Maintain | Buy | 2025-08-11 |
| Wells Fargo | Maintain | Overweight | 2025-08-08 |
| UBS | Maintain | Buy | 2025-07-28 |
| Morgan Stanley | Maintain | Overweight | 2025-07-14 |
| JP Morgan | Maintain | Neutral | 2025-06-25 |
| Barclays | Maintain | Overweight | 2025-06-04 |
| JP Morgan | Maintain | Neutral | 2025-05-20 |
US Foods’ grades exhibit a strong buy/overweight bias, with multiple top-tier institutions maintaining positive ratings throughout 2025 and early 2026.
Which company has the best grades?
Both Sysco and US Foods have a consensus “Buy” rating; however, US Foods shows a higher proportion of buy and overweight grades from major analysts, suggesting comparatively stronger market endorsement. This may influence investor confidence and perceived growth potential.
Strengths and Weaknesses
Below is a comparison table highlighting the strengths and weaknesses of Sysco Corporation (SYY) and US Foods Holding Corp. (USFD) based on the most recent financial and operational data.
| Criterion | Sysco Corporation (SYY) | US Foods Holding Corp. (USFD) |
|---|---|---|
| Diversification | Highly diversified product portfolio with strong sales in meats, dairy, produce, and frozen goods totaling over 66B USD annually. | Diversified but with heavier reliance on Product One (approx. 13B USD), less broad product base. |
| Profitability | Favorable ROIC at 13.0%, ROE near 100%, but low net margin (2.25%) and some liquidity concerns. | Moderate ROIC around 8.0%, lower net margin (1.3%), neutral ROE and weaker liquidity ratios. |
| Innovation | Demonstrates a durable competitive advantage with growing ROIC and efficient capital use. | Growing ROIC indicates improving profitability, but currently lacks a strong competitive moat. |
| Global presence | Strong global footprint with varied product lines and steady revenue growth over years. | Primarily focused on the US market, less global reach compared to Sysco. |
| Market Share | Large and stable market share in foodservice distribution; consistent revenue growth in core segments. | Smaller market share relative to Sysco; revenue growth is positive but more concentrated. |
Sysco shows a robust and diversified business model with strong profitability metrics and a durable competitive advantage. US Foods is improving but still trails in profitability and diversification, highlighting the need for cautious optimism when investing.
Risk Analysis
Below is a comparative table highlighting the key risks associated with Sysco Corporation (SYY) and US Foods Holding Corp. (USFD) based on the most recent financial data:
| Metric | Sysco Corporation (SYY) | US Foods Holding Corp. (USFD) |
|---|---|---|
| Market Risk | Moderate (Beta 0.618) | Higher (Beta 1.034) |
| Debt level | High (D/E 7.92, Debt/Assets 54.13%) | Moderate (D/E 1.2, Debt/Assets 40.44%) |
| Regulatory Risk | Moderate (Food distribution compliance) | Moderate (Foodservice regulations) |
| Operational Risk | Moderate (Extensive distribution network) | Moderate (Fewer facilities, but complex supply chain) |
| Environmental Risk | Moderate (Supply chain sustainability) | Moderate (Similar industry impacts) |
| Geopolitical Risk | Low to Moderate (International presence) | Low (Primarily US-focused) |
The most impactful risks are the high debt levels in both companies, especially Sysco’s elevated leverage, which could pressure financial stability despite solid operational performance. Market risk is also notable for US Foods due to higher beta, indicating more volatility. Both face moderate regulatory and operational risks typical of the food distribution sector.
Which Stock to Choose?
Sysco Corporation (SYY) shows a favorable income evolution with 58.62% revenue growth and 248.72% net income growth over five years. Its financial ratios are slightly favorable overall, marked by strong ROE (99.89%) and ROIC (13.03%). Despite a high debt-to-equity ratio and some unfavorable liquidity ratios, SYY maintains very favorable ratings and a very favorable moat, reflecting durable competitive advantage and efficient capital use.
US Foods Holding Corp. (USFD) presents a solid income growth of 65.51% in revenue and 318.58% in net income over five years, with a slightly favorable income statement. Its financial ratios are slightly unfavorable overall, with moderate ROE (10.91%) and ROIC (8.02%), and some financial risk indicated by debt ratios. Although USFD has slightly favorable ratings and a slightly favorable moat status, it appears to be shedding value but improving profitability.
Considering ratings and comprehensive financial evaluations, SYY might appear more attractive to investors prioritizing stability and durable competitive advantage, while USFD could appeal to those with a tolerance for risk seeking growth potential in improving profitability. The choice could depend on individual investor profiles and risk preferences.
Disclaimer: Investment carries a risk of loss of initial capital. The past performance is not a reliable indicator of future results. Be sure to understand risks before making an investment decision.
Go Further
I encourage you to read the complete analyses of Sysco Corporation and US Foods Holding Corp. to enhance your investment decisions: