In the fast-evolving technology sector, Synopsys, Inc. (SNPS) and VeriSign, Inc. (VRSN) stand out as key players in software infrastructure. Synopsys excels in electronic design automation and semiconductor IP, while VeriSign anchors internet security through domain registry services. Both companies leverage innovation to shape digital foundations, making their comparison essential for investors seeking growth and stability. This article will help you decide which company best fits your investment portfolio.
Table of contents
Companies Overview
I will begin the comparison between Synopsys, Inc. and VeriSign, Inc. by providing an overview of these two companies and their main differences.
Synopsys Overview
Synopsys, Inc. focuses on electronic design automation software products for integrated circuits. The company offers a range of platforms and intellectual property solutions aimed at digital design, verification, and system-on-chip architecture. It serves diverse industries including electronics, automotive, and energy, and employs around 20,000 people from its headquarters in Mountain View, California.
VeriSign Overview
VeriSign, Inc. provides domain name registry services and internet infrastructure to support global internet navigation. It operates critical internet root servers and manages domain registration for .com, .net, and other domains. With about 929 employees, VeriSign is headquartered in Reston, Virginia, and emphasizes security, stability, and resiliency of internet services worldwide.
Key similarities and differences
Both companies operate within the technology sector and software infrastructure industry. Synopsys specializes in electronic design automation and IP solutions for integrated circuits, while VeriSign focuses on domain registry and internet infrastructure services. Synopsys employs a significantly larger workforce and targets multiple industrial sectors, whereas VeriSign concentrates on internet navigation and domain management with a smaller team.
Income Statement Comparison
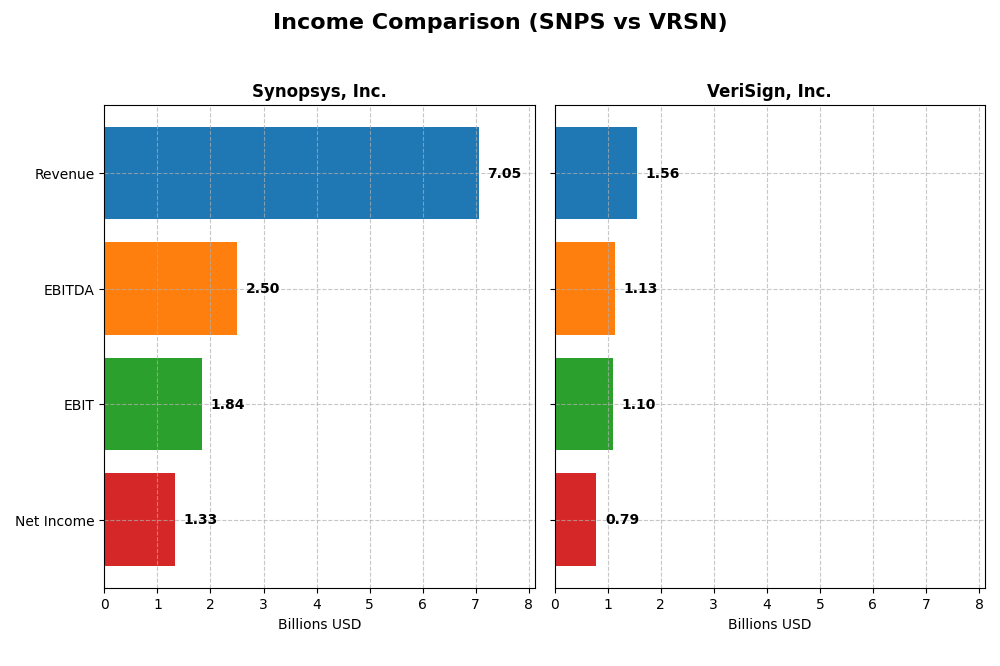
The table below compares the most recent full fiscal year income statement metrics for Synopsys, Inc. and VeriSign, Inc., providing a snapshot of their financial performance.
| Metric | Synopsys, Inc. (SNPS) | VeriSign, Inc. (VRSN) |
|---|---|---|
| Market Cap | 98.8B | 23.1B |
| Revenue | 7.05B | 1.56B |
| EBITDA | 2.50B | 1.13B |
| EBIT | 1.84B | 1.10B |
| Net Income | 1.33B | 786M |
| EPS | 8.13 | 8.01 |
| Fiscal Year | 2025 | 2024 |
Income Statement Interpretations
Synopsys, Inc.
From 2021 to 2025, Synopsys, Inc. showed a strong upward trend in revenue, growing 67.8% overall, with net income rising 75.9%. Gross and EBIT margins remained favorable, around 77% and 26%, respectively. However, in 2025, revenue growth accelerated by 15.1%, but net margin and EPS declined sharply, indicating margin compression despite top-line strength.
VeriSign, Inc.
VeriSign exhibited moderate revenue growth of 23.1% across 2020–2024, with net income slightly declining by 3.6%. Margins were consistently robust, particularly gross margin near 88% and net margin exceeding 50%. The latest year saw modest revenue growth of 4.3%, but net margin contracted by nearly 8%, signaling some profitability pressures despite stable operational efficiency.
Which one has the stronger fundamentals?
Both companies maintain favorable income statement profiles, yet Synopsys’s higher growth rates in revenue and net income contrast with VeriSign’s superior margin levels and steadier profitability. Synopsys faces margin challenges in the latest year, while VeriSign experiences slight net income decline. Overall, Synopsys offers stronger growth dynamics, whereas VeriSign demonstrates more robust margin fundamentals.
Financial Ratios Comparison
The table below presents a side-by-side comparison of key financial ratios for Synopsys, Inc. and VeriSign, Inc. based on the most recent fiscal year data available.
| Ratios | Synopsys, Inc. (2025) | VeriSign, Inc. (2024) |
|---|---|---|
| ROE | 4.7% | -40.1% |
| ROIC | 2.0% | 451.0% |
| P/E | 54.4 | 25.8 |
| P/B | 2.57 | -10.37 |
| Current Ratio | 1.62 | 0.43 |
| Quick Ratio | 1.52 | 0.43 |
| D/E (Debt-to-Equity) | 0.50 | -0.92 |
| Debt-to-Assets | 29.6% | 128.1% |
| Interest Coverage | 2.05 | 14.1 |
| Asset Turnover | 0.15 | 1.11 |
| Fixed Asset Turnover | 5.04 | 6.66 |
| Payout Ratio | 0 | 0 |
| Dividend Yield | 0 | 0 |
Interpretation of the Ratios
Synopsys, Inc.
Synopsys shows a mixed ratio profile with favorable net margin (18.96%) and liquidity ratios (current ratio 1.62, quick ratio 1.52), but weak returns on equity (4.72%) and invested capital (1.97%), and a high P/E ratio (54.36) suggesting overvaluation concerns. The company does not pay dividends, likely prioritizing reinvestment and growth strategies over shareholder payouts.
VeriSign, Inc.
VeriSign exhibits strong profitability with a high net margin (50.45%) and outstanding return on invested capital (451%), yet suffers from negative return on equity (-40.13%) and poor liquidity (current and quick ratios at 0.43). It does not pay dividends, possibly due to its financial structure and focus on reinvestment or debt management.
Which one has the best ratios?
VeriSign presents a more favorable overall ratio profile with a higher proportion of positive metrics, including profitability and asset turnover, despite liquidity weaknesses and negative ROE. Synopsys offers balanced liquidity but weaker returns and valuation concerns, resulting in a neutral stance compared to VeriSign’s favorable evaluation.
Strategic Positioning
This section compares the strategic positioning of Synopsys, Inc. and VeriSign, Inc. in terms of Market position, Key segments, and Exposure to technological disruption:
Synopsys, Inc.
- Leading player in electronic design automation amid strong competition.
- Focuses on electronic design automation software, IP solutions, and security testing.
- Faces ongoing disruption from advances in design automation and security technologies.
VeriSign, Inc.
- Dominant domain registry provider with limited direct competitors.
- Specializes in domain name registry services and internet infrastructure.
- Relatively stable with disruption risks tied to internet infrastructure changes.
Synopsys, Inc. vs VeriSign, Inc. Positioning
Synopsys adopts a diversified approach across software design, IP, and security services, serving multiple industries. VeriSign has a concentrated focus on domain registry and internet infrastructure, benefiting from niche dominance but with narrower business drivers.
Which has the best competitive advantage?
VeriSign shows a very favorable moat with growing profitability and value creation, while Synopsys faces a very unfavorable moat, indicating value destruction and declining returns on invested capital.
Stock Comparison
The stock price dynamics of Synopsys, Inc. and VeriSign, Inc. over the past year reveal contrasting trends, with Synopsys experiencing a notable decline and recent recovery, while VeriSign shows sustained growth with slowing momentum.
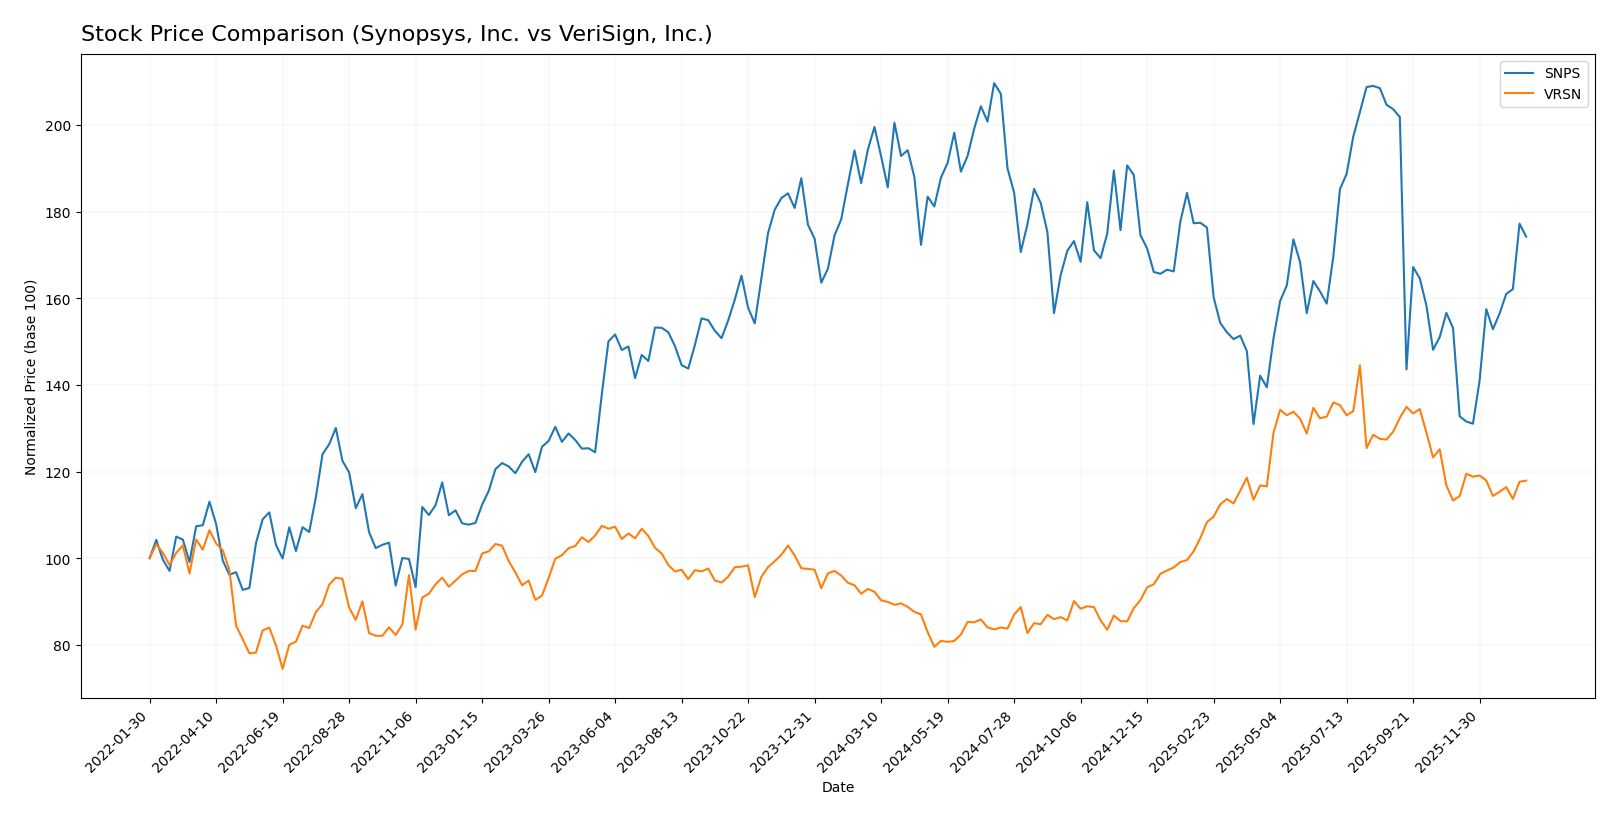
Trend Analysis
Synopsys, Inc.’s stock trend over the past 12 months is bearish, with a -10.31% price change and accelerating downward momentum, ranging between 388.13 and 621.3, and recent recovery of +13.77% since November 2025.
VeriSign, Inc.’s stock shows a bullish trend over the same period, gaining 26.92% with decelerating growth, fluctuating between 168.32 and 305.79, and a mild recent increase of 4.03% since November 2025.
Comparing both companies, VeriSign has delivered the highest market performance over the past year, maintaining a positive overall trend while Synopsys faces a larger negative shift despite recent gains.
Target Prices
Analysts present a clear consensus on target prices for Synopsys, Inc. and VeriSign, Inc.
| Company | Target High | Target Low | Consensus |
|---|---|---|---|
| Synopsys, Inc. | 600 | 425 | 530 |
| VeriSign, Inc. | 325 | 325 | 325 |
The consensus target price for Synopsys (530) is slightly above its current price (516.31), indicating moderate upside potential. VeriSign’s fixed target of 325 suggests a significant expected increase from its current price of 249.47.
Analyst Opinions Comparison
This section compares analysts’ ratings and grades for Synopsys, Inc. and VeriSign, Inc.:
Rating Comparison
Synopsys Rating
- Rating: B-, considered very favorable overall.
- Discounted Cash Flow Score: 3, moderate valuation.
- ROE Score: 3, moderate efficiency in equity use.
- ROA Score: 3, moderate asset utilization.
- Debt To Equity Score: 2, moderate financial risk.
VeriSign Rating
- Rating: B-, also considered very favorable overall.
- Discounted Cash Flow Score: 4, favorable valuation.
- ROE Score: 1, very unfavorable equity efficiency.
- ROA Score: 5, very favorable asset utilization.
- Debt To Equity Score: 1, very unfavorable risk level.
Which one is the best rated?
Synopsys and VeriSign share the same overall rating of B-, both deemed very favorable. Synopsys scores moderately across most metrics, while VeriSign shows more extreme scores, with strong ROA but weak ROE and debt management.
Scores Comparison
Here is a comparison of the financial health scores for Synopsys, Inc. and VeriSign, Inc.:
Synopsys Scores
- Altman Z-Score: 3.54, indicating a safe zone status.
- Piotroski Score: 4, reflecting average financial strength.
VeriSign Scores
- Altman Z-Score: -4.67, indicating financial distress zone.
- Piotroski Score: 8, reflecting very strong financial strength.
Which company has the best scores?
VeriSign exhibits a very strong Piotroski Score of 8, indicating robust financial strength, while Synopsys holds a higher Altman Z-Score of 3.54, signaling lower bankruptcy risk. The scores highlight strengths in different financial aspects for each company.
Grades Comparison
Here is a comparison of the recent grades issued by recognized grading companies for both Synopsys, Inc. and VeriSign, Inc.:
Synopsys, Inc. Grades
The following table summarizes recent grades from established financial institutions for Synopsys, Inc.:
| Grading Company | Action | New Grade | Date |
|---|---|---|---|
| Piper Sandler | Downgrade | Neutral | 2026-01-13 |
| Morgan Stanley | Maintain | Overweight | 2025-12-12 |
| Rosenblatt | Maintain | Buy | 2025-12-11 |
| Keybanc | Maintain | Overweight | 2025-12-11 |
| Piper Sandler | Maintain | Overweight | 2025-12-11 |
| Needham | Maintain | Buy | 2025-12-11 |
| B of A Securities | Upgrade | Buy | 2025-12-11 |
| JP Morgan | Maintain | Overweight | 2025-12-11 |
| Wells Fargo | Maintain | Equal Weight | 2025-12-11 |
| Rosenblatt | Upgrade | Buy | 2025-12-09 |
Overall, Synopsys shows predominantly buy and overweight ratings with a single recent downgrade to neutral, indicating generally positive but slightly cautious sentiment.
VeriSign, Inc. Grades
The following table compiles recent grades from reliable sources for VeriSign, Inc.:
| Grading Company | Action | New Grade | Date |
|---|---|---|---|
| JP Morgan | Maintain | Neutral | 2026-01-06 |
| Baird | Maintain | Outperform | 2025-07-01 |
| Baird | Maintain | Outperform | 2025-04-25 |
| Baird | Maintain | Outperform | 2025-04-01 |
| Citigroup | Maintain | Buy | 2025-02-04 |
| Citigroup | Maintain | Buy | 2025-01-03 |
| Baird | Upgrade | Outperform | 2024-12-09 |
| Baird | Maintain | Neutral | 2024-06-27 |
| Baird | Maintain | Neutral | 2024-04-26 |
| Citigroup | Maintain | Buy | 2024-04-02 |
VeriSign’s grades predominantly range from neutral to outperform, with no recent downgrades, suggesting steady and optimistic analyst views.
Which company has the best grades?
Both companies have consensus ratings of “Buy,” but Synopsys has a larger number of buy and overweight ratings with some recent downgrades, while VeriSign maintains a consistent outperform and buy trend with fewer fluctuations. This suggests investors might view VeriSign as a more stable option in terms of analyst sentiment.
Strengths and Weaknesses
Below is a comparison of key strengths and weaknesses for Synopsys, Inc. (SNPS) and VeriSign, Inc. (VRSN) based on recent financial and strategic data.
| Criterion | Synopsys, Inc. (SNPS) | VeriSign, Inc. (VRSN) |
|---|---|---|
| Diversification | Moderate: Revenue spread across licensing, maintenance, and technology services totaling nearly $7B in 2025. | Limited product segmentation data, focused on domain services but very strong in core area. |
| Profitability | Moderate net margin (18.96%) but low ROIC (1.97%) and declining profitability trend. | Very high net margin (50.45%) and exceptional ROIC (451%), indicating strong profitability. |
| Innovation | Stable technology services segment, but declining ROIC suggests challenges in generating excess returns. | Demonstrates durable competitive advantage with growing profitability and innovation moat. |
| Global presence | Strong global footprint in semiconductor IP and software licensing markets. | Global leader in domain name services, with entrenched market position. |
| Market Share | Significant in semiconductor EDA and IP licensing, but facing value destruction. | Dominant in internet infrastructure with very favorable economic moat. |
Key takeaways: VeriSign shows a very favorable economic moat with exceptional profitability and a durable competitive advantage, making it a strong candidate for investment. Synopsys, while diversified and profitable in net terms, is currently experiencing declining returns and value destruction, warranting cautious evaluation.
Risk Analysis
Below is a comparison table of key risks for Synopsys, Inc. (SNPS) and VeriSign, Inc. (VRSN) based on the most recent data available in 2026:
| Metric | Synopsys, Inc. (SNPS) | VeriSign, Inc. (VRSN) |
|---|---|---|
| Market Risk | Moderate beta (1.12), tech sector volatility | Lower beta (0.77), more stable but exposed to domain market trends |
| Debt level | Moderate debt-to-assets (29.6%), neutral debt/equity (0.5) | High debt-to-assets (128%), negative debt/equity ratio, potential financial strain |
| Regulatory Risk | Moderate, software/IP compliance required | Elevated, due to critical internet infrastructure roles and domain regulation |
| Operational Risk | Moderate, relying on innovation in complex software tools | Moderate, dependent on domain registry operations and infrastructure uptime |
| Environmental Risk | Low, primarily software business | Low, service-based with minimal physical footprint |
| Geopolitical Risk | Moderate, global supply chain and trade sensitivity | Moderate to high, internet infrastructure sensitive to geopolitical cyber risks |
In synthesis, VeriSign faces the most impactful risks from its high debt levels and exposure to regulatory and geopolitical sensitivities due to its critical internet infrastructure role. Synopsys carries moderate market and operational risks but maintains a healthier balance sheet and lower financial distress risk. Investors should weigh VeriSign’s financial leverage and regulatory environment carefully versus Synopsys’s steadier but innovation-dependent outlook.
Which Stock to Choose?
Synopsys, Inc. (SNPS) shows favorable income growth with a 15.12% revenue increase in 2025 and a strong gross margin of 76.98%. Its financial ratios reflect a mixed picture, with favorable net margin (18.96%) and liquidity but unfavorable ROE (4.72%) and PE ratio (54.36). The company carries moderate debt and a B- rating, indicating moderate financial health but a very unfavorable moat due to declining ROIC below WACC.
VeriSign, Inc. (VRSN) presents a solid income profile with an 87.71% gross margin and a 50.45% net margin, though recent net income growth is negative. Its financial ratios are mostly favorable, including a strong ROIC far above WACC, despite an unfavorable current ratio and high debt-to-assets. The firm holds a B- rating and a very favorable moat, signaling durable competitive advantage with growing profitability.
For investors, VeriSign’s very favorable moat and stronger profitability might appeal to those seeking quality and competitive advantage, while Synopsys’ steady income growth and moderate rating could be of interest to growth-oriented investors willing to accept some financial risks. The choice could depend on risk tolerance and investment strategy preferences.
Disclaimer: Investment carries a risk of loss of initial capital. The past performance is not a reliable indicator of future results. Be sure to understand risks before making an investment decision.
Go Further
I encourage you to read the complete analyses of Synopsys, Inc. and VeriSign, Inc. to enhance your investment decisions: