In the dynamic world of software infrastructure, Synopsys, Inc. (SNPS) and UiPath Inc. (PATH) stand out as innovative leaders pushing the boundaries of technology. Synopsys excels in electronic design automation, while UiPath pioneers robotic process automation, both shaping critical aspects of digital transformation. This article compares their market positions and innovation strategies to help you decide which company presents the more compelling investment opportunity in 2026.
Table of contents
Companies Overview
I will begin the comparison between Synopsys and UiPath by providing an overview of these two companies and their main differences.
Synopsys Overview
Synopsys, Inc. specializes in electronic design automation software for integrated circuits, offering a comprehensive Fusion Design Platform and Verification Continuum Platform. The company also provides intellectual property solutions, logic libraries, configurable processor cores, and security IP. Founded in 1986 and headquartered in Mountain View, California, Synopsys serves diverse industries including electronics, automotive, and financial services with around 20,000 employees.
UiPath Overview
UiPath Inc. delivers an end-to-end robotic process automation platform that integrates artificial intelligence with low-code development environments to automate business processes. The company’s software suite supports attended and unattended automation, orchestration, and performance tracking, primarily serving banking, healthcare, and government sectors. Founded in 2005 and based in New York City, UiPath employs nearly 3,900 people and focuses on enterprise workflow automation.
Key similarities and differences
Both Synopsys and UiPath operate in the software infrastructure industry, emphasizing automation solutions for enterprises. Synopsys focuses on electronic design automation and IP products for hardware integration, while UiPath concentrates on software-driven robotic process automation combining AI and low-code tools. Synopsys has a significantly larger workforce and market cap, reflecting its established position and broader industry reach compared to UiPath’s newer, specialized automation platform.
Income Statement Comparison
This table presents a side-by-side comparison of key income statement metrics for Synopsys, Inc. and UiPath Inc. for their most recent fiscal years.
| Metric | Synopsys, Inc. (SNPS) | UiPath Inc. (PATH) |
|---|---|---|
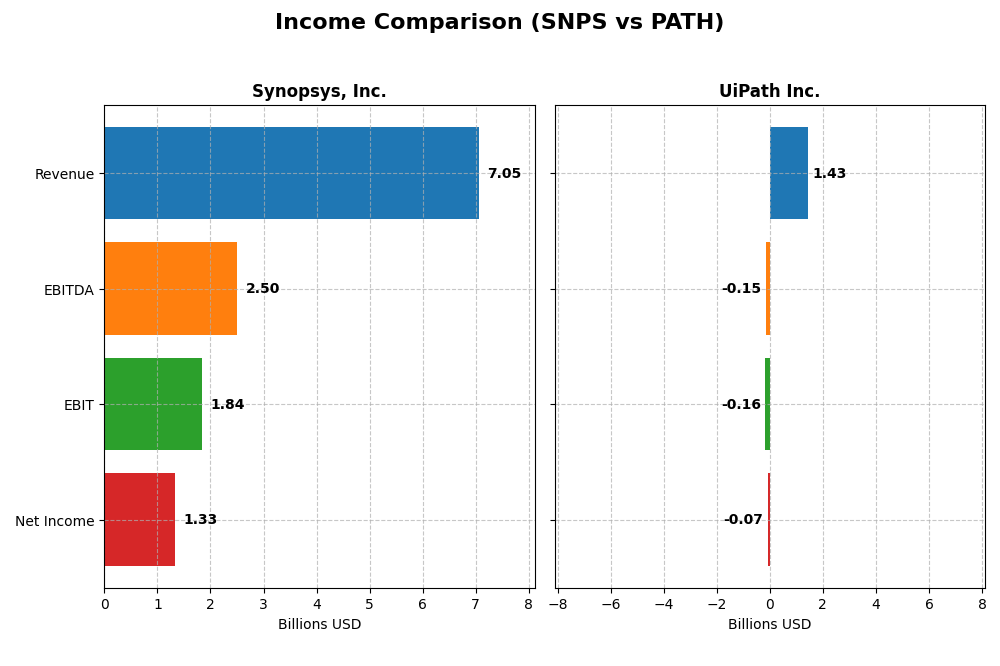
| Market Cap | 98.8B | 7.7B |
| Revenue | 7.05B | 1.43B |
| EBITDA | 2.50B | -145M |
| EBIT | 1.84B | -163M |
| Net Income | 1.33B | -74M |
| EPS | 8.13 | -0.13 |
| Fiscal Year | 2025 | 2025 |
Income Statement Interpretations
Synopsys, Inc.
Synopsys exhibited strong revenue growth from 2021 to 2025, reaching $7.05B in 2025 with a 15.1% increase year-over-year. Net income also grew overall but declined in 2025 to $1.33B, reflecting a drop in net margin to 18.9%. Despite increased operating expenses, the company maintained favorable gross and EBIT margins, with 2025 showing solid EBIT growth and robust profitability fundamentals.
UiPath Inc.
UiPath’s revenue more than doubled from 2021 to 2025, hitting $1.43B with a 9.3% rise in the latest year. However, the company remains unprofitable with a net loss of $74M in 2025, though net margin and EPS improved notably. Gross margin stayed strong at 82.7%, but EBIT remained negative, signaling ongoing challenges in achieving operating profitability despite encouraging revenue and margin growth trends.
Which one has the stronger fundamentals?
Synopsys demonstrates stronger fundamentals, with consistent profitability, favorable margins, and significant net income growth over five years, despite a recent margin contraction. UiPath shows impressive revenue growth and margin improvements but continues to report operating losses and negative net margins, indicating higher risk and less stable earnings compared to Synopsys’s solid income statement performance.
Financial Ratios Comparison
The table below presents the most recent key financial ratios for Synopsys, Inc. and UiPath Inc. based on their fiscal year 2025 data.
| Ratios | Synopsys, Inc. (SNPS) | UiPath Inc. (PATH) |
|---|---|---|
| ROE | 4.72% | -3.99% |
| ROIC | 1.97% | -7.41% |
| P/E | 54.36 | -108.04 |
| P/B | 2.57 | 4.31 |
| Current Ratio | 1.62 | 2.93 |
| Quick Ratio | 1.52 | 2.93 |
| D/E (Debt-to-Equity) | 0.50 | 0.04 |
| Debt-to-Assets | 29.64% | 2.72% |
| Interest Coverage | 2.05 | 0 |
| Asset Turnover | 0.15 | 0.50 |
| Fixed Asset Turnover | 5.04 | 14.41 |
| Payout ratio | 0 | 0 |
| Dividend yield | 0 | 0 |
Interpretation of the Ratios
Synopsys, Inc.
Synopsys shows a mixed ratio profile with strong net margin (18.96%) and favorable liquidity ratios (current ratio 1.62, quick ratio 1.52), but weak returns on equity (4.72%) and invested capital (1.97%), plus a high P/E of 54.36. The company does not pay dividends, indicating a focus on reinvestment or growth rather than shareholder distributions.
UiPath Inc.
UiPath’s ratios reveal challenges including negative net margin (-5.15%), negative returns on equity (-3.99%) and invested capital (-7.41%), and zero interest coverage. Favorable liquidity (current and quick ratio 2.93) and low debt levels contrast with a high price-to-book ratio (4.31). UiPath also does not pay dividends, likely reflecting reinvestment during growth.
Which one has the best ratios?
Synopsys presents a more balanced ratio set with profitable margins and adequate liquidity despite some weak returns, while UiPath faces overall unfavorable profitability and coverage ratios despite strong liquidity and low leverage. Synopsys’s profile suggests relatively better financial health, whereas UiPath’s ratios indicate higher operational and financial risks.
Strategic Positioning
This section compares the strategic positioning of Synopsys and UiPath, including their market position, key segments, and exposure to technological disruption:
Synopsys, Inc.
- Large market cap (~99B USD) in electronic design automation, facing competitive pressure in semiconductor software.
- Key segments include License and Maintenance (~3.5B USD) and Technology Services (~1.5B USD), focused on integrated circuits and IP solutions.
- Exposure to disruption in chip design tools and system-on-chip IP, with strong focus on innovation in electronic design.
UiPath Inc.
- Smaller market cap (~7.7B USD) specializing in robotic process automation with growing competition.
- Revenue driven by Subscription Services (~800M USD) and License (~590M USD) targeting automation in banking, healthcare.
- Faces disruption risk from advances in AI and automation technologies, integrating AI with low-code platforms.
Synopsys vs UiPath Positioning
Synopsys has a diversified product portfolio centered on semiconductor design and IP, generating higher revenues and serving multiple sectors. UiPath has a more concentrated focus on automation software with a smaller scale but growth-oriented segments, exposing it to evolving AI trends.
Which has the best competitive advantage?
Both companies are currently shedding value with ROIC below WACC; Synopsys shows declining profitability, while UiPath’s improving ROIC trend suggests a slightly less unfavorable competitive advantage.
Stock Comparison
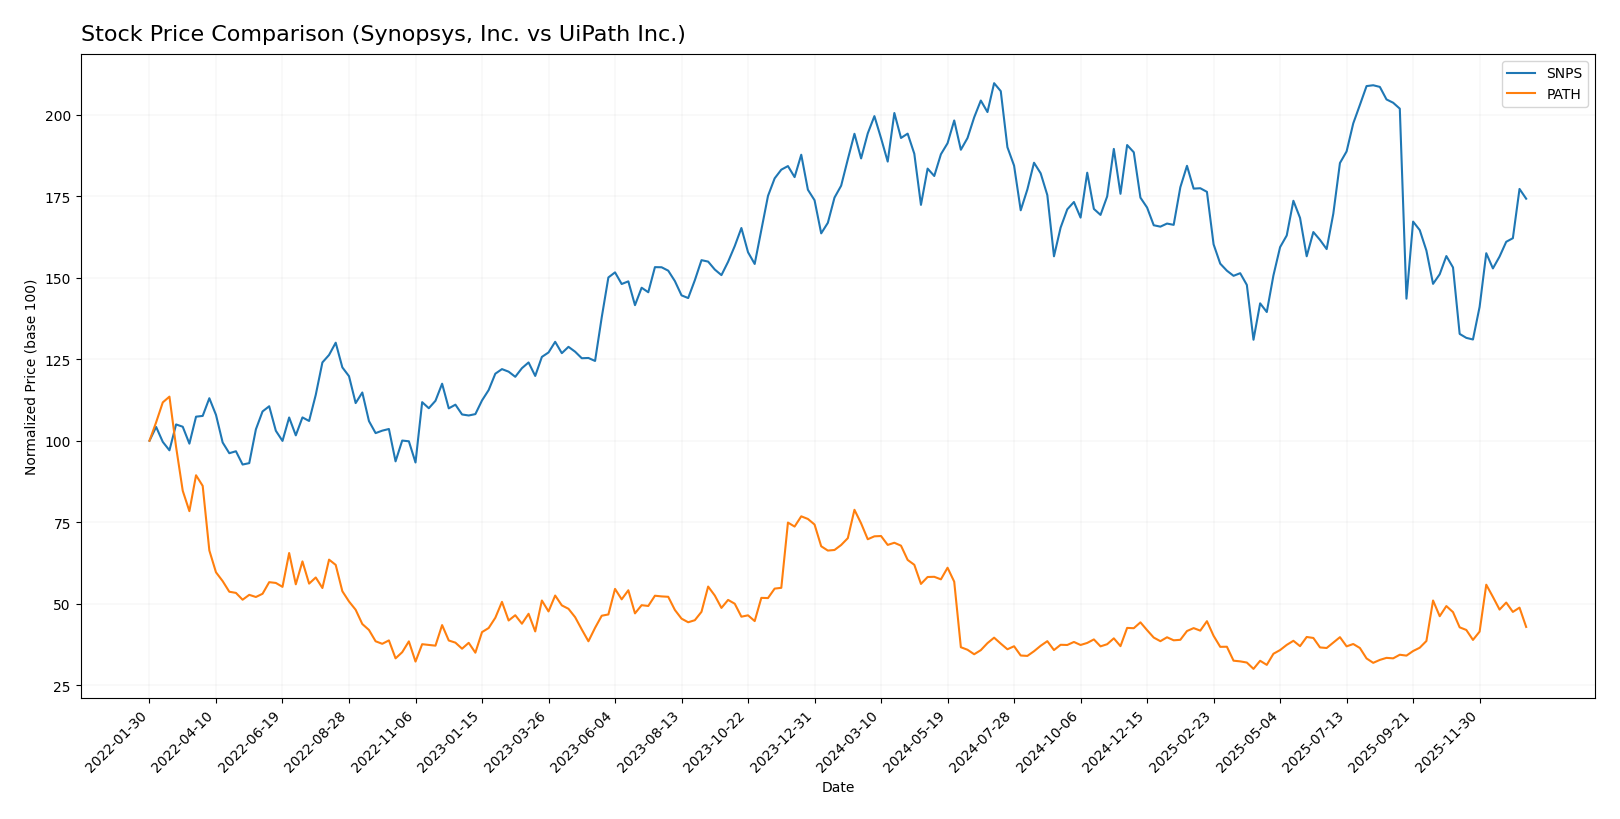
The stock prices of Synopsys, Inc. (SNPS) and UiPath Inc. (PATH) have exhibited notable bearish trends over the past 12 months, with differences in volatility and recent momentum shaping their trading dynamics.
Trend Analysis
Synopsys, Inc. (SNPS) experienced a bearish trend with a price decline of 10.31% over the past year, showing acceleration and high volatility with a standard deviation of 58.85. The stock hit a high of 621.3 and a low of 388.13.
UiPath Inc. (PATH) also showed a bearish trend with a steeper price drop of 38.53% over the last 12 months, accompanied by acceleration but lower volatility at 3.33 standard deviation. The highest and lowest prices recorded were 23.66 and 10.04, respectively.
Comparing the two, Synopsys delivered a smaller negative return and exhibited higher volatility, indicating it outperformed UiPath in terms of relative market performance over the analyzed period.
Target Prices
Here is the current consensus target price outlook from verified analysts for the selected companies:
| Company | Target High | Target Low | Consensus |
|---|---|---|---|
| Synopsys, Inc. | 600 | 425 | 530 |
| UiPath Inc. | 19 | 14 | 16.6 |
Analysts expect Synopsys to have moderate upside potential from its current price of 516.31 USD, while UiPath’s consensus target price of 16.6 USD suggests a potential rebound above its current 14.34 USD share price.
Analyst Opinions Comparison
This section compares analysts’ ratings and grades for Synopsys, Inc. and UiPath Inc.:
Rating Comparison
SNPS Rating
- Rating: B-, considered very favorable overall.
- Discounted Cash Flow Score: Moderate at 3, indicating balanced valuation.
- ROE Score: Moderate at 3, showing average efficiency in generating equity returns.
- ROA Score: Moderate at 3, reflecting average asset utilization.
- Debt To Equity Score: Moderate at 2, suggesting moderate financial risk.
- Overall Score: Moderate at 3, representing an average overall financial standing.
PATH Rating
- Rating: B+, considered very favorable overall.
- Discounted Cash Flow Score: Moderate at 3, indicating balanced valuation.
- ROE Score: Favorable at 4, indicating strong efficiency in using shareholders’ equity.
- ROA Score: Favorable at 4, showing effective use of assets to generate earnings.
- Debt To Equity Score: Favorable at 4, indicating lower reliance on debt and stronger balance sheet.
- Overall Score: Moderate at 3, representing an average overall financial standing.
Which one is the best rated?
UiPath Inc. holds a higher rating of B+ compared to Synopsys’s B-, supported by stronger ROE, ROA, and debt-to-equity scores. Both share a moderate overall score of 3, but PATH shows more favorable financial efficiency and stability metrics.
Scores Comparison
Here is a comparison of the Altman Z-Score and Piotroski Score for Synopsys, Inc. and UiPath Inc.:
Synopsys, Inc. Scores
- Altman Z-Score: 3.54, indicating a safe zone status.
- Piotroski Score: 4, reflecting average financial health.
UiPath Inc. Scores
- Altman Z-Score: 5.27, indicating a safe zone status.
- Piotroski Score: 7, reflecting strong financial health.
Which company has the best scores?
UiPath Inc. has higher scores in both the Altman Z-Score and Piotroski Score compared to Synopsys, indicating stronger financial stability and better financial health based on the provided data.
Grades Comparison
Here is the recent grading overview and consensus for Synopsys, Inc. and UiPath Inc.:
Synopsys, Inc. Grades
The following table summarizes key recent analyst grades for Synopsys, Inc.:
| Grading Company | Action | New Grade | Date |
|---|---|---|---|
| Piper Sandler | Downgrade | Neutral | 2026-01-13 |
| Morgan Stanley | Maintain | Overweight | 2025-12-12 |
| Rosenblatt | Maintain | Buy | 2025-12-11 |
| Keybanc | Maintain | Overweight | 2025-12-11 |
| Piper Sandler | Maintain | Overweight | 2025-12-11 |
| Needham | Maintain | Buy | 2025-12-11 |
| B of A Securities | Upgrade | Buy | 2025-12-11 |
| JP Morgan | Maintain | Overweight | 2025-12-11 |
| Wells Fargo | Maintain | Equal Weight | 2025-12-11 |
| Rosenblatt | Upgrade | Buy | 2025-12-09 |
Overall, the grades for Synopsys indicate a predominantly positive outlook with multiple “Buy” and “Overweight” ratings, though a recent downgrade to “Neutral” from Piper Sandler signals some caution.
UiPath Inc. Grades
Below is a summary of recent analyst grades for UiPath Inc.:
| Grading Company | Action | New Grade | Date |
|---|---|---|---|
| Barclays | Maintain | Equal Weight | 2026-01-12 |
| RBC Capital | Maintain | Sector Perform | 2026-01-05 |
| RBC Capital | Maintain | Sector Perform | 2025-12-10 |
| Morgan Stanley | Maintain | Equal Weight | 2025-12-09 |
| DA Davidson | Maintain | Neutral | 2025-12-05 |
| Canaccord Genuity | Maintain | Buy | 2025-12-04 |
| Mizuho | Maintain | Neutral | 2025-12-04 |
| RBC Capital | Maintain | Sector Perform | 2025-12-04 |
| Wells Fargo | Maintain | Equal Weight | 2025-12-04 |
| Evercore ISI Group | Maintain | In Line | 2025-12-04 |
UiPath’s grades show a generally cautious stance, with the majority as “Hold” equivalents like “Equal Weight” and “Sector Perform,” and fewer “Buy” ratings compared to Synopsys.
Which company has the best grades?
Synopsys, Inc. has received stronger grades overall, with a consensus “Buy” rating supported by 23 buy recommendations against only 5 buy and 17 hold ratings for UiPath Inc. This suggests Synopsys may be viewed more favorably by analysts, potentially affecting investor confidence and portfolio positioning.
Strengths and Weaknesses
Below is a comparative table highlighting the key strengths and weaknesses of Synopsys, Inc. (SNPS) and UiPath Inc. (PATH) based on their recent financial and operational data.
| Criterion | Synopsys, Inc. (SNPS) | UiPath Inc. (PATH) |
|---|---|---|
| Diversification | Strong revenue from licenses & maintenance ($3.49B) and technology services ($1.55B); well-diversified product segments | Moderate diversification with subscription services ($802M) and licenses ($587M); smaller professional services segment |
| Profitability | Positive net margin (18.96%), but low ROIC (1.97%) below WACC; value destroying with declining returns | Negative net margin (-5.15%) and ROIC (-7.41%), yet showing improving ROIC trend; still value destroying |
| Innovation | Moderate asset turnover (0.15) but strong fixed asset turnover (5.04); invests in technology services | Higher fixed asset turnover (14.41) indicating efficient asset use; innovation reflected in growing ROIC trend |
| Global presence | Established global footprint with consistent license growth; stable current and quick ratios (>1.5) | Growing global subscription base; strong liquidity ratios (~2.9); low debt levels indicate financial flexibility |
| Market Share | Leading market position in semiconductor software tools, but facing profitability pressure | Emerging player in automation software with increasing market penetration but still unprofitable |
In summary, Synopsys shows stable revenues and better profitability metrics but struggles with value creation and declining returns. UiPath, while currently unprofitable and value destructive, demonstrates improving profitability trends and efficient asset utilization, signaling potential growth opportunities. Investors should weigh stability against growth prospects and manage risks accordingly.
Risk Analysis
Below is a comparative table summarizing key risk metrics for Synopsys, Inc. (SNPS) and UiPath Inc. (PATH) based on the most recent financial data from 2025:
| Metric | Synopsys, Inc. (SNPS) | UiPath Inc. (PATH) |
|---|---|---|
| Market Risk | Beta 1.12 (moderate) | Beta 1.08 (moderate) |
| Debt level | Debt to Equity 0.5 (neutral) | Debt to Equity 0.04 (favorable) |
| Regulatory Risk | Moderate (Tech sector) | Moderate (Tech sector) |
| Operational Risk | Medium complexity, 20K employees | High innovation, 3.9K employees |
| Environmental Risk | Low (Software focus) | Low (Software focus) |
| Geopolitical Risk | US-based, global clients | US-based, global clients |
Synopsys faces moderate market risk with a stable debt profile but shows some operational challenges given its size and complexity. UiPath exhibits low financial leverage and strong operational agility but suffers from profitability risks and a higher risk profile due to its growth-stage status. Market volatility and execution risks remain the most impactful for both companies.
Which Stock to Choose?
Synopsys, Inc. (SNPS) shows favorable income evolution with 15.12% revenue growth in 2025 and a solid net margin near 19%. Its financial ratios are mixed, with a balanced debt profile and neutral overall rating. Profitability is moderate with a 4.7% ROE, but the company is shedding value as ROIC lags WACC significantly.
UiPath Inc. (PATH) exhibits favorable income growth at 9.3% in 2025 and improving profitability trends despite a negative net margin. Financial ratios are slightly unfavorable overall but show strong liquidity and low debt. The company’s rating is slightly better than SNPS, supported by a growing ROIC, though it remains below its cost of capital.
For investors, Synopsys might appear more stable with favorable income statement trends but shows signs of value destruction, while UiPath’s improving profitability and strong liquidity could appeal to those tolerating higher risk for growth. Thus, preferences could vary with risk tolerance and investment strategy.
Disclaimer: Investment carries a risk of loss of initial capital. The past performance is not a reliable indicator of future results. Be sure to understand risks before making an investment decision.
Go Further
I encourage you to read the complete analyses of Synopsys, Inc. and UiPath Inc. to enhance your investment decisions: