In the fast-evolving technology sector, Synopsys, Inc. (SNPS) and Arm Holdings plc (ARM) stand out as key players driving innovation in semiconductor design and software infrastructure. Synopsys specializes in electronic design automation, while Arm focuses on CPU architecture and licensing, creating a natural intersection in their markets. This comparison will help investors understand which company offers the most promising growth and strategic advantage for their portfolio. Let’s explore which is the smarter investment choice.
Table of contents
Companies Overview
I will begin the comparison between Synopsys and Arm Holdings by providing an overview of these two companies and their main differences.
Synopsys Overview
Synopsys, Inc. specializes in electronic design automation software used to design and test integrated circuits. It provides a broad range of platforms and intellectual property solutions, including digital design, verification, and FPGA prototyping tools. Headquartered in Mountain View, California, Synopsys serves diverse sectors such as electronics, automotive, finance, and medicine, positioning itself as a key player in infrastructure software for chip design.
Arm Holdings Overview
Arm Holdings plc develops and licenses CPU products and related semiconductor technologies. Its portfolio includes microprocessors, graphics units, and system IPs catering to markets like automotive, computing, and IoT. Based in Cambridge, UK, and operating globally, Arm functions as a subsidiary of Kronos II LLC. The company’s focus is on providing architecture and IP solutions that enable semiconductor manufacturers and equipment makers worldwide.
Key similarities and differences
Both companies operate in the technology sector with a focus on semiconductor-related products and services, but their business models differ. Synopsys mainly offers software platforms and IP for chip design verification and prototyping, while Arm develops and licenses processor architectures and system IPs. Synopsys is US-based with a larger workforce, whereas Arm, headquartered in the UK, has a higher market capitalization and a global licensing model.
Income Statement Comparison
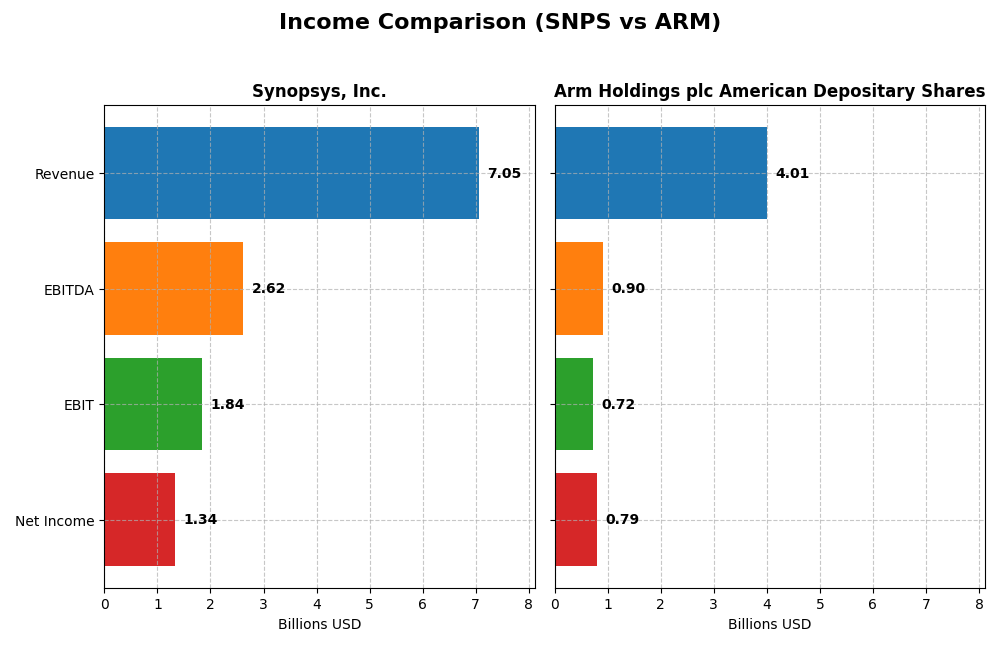
The following table presents a side-by-side comparison of the latest fiscal year income statement metrics for Synopsys, Inc. and Arm Holdings plc American Depositary Shares.
| Metric | Synopsys, Inc. (SNPS) | Arm Holdings plc (ARM) |
|---|---|---|
| Market Cap | 91.9B | 121.2B |
| Revenue | 7.05B | 4.01B |
| EBITDA | 2.62B | 903M |
| EBIT | 1.84B | 720M |
| Net Income | 1.34B | 792M |
| EPS | 8.13 | 0.75 |
| Fiscal Year | 2025 | 2025 |
Income Statement Interpretations
Synopsys, Inc.
Synopsys has shown consistent revenue growth from 4.2B in 2021 to 7.05B in 2025, with net income rising from 758M to 1.34B over the same period. Gross and EBIT margins remain favorable, around 74% and 26% respectively. However, in 2025, net margin and EPS declined sharply despite revenue growth, indicating pressure on profitability.
Arm Holdings plc American Depositary Shares
Arm’s revenue nearly doubled from 2.03B in 2021 to 4.01B in 2025, with net income increasing from 388M to 792M. Its gross margin is notably high at 95%, and EBIT margin improved to 18%. The 2025 fiscal year showed strong growth in revenue, net margin, and EPS, reflecting solid operational leverage and margin expansion.
Which one has the stronger fundamentals?
Arm demonstrates stronger fundamentals with higher gross margins, robust EBIT and net margin improvements, and exceptional growth rates in revenue, EBIT, and EPS. Synopsys also shows favorable revenue and net income growth but faced recent margin and EPS declines. Arm’s consistent margin improvement and growth metrics give it an overall more favorable income statement profile.
Financial Ratios Comparison
The table below presents the most recent key financial ratios for Synopsys, Inc. and Arm Holdings plc to facilitate a straightforward comparison of their financial performance and position.
| Ratios | Synopsys, Inc. (SNPS) | Arm Holdings plc (ARM) |
|---|---|---|
| ROE | 4.72% | 11.58% |
| ROIC | 1.97% | 10.28% |
| P/E | 54.36 | 141.58 |
| P/B | 2.57 | 16.40 |
| Current Ratio | 1.62 | 5.20 |
| Quick Ratio | 1.52 | 5.20 |
| D/E | 0.50 | 0.05 |
| Debt-to-Assets | 29.64% | 3.99% |
| Interest Coverage | 2.05 | 0 (not available) |
| Asset Turnover | 0.15 | 0.45 |
| Fixed Asset Turnover | 5.04 | 5.61 |
| Payout ratio | 0 | 0 |
| Dividend yield | 0 | 0 |
Interpretation of the Ratios
Synopsys, Inc.
Synopsys shows a mixed ratio profile with favorable net margin (18.96%) and strong liquidity indicated by current and quick ratios above 1.5. However, return on equity (4.72%) and return on invested capital (1.97%) are weak, signaling potential efficiency concerns. The high PE ratio (54.36) and moderate debt levels suggest cautious valuation. The company does not pay dividends, likely focusing on growth and reinvestment strategies.
Arm Holdings plc American Depositary Shares
Arm’s ratios reveal strengths in debt management with low debt-to-assets (3.99%) and excellent interest coverage, while net margin (19.77%) is favorable. Concerns arise from a very high PE (141.58), elevated WACC (23.74%), and weak asset turnover (0.45). Despite a high current ratio (5.2), this is flagged unfavorable. Arm also pays no dividends, likely prioritizing R&D and expansion over shareholder payouts.
Which one has the best ratios?
Comparing both, Synopsys exhibits a more balanced ratio distribution with a neutral overall opinion, while Arm faces more unfavorable flags, especially in valuation and capital cost metrics, resulting in a slightly unfavorable evaluation. Synopsys’s stronger returns and liquidity may offset some concerns, whereas Arm’s high valuation and capital costs suggest higher risk.
Strategic Positioning
This section compares the strategic positioning of Synopsys and Arm Holdings including market position, key segments, and exposure to technological disruption:
Synopsys, Inc.
- Positioned in software infrastructure, facing competition in electronic design automation software and IP markets.
- Key segments include license and maintenance, technology services, and IP solutions for integrated circuits and SoC infrastructure.
- Exposure includes evolving design and verification technologies, FPGA prototyping, and security IP solutions.
Arm Holdings plc American Depositary Shares
- Operates in semiconductors, focusing on CPU architecture and licensing, competing in global semiconductor and OEM markets.
- Key segments are licensing and royalty revenues from microprocessors, graphics IPs, and software tools across automotive and IoT markets.
- Exposure centers on semiconductor IP innovation and licensing, with sensitivity to semiconductor technology shifts.
Synopsys vs Arm Holdings Positioning
Synopsys has a diversified technology portfolio spanning design, verification, and IP services, while Arm concentrates on semiconductor IP licensing and royalties. Synopsys’s breadth serves multiple tech sectors; Arm’s focus leverages semiconductor innovation but limits diversification.
Which has the best competitive advantage?
Both companies are shedding value compared to their cost of capital. Synopsys shows declining profitability, whereas Arm maintains stable but unfavorable returns, indicating neither currently holds a strong competitive economic moat.
Stock Comparison
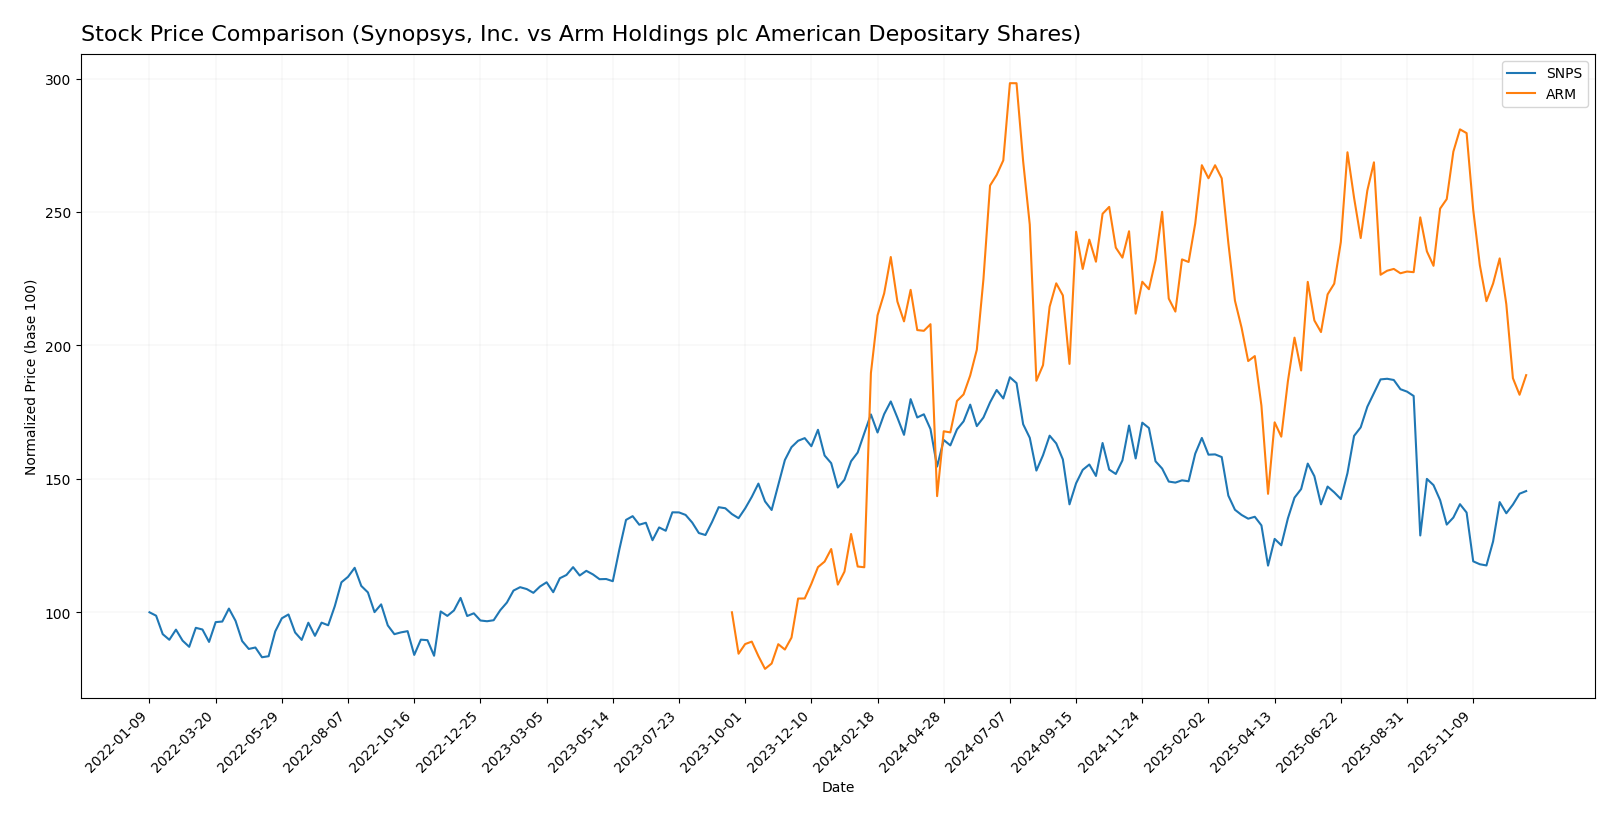
The stock price dynamics over the past year reveal contrasting trends, with Synopsys, Inc. experiencing a significant decline but recent recovery, while Arm Holdings plc ADS shows a near-flat yearly change with recent steep losses.
Trend Analysis
Synopsys, Inc. (SNPS) shows a bearish trend over the past 12 months with a -16.49% price change and accelerating decline. Recent months indicate a reversal with a 7.32% gain and moderate volatility.
Arm Holdings plc ADS (ARM) exhibits a slightly bearish trend over 12 months with a -0.42% change and decelerating loss. The recent period shows a sharp downturn of -30.72% and increased volatility.
Comparing both, Synopsys delivered the highest market performance recently despite a longer-term bearish trend; Arm’s recent sharp decline outweighs its stable yearly result.
Target Prices
The current analyst consensus shows optimistic target prices for both Synopsys, Inc. and Arm Holdings plc American Depositary Shares.
| Company | Target High | Target Low | Consensus |
|---|---|---|---|
| Synopsys, Inc. | 602 | 425 | 541.71 |
| Arm Holdings plc ADS | 210 | 120 | 173.33 |
Analysts expect Synopsys shares to appreciate significantly above the current price of $480.42, while Arm Holdings is forecasted to rise well over its current $114.73 price, reflecting confident growth prospects for both.
Analyst Opinions Comparison
This section compares analysts’ ratings and grades for Synopsys, Inc. and Arm Holdings plc American Depositary Shares:
Rating Comparison
Synopsys, Inc. Rating
- Rating: B- with a very favorable overall evaluation.
- Discounted Cash Flow Score: Moderate at 3.
- Return on Equity Score: Moderate at 3.
- Return on Assets Score: Moderate at 3.
- Debt To Equity Score: Moderate at 2, indicating higher financial risk.
- Overall Score: Moderate at 3.
Arm Holdings plc American Depositary Shares Rating
- Rating: B- with a very favorable overall evaluation.
- Discounted Cash Flow Score: Moderate but lower at 2.
- Return on Equity Score: Moderate at 3.
- Return on Assets Score: Favorable at 4.
- Debt To Equity Score: Favorable at 4, indicating lower financial risk.
- Overall Score: Moderate at 3.
Which one is the best rated?
Both companies share the same B- rating and overall moderate score. Arm shows stronger financial stability and asset utilization with higher debt-to-equity and return on assets scores, whereas Synopsys has a higher discounted cash flow score.
Scores Comparison
This table compares the Altman Z-Score and Piotroski Score of Synopsys, Inc. and Arm Holdings plc American Depositary Shares:
SNPS Scores
- Altman Z-Score: 3.23, indicating a safe zone status.
- Piotroski Score: 4, reflecting average financial health.
ARM Scores
- Altman Z-Score: 32.36, indicating a safe zone status.
- Piotroski Score: 7, reflecting strong financial health.
Which company has the best scores?
Arm Holdings shows a significantly higher Altman Z-Score and a stronger Piotroski Score than Synopsys, indicating better financial stability and strength based on the provided data.
Grades Comparison
The following is a comparison of the latest reliable grades for Synopsys, Inc. and Arm Holdings plc American Depositary Shares:
Synopsys, Inc. Grades
This table summarizes recent grades and rating actions for Synopsys, Inc.:
| Grading Company | Action | New Grade | Date |
|---|---|---|---|
| Morgan Stanley | Maintain | Overweight | 2025-12-12 |
| B of A Securities | Upgrade | Buy | 2025-12-11 |
| Rosenblatt | Maintain | Buy | 2025-12-11 |
| JP Morgan | Maintain | Overweight | 2025-12-11 |
| Wells Fargo | Maintain | Equal Weight | 2025-12-11 |
| Piper Sandler | Maintain | Overweight | 2025-12-11 |
| Keybanc | Maintain | Overweight | 2025-12-11 |
| Needham | Maintain | Buy | 2025-12-11 |
| Rosenblatt | Upgrade | Buy | 2025-12-09 |
| B of A Securities | Upgrade | Neutral | 2025-12-08 |
Overall, Synopsys shows a predominantly positive grading trend, with multiple upgrades and a majority of Buy and Overweight ratings.
Arm Holdings plc American Depositary Shares Grades
This table summarizes recent grades and rating actions for Arm Holdings plc American Depositary Shares:
| Grading Company | Action | New Grade | Date |
|---|---|---|---|
| B of A Securities | Maintain | Buy | 2025-12-16 |
| Goldman Sachs | Downgrade | Sell | 2025-12-15 |
| Loop Capital | Maintain | Buy | 2025-11-12 |
| Rosenblatt | Maintain | Buy | 2025-11-06 |
| Barclays | Maintain | Overweight | 2025-11-06 |
| Mizuho | Maintain | Outperform | 2025-11-06 |
| Needham | Maintain | Hold | 2025-11-06 |
| UBS | Maintain | Buy | 2025-11-06 |
| TD Cowen | Maintain | Buy | 2025-11-06 |
| Keybanc | Maintain | Overweight | 2025-11-06 |
Arm Holdings has mostly Buy and Overweight ratings, though a notable downgrade to Sell by Goldman Sachs contrasts the overall positive pattern.
Which company has the best grades?
Synopsys, Inc. has received more consistent upgrades and higher ratings, particularly Buy and Overweight, compared to Arm Holdings, which includes one recent Sell rating. This suggests potentially stronger analyst confidence in Synopsys, which may influence investor sentiment and portfolio decisions.
Strengths and Weaknesses
Below is a comparison table highlighting key strengths and weaknesses of Synopsys, Inc. (SNPS) and Arm Holdings plc (ARM) based on the most recent financial and operational data.
| Criterion | Synopsys, Inc. (SNPS) | Arm Holdings plc (ARM) |
|---|---|---|
| Diversification | Moderate: Revenue split between License & Maintenance (3.49B) and Technology Services (1.55B) | Moderate: Revenue mainly from License and Royalty streams (1.84B and 2.17B) |
| Profitability | Mixed: Solid net margin (18.96%), but low ROIC (1.97%) and declining value creation | Moderate: Slightly better net margin (19.77%) and ROE (11.58%), but ROIC below WACC |
| Innovation | Strong product portfolio and steady license growth | Strong IP portfolio with royalty-based model; innovation in chip architecture |
| Global presence | Broad global reach in semiconductor EDA and IP markets | Global leader in chip design IP with extensive licensing |
| Market Share | Leading player in EDA software tools | Dominant in mobile and embedded chip IP licensing |
Key takeaways: Synopsys shows strong revenue diversification and good profitability margins but struggles with value creation and efficiency. Arm benefits from a robust IP licensing model and steady profitability but faces challenges with capital returns and high valuation multiples. Both have solid innovation and global footprints, though caution is warranted due to profitability and valuation concerns.
Risk Analysis
Below is a comparative table highlighting key risks for Synopsys, Inc. (SNPS) and Arm Holdings plc (ARM) based on the most recent financial and market data from 2025:
| Metric | Synopsys, Inc. (SNPS) | Arm Holdings plc (ARM) |
|---|---|---|
| Market Risk | Moderate (Beta 1.15) | High (Beta 4.25) |
| Debt Level | Moderate (Debt/Assets 29.6%) | Low (Debt/Assets 4.0%) |
| Regulatory Risk | Moderate (US tech sector regulations) | Elevated (UK/EU regulations, US-China trade tensions) |
| Operational Risk | Moderate (Complex software integration) | Moderate (Chip design dependencies, supply chain) |
| Environmental Risk | Low (Software industry) | Moderate (Manufacturing footprint through partners) |
| Geopolitical Risk | Moderate (US-China tensions impact) | High (Global supply chain and IP exposure) |
The most impactful risks are Arm’s high market volatility (beta 4.25) and geopolitical exposure due to its international footprint and US-China tensions. Synopsys faces moderate market and regulatory risks but maintains a healthier debt profile. Investors should closely monitor ARM’s valuation multiples and geopolitical developments, as these factors present the largest potential downside.
Which Stock to Choose?
Synopsys, Inc. (SNPS) has shown favorable income growth with a 67.96% revenue increase over 2021-2025 and a strong 18.96% net margin. However, its ROE and ROIC remain unfavorable, with a declining profitability trend and a moderate debt level. The company holds a very favorable B- rating overall.
Arm Holdings plc (ARM) exhibits higher revenue growth at 97.68% over the period and a strong net margin of 19.77%. Despite this, ARM’s ROIC is below WACC, indicating value destruction, and it carries a low debt level. ARM’s rating is also very favorable at B-, with stronger balance sheet scores and a higher Piotroski score.
Investors with a risk-tolerant or growth-oriented profile may find ARM appealing due to its higher revenue and net income growth and solid financial strength. Conversely, those prioritizing stable income quality and moderate leverage might view Synopsys as more suitable, despite its declining ROIC. Both companies present considerations of value destruction, which might suggest cautious evaluation.
Disclaimer: Investment carries a risk of loss of initial capital. The past performance is not a reliable indicator of future results. Be sure to understand risks before making an investment decision.
Go Further
I encourage you to read the complete analyses of Synopsys, Inc. and Arm Holdings plc American Depositary Shares to enhance your investment decisions: