Home > Comparison > Financial Services > V vs SYF
The strategic rivalry between Visa Inc. and Synchrony Financial shapes the competitive landscape of financial credit services. Visa operates as a global payments technology leader, leveraging a vast transaction network. Synchrony focuses on consumer credit products with a retail-oriented model. This analysis explores their contrasting business models and growth prospects to determine which offers a superior risk-adjusted return for diversified portfolios in the evolving financial sector.
Table of contents
Companies Overview
Visa Inc. and Synchrony Financial dominate distinct corners of the credit services market with complementary financial services.
Visa Inc.: Global Payments Technology Leader
Visa Inc. leads as a payments technology company connecting consumers, merchants, and institutions worldwide. Its core revenue stems from transaction processing via VisaNet, facilitating authorization, clearing, and settlement of digital payments. In 2026, Visa focuses strategically on expanding partnerships and enhancing its payment platforms to innovate and secure its dominant network position.
Synchrony Financial: Consumer Credit Specialist
Synchrony Financial operates primarily as a consumer financial services company offering diverse credit products like private label and general purpose credit cards. Its revenue engine relies on credit issuance and installment loans distributed through retail partnerships. The company’s 2026 strategy emphasizes broadening digital credit solutions and expanding healthcare and specialty retail financing to deepen customer engagement.
Strategic Collision: Similarities & Divergences
Visa and Synchrony diverge in philosophy: Visa builds an open, global transaction network, while Synchrony focuses on retailer-aligned credit products within the US. Their main battleground lies in consumer credit and payment solutions, where Visa’s scale meets Synchrony’s niche retail partnerships. Investment profiles differ sharply—Visa offers stability and scale, Synchrony presents growth through specialized credit offerings.
Income Statement Comparison
This data dissects the core profitability and scalability of both corporate engines to reveal who dominates the bottom line:
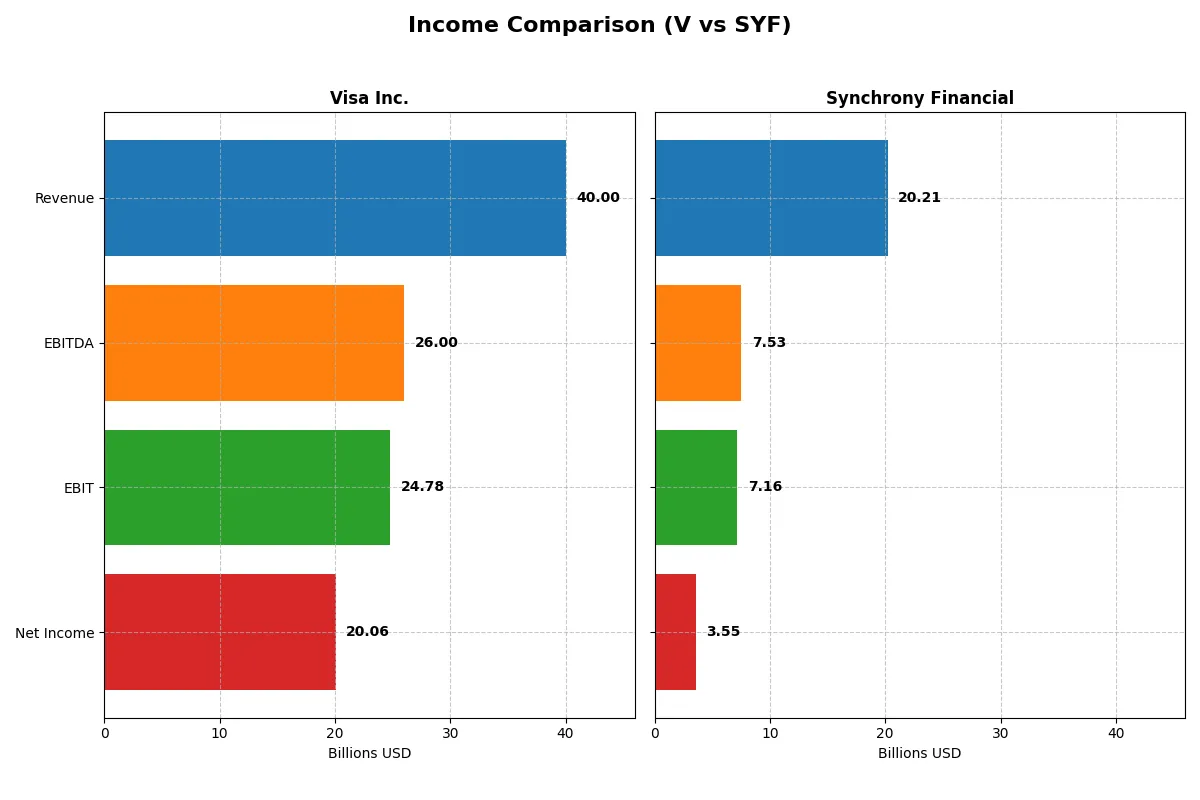
| Metric | Visa Inc. (V) | Synchrony Financial (SYF) |
|---|---|---|
| Revenue | 40B | 20.21B |
| Cost of Revenue | 7.86B | 7.92B |
| Operating Expenses | 8.15B | 5.14B |
| Gross Profit | 32.15B | 12.29B |
| EBITDA | 26B | 7.53B |
| EBIT | 24.78B | 7.16B |
| Interest Expense | 589M | 4.14B |
| Net Income | 20.06B | 3.55B |
| EPS | 10.22 | 9.35 |
| Fiscal Year | 2025 | 2025 |
Income Statement Analysis: The Bottom-Line Duel
The following income statement comparison reveals how efficiently Visa Inc. and Synchrony Financial convert revenues into profits, exposing the strength of each company’s financial engine.
Visa Inc. Analysis
Visa’s revenue rose consistently from $24.1B in 2021 to $40B in 2025, reflecting robust growth of nearly 66% over five years. Net income surged from $12.3B to $20B, maintaining an impressive 50% net margin in 2025. The company sustains strong gross (80%) and EBIT (62%) margins, underscoring operational efficiency despite a slight dip in net margin growth recently. Visa’s steady revenue expansion powers its high profitability and EPS growth momentum.
Synchrony Financial Analysis
Synchrony’s revenue climbed from $11.2B in 2021 to $20.2B in 2025, an 80% increase, though it showed a slight 2.6% decline last year. Net income, however, fell from $4.2B to $3.5B over five years, compressing net margins to 17.6%. Gross margin remains healthy near 61%, but interest expense at 20.5% of revenue weighs heavily on profitability. Despite a recent EBIT surge and EPS growth, Synchrony’s margin erosion signals profitability challenges.
Margin Strength vs. Revenue Growth
Visa outperforms Synchrony with superior margins and a consistent net income climb, delivering higher returns on revenue. Synchrony excels in top-line growth but struggles with margin compression and higher interest costs. For investors, Visa’s profile offers a more efficient, profit-driven engine, while Synchrony presents growth tempered by profitability headwinds.
Financial Ratios Comparison
These vital ratios act as a diagnostic tool to expose the underlying fiscal health, valuation premiums, and capital efficiency of the companies compared below:
| Ratios | Visa Inc. (V) | Synchrony Financial (SYF) |
|---|---|---|
| ROE | 52.9% | 21.2% |
| ROIC | 28.4% | -91.6% |
| P/E | 33.1 | 8.41 |
| P/B | 17.5 | 1.78 |
| Current Ratio | 1.08 | 0 |
| Quick Ratio | 1.08 | 0 |
| D/E | 0.66 | 0.91 |
| Debt-to-Assets | 25.3% | 12.7% |
| Interest Coverage | 40.7 | 1.73 |
| Asset Turnover | 0.40 | 0.17 |
| Fixed Asset Turnover | 9.44 | 0 |
| Payout ratio | 23.1% | 11.6% |
| Dividend yield | 0.70% | 1.38% |
| Fiscal Year | 2025 | 2025 |
Efficiency & Valuation Duel: The Vital Signs
Financial ratios act as the company’s DNA, uncovering hidden risks and revealing operational excellence beneath surface metrics.
Visa Inc.
Visa delivers robust profitability with a 52.9% ROE and a commanding 50.1% net margin, signaling efficient capital use. However, the stock trades at a stretched 33.0 P/E and a lofty 17.5 P/B, indicating premium valuation. Shareholders receive a modest 0.7% dividend yield, reflecting a cautious capital return strategy amid strong reinvestment capacity.
Synchrony Financial
Synchrony posts a moderate 21.2% ROE and a 17.6% net margin, showing steady but less spectacular profitability. The stock appears attractively valued at an 8.4 P/E and a reasonable 1.8 P/B. Dividend yield stands at 1.4%, balanced against a concerning negative ROIC and weak interest coverage, hinting at operational and financial risks.
Premium Valuation vs. Operational Safety
Visa’s ratios highlight premium valuation paired with exceptional profitability and capital efficiency, while Synchrony offers value at the expense of operational challenges. Visa suits investors seeking operational excellence with moderate risk tolerance, whereas Synchrony fits those prioritizing value but willing to accept higher financial uncertainty.
Which one offers the Superior Shareholder Reward?
Visa Inc. and Synchrony Financial follow distinct distribution philosophies. Visa yields 0.7% with a 23% payout ratio, balancing dividends and aggressive buybacks fueled by robust free cash flow (11.1/share). Synchrony offers a higher 1.38% yield but lower payout ratio (~12%), indicating cautious dividend growth amid volatile margins and higher leverage. Synchrony’s buyback activity is modest or unclear, relying on dividends for shareholder returns. Visa’s buyback program is more intense and sustainable, supported by superior margins (net ~50%) and strong cash flow coverage. I conclude Visa offers a more attractive total return profile in 2026, blending dividend discipline with capital allocation excellence.
Comparative Score Analysis: The Strategic Profile
The radar chart reveals the fundamental DNA and trade-offs of Visa Inc. and Synchrony Financial, exposing their financial strengths and valuation differences:
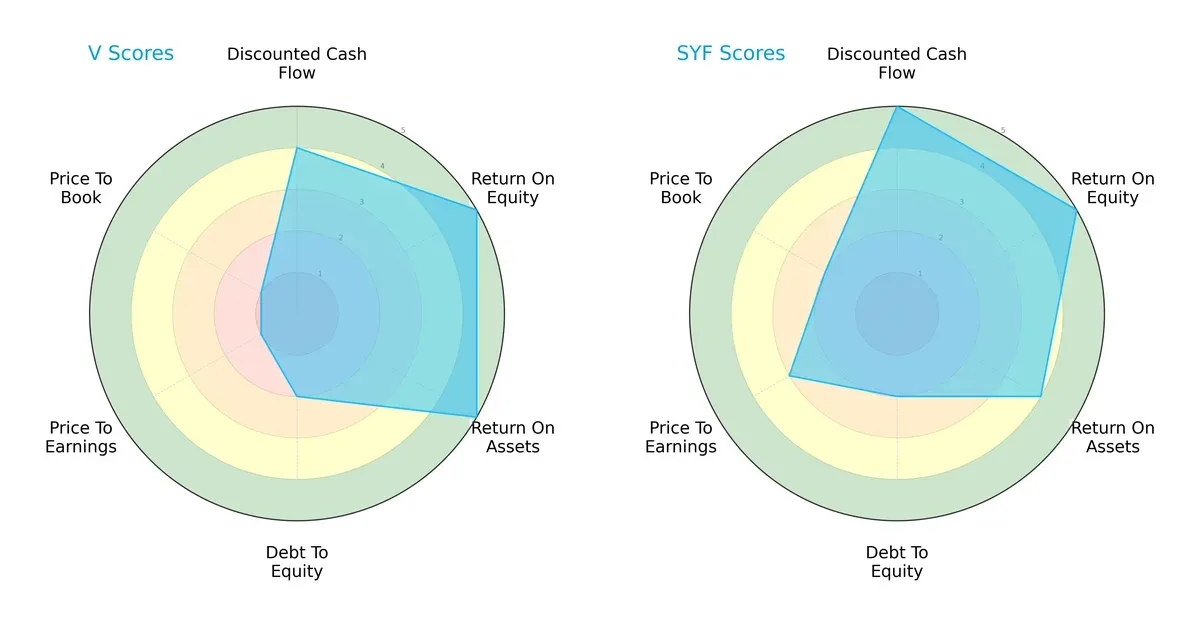
Visa Inc. shows strength in return on equity and assets with top scores (5), but suffers from very unfavorable valuation scores (PE/PB at 1). Synchrony Financial balances a higher overall score (4) with superior discounted cash flow (5) and better valuation metrics, albeit with slightly lower asset efficiency (ROA at 4). Synchrony presents a more balanced profile, while Visa relies heavily on operational efficiency despite expensive valuation.
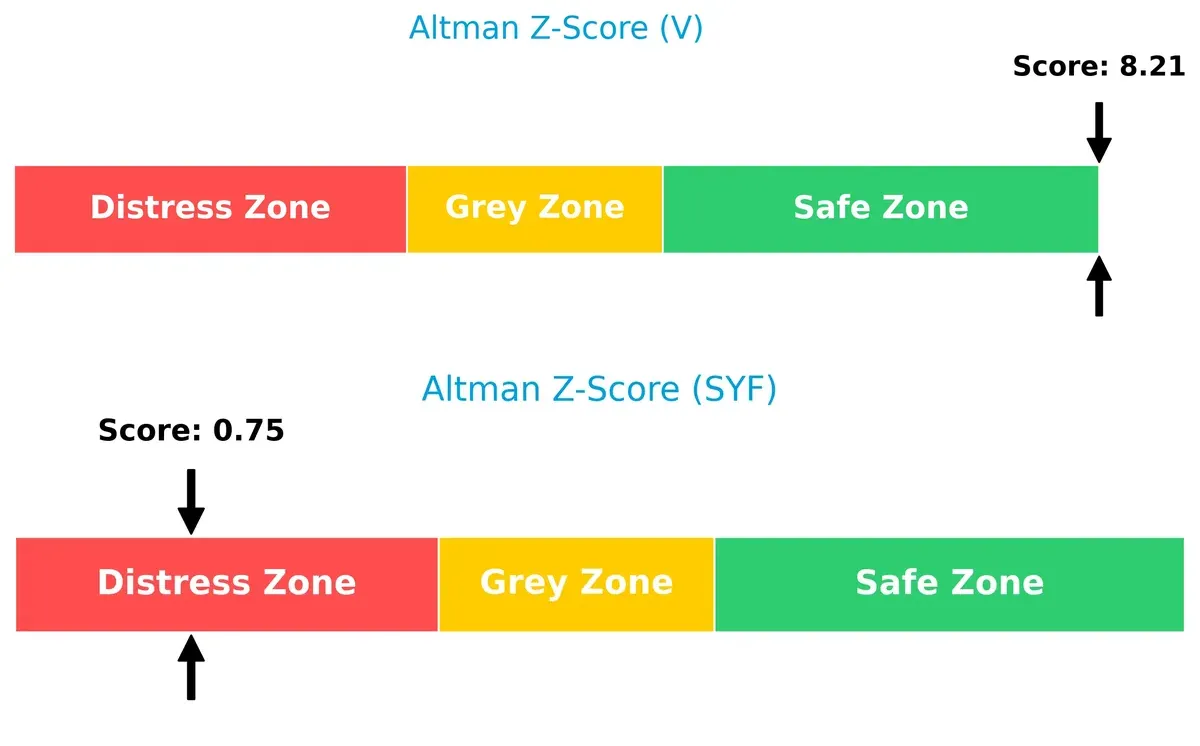
Bankruptcy Risk: Solvency Showdown
Visa’s Altman Z-Score of 8.2 places it comfortably in the safe zone, indicating strong long-term survival prospects. Synchrony’s 0.75 score signals distress, suggesting significant bankruptcy risk amid current economic cycles:
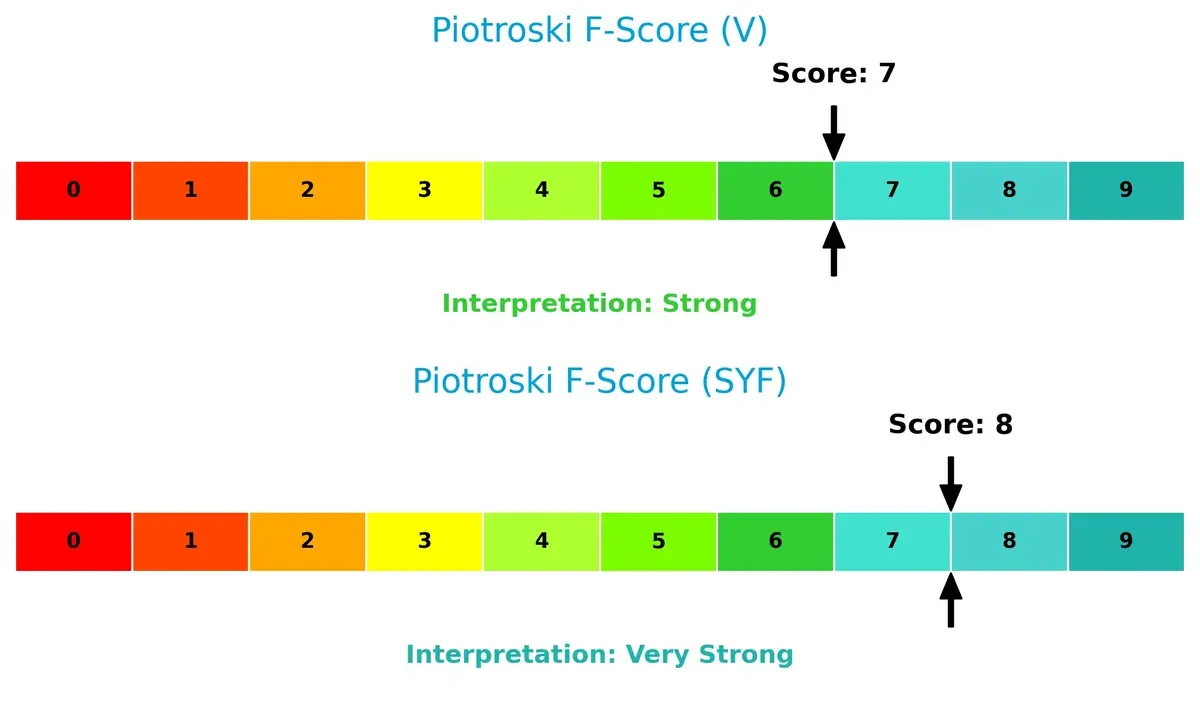
Financial Health: Quality of Operations
Synchrony scores an 8 on the Piotroski F-Score, indicating very strong financial health. Visa’s score of 7 is strong but slightly less robust, hinting at minor internal red flags relative to Synchrony:
How are the two companies positioned?
This section dissects Visa and Synchrony Financial’s operational DNA by comparing their revenue distribution and internal dynamics. The goal is to confront their economic moats and identify which model offers the most resilient, sustainable competitive advantage today.
Revenue Segmentation: The Strategic Mix
This visual comparison dissects how Visa Inc. and Synchrony Financial diversify their income streams and where their primary sector bets lie:
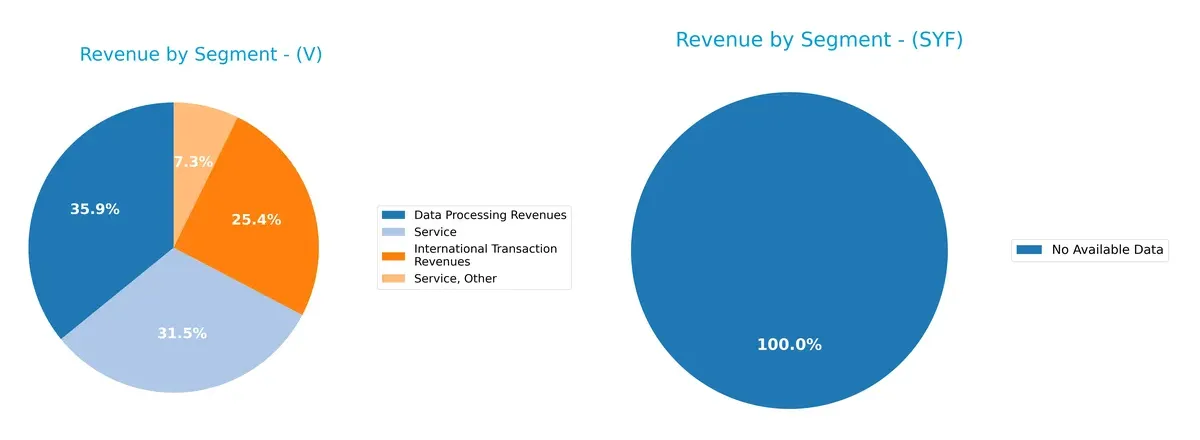
Visa Inc. anchors its revenue in Data Processing ($20B) and Service segments ($17.5B), with International Transactions also significant at $14.2B. This mix shows strong ecosystem lock-in through varied transaction types. Synchrony Financial lacks available data, preventing direct comparison, but Visa’s diversified model reduces concentration risk and underscores its infrastructure dominance in payments.
Strengths and Weaknesses Comparison
This table compares the Strengths and Weaknesses of Visa Inc. and Synchrony Financial:
Visa Inc. Strengths
- High profitability with 50.14% net margin and 52.91% ROE
- Solid capital efficiency with 28.36% ROIC above 7.36% WACC
- Strong international revenue of $24.4B in 2025
- Favorable quick ratio at 1.08 supports liquidity
Synchrony Financial Strengths
- Favorable net margin at 17.58% and ROE at 21.19%
- Attractive P/E ratio at 8.41 reflecting value
- Lower debt to assets at 12.75% reduces financial risk
Visa Inc. Weaknesses
- High P/B ratio at 17.49 signals expensive valuation
- Unfavorable asset turnover at 0.4 may indicate lower asset efficiency
- Low dividend yield at 0.7% could deter income investors
Synchrony Financial Weaknesses
- Negative ROIC at -91.64% signals poor capital returns
- Unfavorable WACC at 14.22% increases capital costs
- Zero current and quick ratios indicate liquidity concerns
- Weak interest coverage at 1.73 raises solvency risks
Visa’s strengths lie in profitability and global reach, but valuation and asset efficiency require monitoring. Synchrony faces liquidity and capital efficiency challenges despite decent profitability.
The Moat Duel: Analyzing Competitive Defensibility
A structural moat is the only reliable shield protecting long-term profits from relentless competitive erosion in financial services:
Visa Inc.: Network Effects Powerhouse
Visa’s moat stems primarily from its vast network effects, connecting millions of merchants and consumers worldwide. This manifests in high ROIC and stable margins around 50%. In 2026, expansion into emerging markets and digital payment innovations could deepen this advantage.
Synchrony Financial: Niche Credit Provider with Credit Risk Challenges
Synchrony relies on specialized consumer credit products and retailer partnerships, contrasting Visa’s broad network. However, its declining ROIC and high interest expenses reveal weak capital efficiency. Future growth hinges on managing credit risk and expanding digital financing solutions.
Network Effects vs. Credit Specialization: The Moat Face-Off
Visa’s expanding network effect delivers a wider, more durable moat, reflected in superior profitability and growing ROIC. Synchrony’s declining returns signal a shrinking moat, leaving Visa better equipped to defend and grow its market share.
Which stock offers better returns?
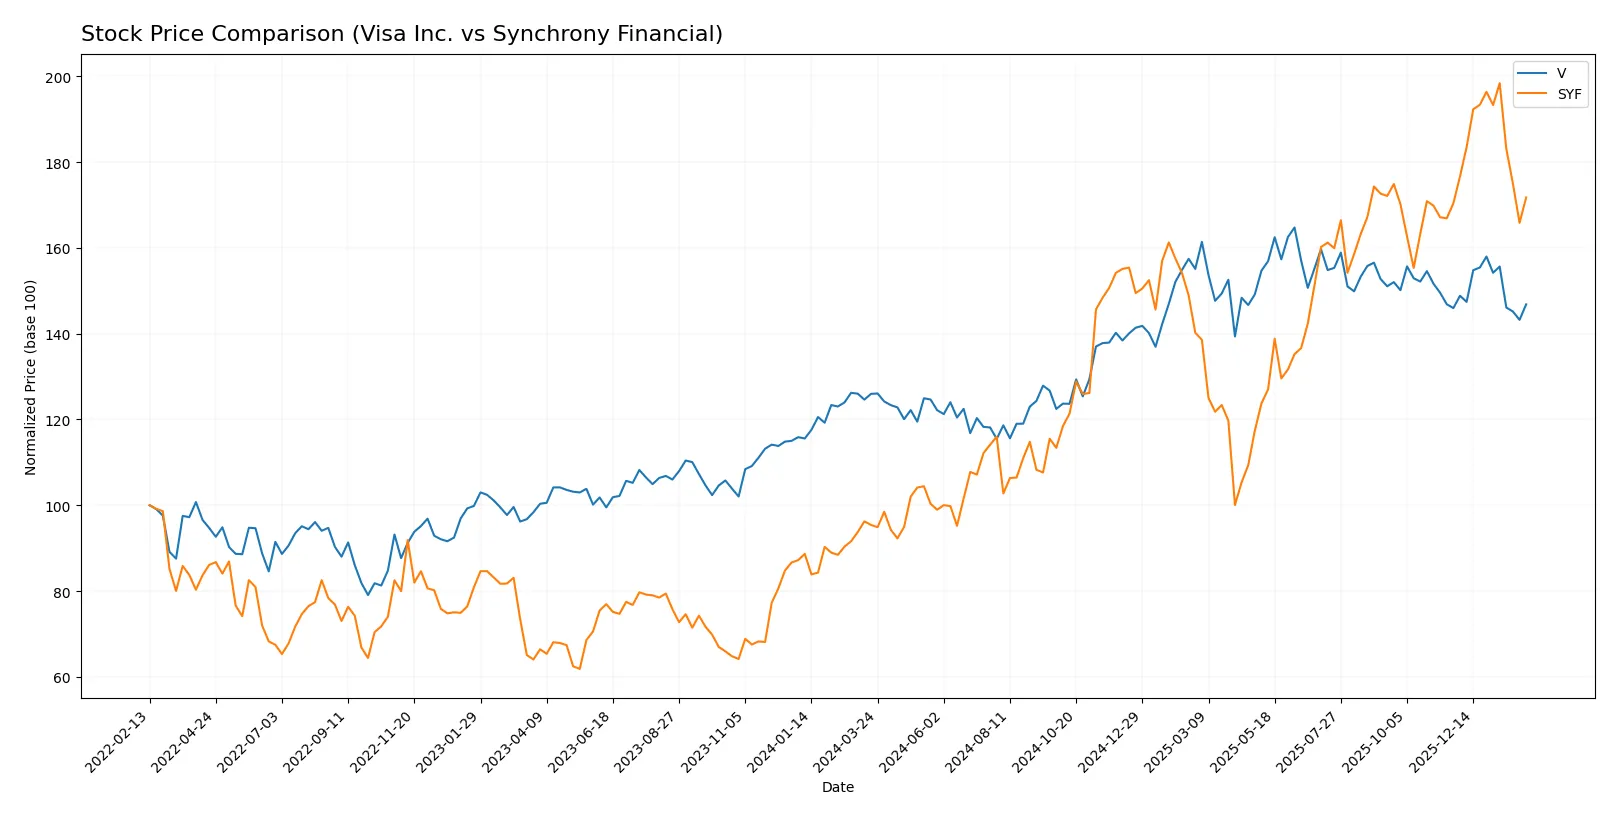
The past year reveals contrasting price dynamics: Visa Inc. shows steady gains with some recent slowdown, while Synchrony Financial posts stronger growth but with decelerating momentum.
Trend Comparison
Visa Inc. recorded a 16.57% price increase over the past 12 months, signaling a bullish trend with decelerating momentum. Its volatility remains high, with a standard deviation of 32.79.
Synchrony Financial surged 80.04% over the same period, also following a bullish trend but with deceleration. It exhibits lower volatility, standard deviation at 12.88, compared to Visa.
Synchrony Financial outperformed Visa in stock price appreciation, delivering the highest market returns despite both showing decelerating bullish trends.
Target Prices
Analysts present a broad but optimistic target consensus for Visa Inc. and Synchrony Financial.
| Company | Target Low | Target High | Consensus |
|---|---|---|---|
| Visa Inc. | 160 | 425 | 378 |
| Synchrony Financial | 81 | 100 | 90 |
Visa’s target consensus of 378 suggests a potential upside from the current 330 price, reflecting confidence in its dominant payments network. Synchrony’s 90 consensus price also indicates upside from 75, signaling optimism about its consumer finance growth.

Don’t Let Luck Decide Your Entry Point
Optimize your entry points with our advanced ProRealTime indicators. You’ll get efficient buy signals with precise price targets for maximum performance. Start outperforming now!
How do institutions grade them?
Below is a comparison of institutional grades for Visa Inc. and Synchrony Financial:
Visa Inc. Grades
This table summarizes recent grades assigned to Visa Inc. by major grading firms.
| Grading Company | Action | New Grade | Date |
|---|---|---|---|
| Macquarie | Maintain | Outperform | 2026-01-30 |
| Cantor Fitzgerald | Maintain | Overweight | 2026-01-30 |
| RBC Capital | Maintain | Outperform | 2026-01-30 |
| Morgan Stanley | Maintain | Overweight | 2026-01-30 |
| B of A Securities | Upgrade | Buy | 2025-12-11 |
| HSBC | Upgrade | Buy | 2025-12-08 |
| UBS | Maintain | Buy | 2025-10-29 |
| Macquarie | Maintain | Outperform | 2025-10-29 |
| Raymond James | Maintain | Outperform | 2025-10-29 |
| Baird | Maintain | Outperform | 2025-10-06 |
Synchrony Financial Grades
Below are the latest institutional grades for Synchrony Financial from respected firms.
| Grading Company | Action | New Grade | Date |
|---|---|---|---|
| Truist Securities | Maintain | Hold | 2026-01-29 |
| RBC Capital | Maintain | Sector Perform | 2026-01-28 |
| JP Morgan | Maintain | Neutral | 2026-01-28 |
| BTIG | Maintain | Buy | 2026-01-28 |
| Barclays | Maintain | Overweight | 2026-01-28 |
| JP Morgan | Maintain | Neutral | 2026-01-12 |
| TD Cowen | Maintain | Buy | 2026-01-08 |
| Barclays | Maintain | Overweight | 2026-01-06 |
| Wells Fargo | Maintain | Overweight | 2026-01-05 |
| Keefe, Bruyette & Woods | Maintain | Outperform | 2026-01-02 |
Which company has the best grades?
Visa Inc. holds consistently higher grades with multiple Outperform and Buy ratings. Synchrony Financial shows more Hold and Neutral grades. Visa’s stronger grades suggest greater institutional confidence, potentially affecting investor sentiment positively.
Risks specific to each company
The following categories identify the critical pressure points and systemic threats facing both firms in the 2026 market environment:
1. Market & Competition
Visa Inc.
- Dominates global digital payments with strong network effects but faces fintech disruption risks.
Synchrony Financial
- Competes in consumer credit with exposure to retail sector cyclicality and rising default rates.
2. Capital Structure & Debt
Visa Inc.
- Maintains moderate debt-to-equity (0.66) with strong interest coverage (42x), supporting financial flexibility.
Synchrony Financial
- Higher leverage (0.91 debt-to-equity) and weak interest coverage (1.73x) signal refinancing and solvency risks.
3. Stock Volatility
Visa Inc.
- Low beta (0.78) indicates defensive stock behavior amid market swings.
Synchrony Financial
- Elevated beta (1.40) reflects higher sensitivity to market volatility and economic cycles.
4. Regulatory & Legal
Visa Inc.
- Faces global regulatory scrutiny on payments data privacy and antitrust concerns.
Synchrony Financial
- Subject to consumer credit regulations and potential legal exposure from loan defaults.
5. Supply Chain & Operations
Visa Inc.
- Relies on robust digital infrastructure; operational disruptions could impact transaction processing.
Synchrony Financial
- Dependent on retail partners and credit underwriting accuracy; operational risk from credit losses.
6. ESG & Climate Transition
Visa Inc.
- Increasing pressure to enhance sustainable practices and reduce carbon footprint in tech operations.
Synchrony Financial
- ESG risk tied to lending practices and exposure to climate-sensitive consumer sectors.
7. Geopolitical Exposure
Visa Inc.
- Global footprint exposes it to geopolitical tensions affecting cross-border payment flows.
Synchrony Financial
- Primarily US-focused, less exposed internationally but vulnerable to domestic policy shifts.
Which company shows a better risk-adjusted profile?
Visa’s dominant market position, strong capital structure, and low stock volatility create a superior risk-adjusted profile. Synchrony faces significant risks from high leverage, weak liquidity ratios, and operational dependence on retail credit cycles. Visa’s Altman Z-score (8.2, safe zone) contrasts sharply with Synchrony’s distress zone score (0.75), underscoring Visa’s financial stability advantage. However, Synchrony’s very strong Piotroski score (8) signals operational strength despite balance sheet vulnerabilities. The critical risk for Visa is regulatory pressure on its global network, while Synchrony’s largest risk is solvency amidst tightening credit conditions. Overall, Visa offers a more prudent risk-return balance in 2026’s challenging financial services landscape.
Final Verdict: Which stock to choose?
Visa Inc. wields unmatched efficiency in capital allocation, consistently generating returns far above its cost of capital. Its robust economic moat and high-quality earnings underscore a cash-generating powerhouse. A point of vigilance remains its lofty valuation multiples, which might temper near-term upside. Visa suits portfolios aiming for steady, long-term growth with industry leadership exposure.
Synchrony Financial’s strategic moat lies in its niche consumer finance platform, delivering attractive earnings yield at a compelling valuation. Its lower market cap and higher volatility reflect increased risk compared to Visa, alongside value-destroying capital efficiency trends. Synchrony fits investors seeking value-oriented opportunities willing to tolerate balance sheet and profitability uncertainties.
If you prioritize durable competitive advantage and capital efficiency, Visa outshines with superior stability and sustainable value creation despite premium pricing. However, if you seek deep value with potential growth catalysts and can manage financial risks, Synchrony offers a contrasting profile with higher income yield and undervaluation characteristics. The choice depends on your appetite for stability versus contrarian value exposure.
Disclaimer: Investment carries a risk of loss of initial capital. The past performance is not a reliable indicator of future results. Be sure to understand risks before making an investment decision.
Go Further
I encourage you to read the complete analyses of Visa Inc. and Synchrony Financial to enhance your investment decisions: