Symbotic Inc. and Xylem Inc. are two prominent players in the industrial machinery sector, each driving innovation in distinct yet overlapping markets. Symbotic specializes in advanced warehouse automation, enhancing efficiency for retailers, while Xylem focuses on engineered water solutions globally. Their shared commitment to technology and operational excellence makes this comparison essential. Join me as we explore which company offers the most compelling investment opportunity in 2026.
Table of contents
Companies Overview
I will begin the comparison between Symbotic Inc. and Xylem Inc. by providing an overview of these two companies and their main differences.
Symbotic Inc. Overview
Symbotic Inc. is an automation technology company focused on improving efficiency for retailers and wholesalers through robotics. Its flagship offering, The Symbotic System, provides full-service warehouse automation designed to reduce costs and maximize inventory management. Based in Wilmington, Massachusetts, Symbotic operates in the industrial machinery sector with a market cap of approximately 42.8B USD.
Xylem Inc. Overview
Xylem Inc. specializes in engineered products and solutions for water and wastewater applications globally. Operating through three segments—Water Infrastructure, Applied Water, and Measurement & Control Solutions—it offers a broad range of pumps, filtration, smart meters, and software services. Headquartered in Rye Brook, New York, Xylem has a market cap near 34.0B USD and employs about 23,000 people.
Key similarities and differences
Both companies operate in the industrial machinery industry but target distinct markets and applications. Symbotic focuses on warehouse automation for retail and wholesale sectors, while Xylem targets water and wastewater infrastructure and related services worldwide. Xylem’s diversified portfolio and larger workforce contrast with Symbotic’s more specialized automation technology and smaller employee base.
Income Statement Comparison
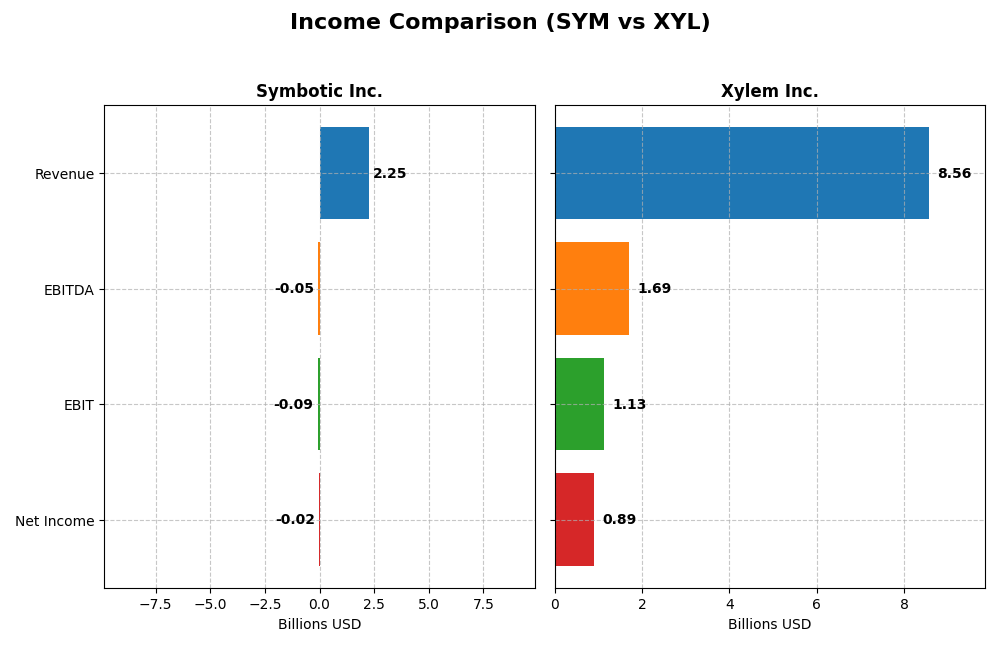
The table below presents a side-by-side comparison of the most recent fiscal year income statement metrics for Symbotic Inc. and Xylem Inc.
| Metric | Symbotic Inc. (SYM) | Xylem Inc. (XYL) |
|---|---|---|
| Market Cap | 42.8B | 34.0B |
| Revenue | 2.25B | 8.56B |
| EBITDA | -48.0M | 1.69B |
| EBIT | -92.1M | 1.13B |
| Net Income | -16.9M | 890M |
| EPS | -0.16 | 3.67 |
| Fiscal Year | 2025 | 2024 |
Income Statement Interpretations
Symbotic Inc.
Symbotic Inc. saw substantial revenue growth from 2021 to 2025, increasing from $252M to $2.25B, with net income losses narrowing over the period. Gross margins remained stable around 18.8%, but EBIT and net margins stayed negative, reflecting ongoing operating challenges. In 2025, revenue growth accelerated by 25.65%, though EBIT declined by 10.61%, indicating margin pressures despite top-line gains.
Xylem Inc.
Xylem Inc. experienced steady revenue growth, reaching $8.56B in 2024 from $4.88B in 2020, with net income rising strongly to $890M. Margins improved notably, with a 37.5% gross margin and a 10.4% net margin in 2024. The latest year showed favorable EBIT growth of 65.35% and a 25.69% increase in net margin, reflecting enhanced profitability alongside consistent operational efficiency.
Which one has the stronger fundamentals?
Xylem demonstrates stronger fundamentals with consistently favorable margin trends, positive and growing net income, and effective expense management. Symbotic, while showing impressive revenue growth and narrowing losses, still operates with negative EBIT and net margins, indicating ongoing profitability challenges. Overall, Xylem’s income statement reflects more robust and sustainable financial health.
Financial Ratios Comparison
The table below presents the most recent financial ratios for Symbotic Inc. (SYM) and Xylem Inc. (XYL) for their latest fiscal years, enabling a straightforward comparison of their key financial metrics.
| Ratios | Symbotic Inc. (2025) | Xylem Inc. (2024) |
|---|---|---|
| ROE | -7.65% | 8.36% |
| ROIC | -16.63% | 5.78% |
| P/E | -334.54 | 31.63 |
| P/B | 25.60 | 2.64 |
| Current Ratio | 1.08 | 1.75 |
| Quick Ratio | 0.99 | 1.33 |
| D/E | 0.14 | 0.20 |
| Debt-to-Assets | 1.32% | 12.88% |
| Interest Coverage | 0 | 22.93 |
| Asset Turnover | 0.94 | 0.52 |
| Fixed Asset Turnover | 15.92 | 7.43 |
| Payout ratio | 0 | 39.33% |
| Dividend yield | 0% | 1.24% |
Interpretation of the Ratios
Symbotic Inc.
Symbotic’s financial ratios show several weaknesses, including negative net margin (-0.75%) and return on equity (-7.65%), indicating profitability challenges. The firm has a high price-to-book ratio (25.6), suggesting overvaluation concerns, while leverage remains low and favorable. The company does not pay dividends, consistent with its negative earnings and focus on growth, reinvestment, and innovation.
Xylem Inc.
Xylem presents stronger financial ratios with a positive net margin of 10.39% and a solid current ratio of 1.75, supporting liquidity. However, return on equity (8.36%) and price-to-earnings ratio (31.63) are less favorable, implying moderate profitability and valuation concerns. Xylem pays dividends with a 1.24% yield, balancing shareholder returns alongside steady financial health.
Which one has the best ratios?
Xylem’s ratios are generally more favorable, with better profitability, liquidity, and dividend payments, while Symbotic struggles with losses and valuation issues. Despite some neutral and unfavorable metrics in both, Xylem’s balance of favorable ratios and shareholder returns positions it ahead in this comparison.
Strategic Positioning
This section compares the strategic positioning of Symbotic Inc. and Xylem Inc. in terms of market position, key segments, and exposure to technological disruption:
Symbotic Inc.
- Mid-sized player in industrial machinery with high beta, facing competitive pressure.
- Focused on warehouse automation systems, operation services, and software maintenance.
- Automation technology focus reduces disruption risk but limited exposure to other tech trends.
Xylem Inc.
- Large industrial machinery company with diversified global presence and moderate competitive pressure.
- Diversified segments: water infrastructure, applied water, measurement and control solutions.
- Offers smart meters, cloud analytics, and remote monitoring, showing active tech integration.
Symbotic Inc. vs Xylem Inc. Positioning
Symbotic is concentrated on automation for retail and wholesale logistics, relying heavily on its Symbotic System. Xylem’s broader diversification across water-related infrastructure and technology provides multiple business drivers but increases complexity. Symbotic’s niche focus contrasts with Xylem’s multi-segment approach.
Which has the best competitive advantage?
Both companies currently shed value relative to their cost of capital. Symbotic’s declining profitability marks a very unfavorable moat, while Xylem’s improving ROIC trend suggests a slightly unfavorable moat, indicating a potentially more resilient competitive advantage.
Stock Comparison
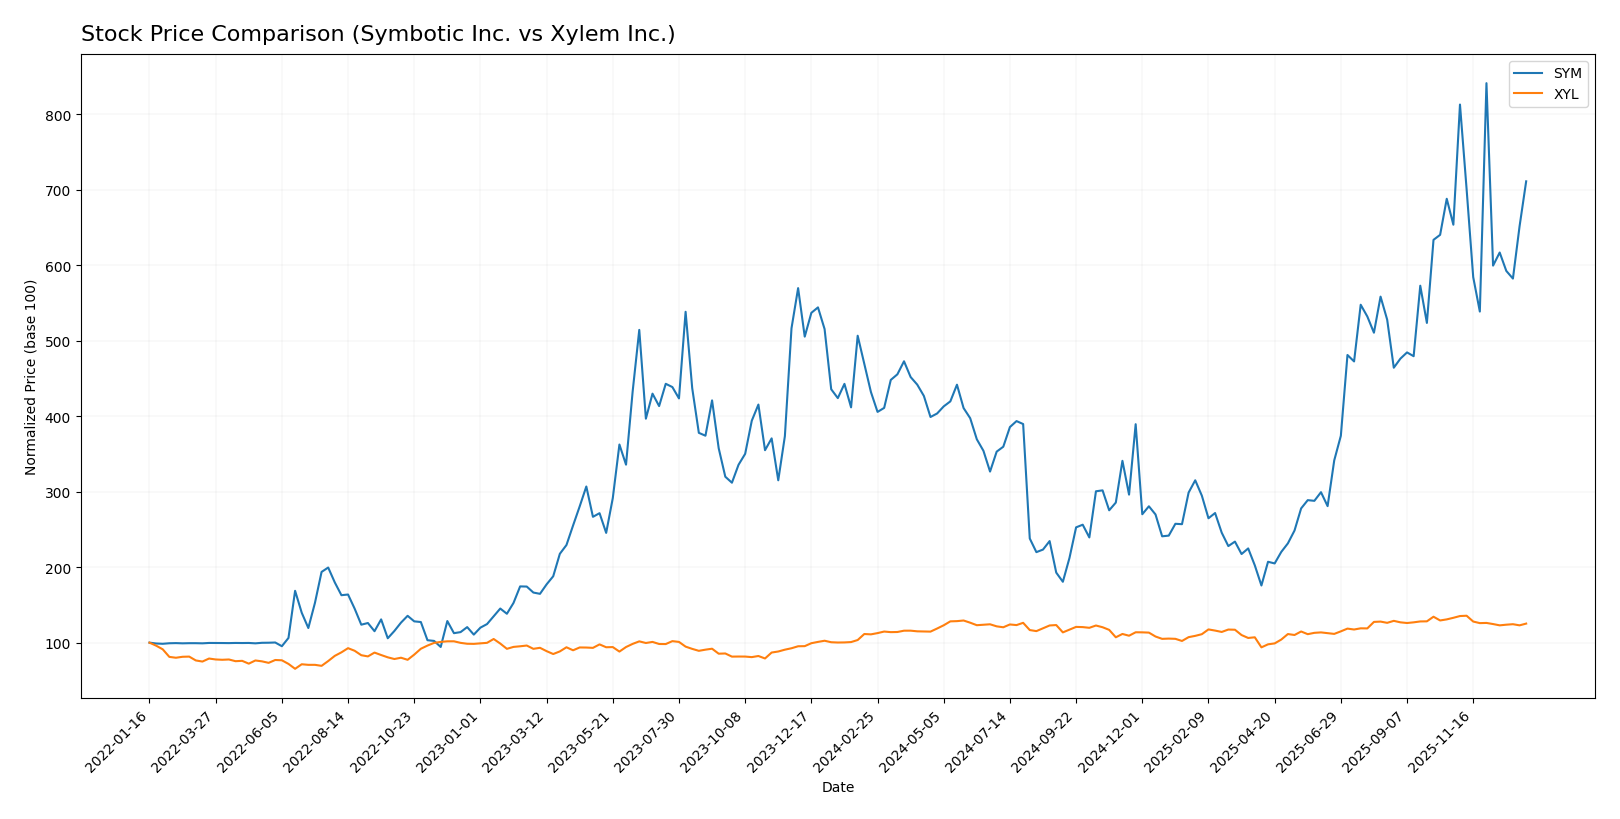
The stock price movements over the past year reveal a marked bullish trend for Symbotic Inc., with significant gains contrasted by a more moderate bullish trajectory for Xylem Inc., each exhibiting deceleration in momentum.
Trend Analysis
Symbotic Inc. (SYM) demonstrated a strong bullish trend over the past 12 months with a 64.58% price increase and a deceleration in acceleration. The stock showed high volatility with a standard deviation of 15.15, hitting a low of 17.5 and a high of 83.77.
Xylem Inc. (XYL) also exhibited a bullish trend over the past year, rising by 12.84%, yet with decelerating momentum. Its price volatility was lower than SYM’s, at a standard deviation of 9.45, and it traded between 104.6 and 151.31.
Comparing both stocks, Symbotic Inc. delivered the highest market performance with a 64.58% gain versus Xylem Inc.’s 12.84% over the past 12 months, despite both showing decelerating trends.
Target Prices
Here is the current analyst target price consensus for key industrial machinery companies.
| Company | Target High | Target Low | Consensus |
|---|---|---|---|
| Symbotic Inc. | 83 | 41 | 65.11 |
| Xylem Inc. | 178 | 150 | 169.43 |
Analysts expect Symbotic Inc.’s stock to slightly appreciate from its current price of $70.82, while Xylem Inc. shows a strong upside potential compared to its current $139.69, indicating more bullish sentiment.
Analyst Opinions Comparison
This section compares analysts’ ratings and grades for Symbotic Inc. and Xylem Inc.:
Rating Comparison
SYM Rating
- Rating: C+ with a very favorable status
- Discounted Cash Flow Score: 5, very favorable
- ROE Score: 1, very unfavorable
- ROA Score: 1, very unfavorable
- Debt To Equity Score: 3, moderate
- Overall Score: 2, moderate
XYL Rating
- Rating: B with a very favorable status
- Discounted Cash Flow Score: 3, moderate
- ROE Score: 3, moderate
- ROA Score: 4, favorable
- Debt To Equity Score: 3, moderate
- Overall Score: 3, moderate
Which one is the best rated?
Based on the provided data, Xylem Inc. holds higher scores in ROE, ROA, and overall rating compared to Symbotic Inc., which has a stronger discounted cash flow score but lower profitability metrics. Overall, Xylem is better rated.
Scores Comparison
Here is a comparison of the Altman Z-Score and Piotroski Score for Symbotic Inc. and Xylem Inc.:
SYM Scores
- Altman Z-Score: 13.05, indicating a safe zone with very low bankruptcy risk.
- Piotroski Score: 3, classified as very weak financial strength.
XYL Scores
- Altman Z-Score: 4.89, also in the safe zone, showing low bankruptcy risk.
- Piotroski Score: 8, classified as very strong financial strength.
Which company has the best scores?
Based on the provided scores, SYM has a higher Altman Z-Score, indicating stronger bankruptcy safety, while XYL has a significantly stronger Piotroski Score, reflecting better overall financial strength.
Grades Comparison
Here is a detailed comparison of the recent grades assigned to Symbotic Inc. and Xylem Inc. by major grading companies:
Symbotic Inc. Grades
The table below summarizes the latest grades from reputable financial institutions for Symbotic Inc.:
| Grading Company | Action | New Grade | Date |
|---|---|---|---|
| Goldman Sachs | Downgrade | Sell | 2025-12-02 |
| Barclays | Maintain | Underweight | 2025-11-26 |
| Baird | Maintain | Neutral | 2025-11-26 |
| Craig-Hallum | Upgrade | Buy | 2025-11-25 |
| Northland Capital Markets | Maintain | Outperform | 2025-11-25 |
| Needham | Maintain | Buy | 2025-11-25 |
| Cantor Fitzgerald | Maintain | Overweight | 2025-11-25 |
| DA Davidson | Maintain | Neutral | 2025-11-25 |
| Citigroup | Maintain | Buy | 2025-11-25 |
| UBS | Downgrade | Sell | 2025-09-23 |
The grades for Symbotic Inc. show a mixed trend with notable downgrades to Sell by Goldman Sachs and UBS, balanced by several Buy and Outperform ratings from other firms.
Xylem Inc. Grades
The following table presents the most recent grades for Xylem Inc. by recognized grading companies:
| Grading Company | Action | New Grade | Date |
|---|---|---|---|
| Barclays | Maintain | Overweight | 2026-01-07 |
| Mizuho | Maintain | Neutral | 2026-01-05 |
| TD Cowen | Maintain | Hold | 2025-12-05 |
| UBS | Maintain | Buy | 2025-11-06 |
| RBC Capital | Maintain | Outperform | 2025-10-29 |
| Stifel | Maintain | Buy | 2025-10-29 |
| Barclays | Maintain | Overweight | 2025-10-29 |
| Citigroup | Maintain | Buy | 2025-10-29 |
| Citigroup | Maintain | Buy | 2025-10-09 |
| Mizuho | Maintain | Neutral | 2025-09-12 |
Xylem Inc.’s grades are consistently positive or neutral, with no downgrades, reflecting stable confidence from analysts.
Which company has the best grades?
Symbotic Inc. has a consensus Buy rating supported by 9 Buy and 4 Sell grades, showing some analyst divergence. Xylem Inc. holds a consensus Hold rating with a strong presence of Buy and Outperform grades but also many Holds. Overall, Xylem’s ratings demonstrate more stability and fewer downgrades, which could suggest lower perceived risk for investors compared to Symbotic’s mixed signals.
Strengths and Weaknesses
Below is a comparison of key strengths and weaknesses of Symbotic Inc. (SYM) and Xylem Inc. (XYL) based on recent financial and operational data.
| Criterion | Symbotic Inc. (SYM) | Xylem Inc. (XYL) |
|---|---|---|
| Diversification | Moderate: Focused on Systems (2.12B), with smaller segments in Operation Services and Software Support | High: Diverse segments including Water Infrastructure (2.56B), Water Solutions & Services (2.34B), Applied Water, and Measurement & Control Solutions |
| Profitability | Weak: Negative net margin (-0.75%), negative ROIC (-16.63%), and declining profitability trend | Moderate: Positive net margin (10.39%), slightly unfavorable ROE (8.36%), ROIC slightly above cost of capital and improving |
| Innovation | Low: Negative ROIC trend signals challenges in value creation and innovation impact | Moderate: Growing ROIC trend suggests improving efficiency and innovation in solutions |
| Global presence | Limited data; primarily focused on automation systems | Strong: Broad global water infrastructure and solutions footprint |
| Market Share | Niche focus on automation systems with growing revenue | Large market share in water-related infrastructure and technology |
In summary, Symbotic faces significant profitability challenges despite its growing systems revenue, indicating risks for investors. Xylem shows more balanced diversification and improving profitability, supported by its global footprint and varied product segments, making it a more stable choice in this comparison.
Risk Analysis
Below is a comparison table of key risks for Symbotic Inc. (SYM) and Xylem Inc. (XYL) based on the most recent data available in 2026:
| Metric | Symbotic Inc. (SYM) | Xylem Inc. (XYL) |
|---|---|---|
| Market Risk | High beta (2.14) indicates high volatility | Moderate beta (1.17) suggests lower volatility |
| Debt level | Low debt-to-equity ratio (0.14) favorable | Moderate debt-to-equity ratio (0.20) favorable but higher leverage than SYM |
| Regulatory Risk | Moderate; operates mainly in US industrial automation | Higher; global operations expose it to multiple regulatory environments |
| Operational Risk | Unfavorable profitability and ROE suggest operational challenges | Stable profitability with favorable margins and efficiency |
| Environmental Risk | Moderate; industrial machinery sector with automation focus | Elevated; water treatment industry faces environmental compliance pressures |
| Geopolitical Risk | Low; US-based operations with limited international exposure | Moderate to high; multinational presence increases geopolitical uncertainties |
Symbotic faces higher market volatility and operational risks due to negative profitability and efficiency ratios, despite low debt. Xylem, with stronger financial health and diversified markets, carries moderate regulatory and geopolitical risks linked to its international footprint, but benefits from stable margins and strong financial scores. Investors should weigh Symbotic’s growth potential against its operational weaknesses, while Xylem offers steadier risk-managed exposure.
Which Stock to Choose?
Symbotic Inc. (SYM) has shown strong revenue growth of 25.65% in the last year and 792% overall, but profitability remains negative with a net margin of -0.75% and declining returns on equity and invested capital. Its financial ratios are slightly unfavorable, with modest debt levels and a current ratio near 1.08. The company’s rating is very favorable (C+), yet its economic moat is very unfavorable, indicating value destruction and decreasing profitability.
Xylem Inc. (XYL) demonstrates favorable profitability metrics, including a net margin of 10.39% and positive earnings growth. Its financial ratios are slightly favorable with a healthy current ratio of 1.75, manageable debt, and a strong interest coverage ratio. The company holds a very favorable rating (B) and a slightly unfavorable moat, reflecting some value destruction but improving profitability trends.
Investors prioritizing growth might find SYM’s rapid revenue expansion appealing despite its current profitability challenges and weaker moat, while those valuing stable profitability and stronger financial ratios could lean toward XYL, given its consistent margins and improving returns. The choice may depend on the investor’s risk tolerance and preference for growth versus stability.
Disclaimer: Investment carries a risk of loss of initial capital. The past performance is not a reliable indicator of future results. Be sure to understand risks before making an investment decision.
Go Further
I encourage you to read the complete analyses of Symbotic Inc. and Xylem Inc. to enhance your investment decisions: