Symbotic Inc. and Kadant Inc. are two prominent players in the industrial machinery sector, both leveraging innovative technologies to optimize operations. Symbotic focuses on advanced warehouse automation, while Kadant offers diverse engineered systems across multiple industrial segments. Their shared emphasis on efficiency and technology makes them compelling candidates for comparison. In this article, I will help you determine which company presents the most intriguing investment opportunity in 2026.
Table of contents
Companies Overview
I will begin the comparison between Symbotic Inc. and Kadant Inc. by providing an overview of these two companies and their main differences.
Symbotic Inc. Overview
Symbotic Inc. is an automation technology firm focused on enhancing efficiency for retailers and wholesalers in the US. It offers The Symbotic System, a comprehensive warehouse automation solution designed to reduce costs and improve inventory management. The company operates in the industrial machinery sector and is headquartered in Wilmington, Massachusetts, with a market cap of approximately 42.8B USD.
Kadant Inc. Overview
Kadant Inc. supplies technologies and engineered systems globally, operating through three segments: Flow Control, Industrial Processing, and Material Handling. Its products serve diverse industries including packaging, tissue, wood products, and alternative fuels. Kadant is also based in Massachusetts, with a market cap of around 3.76B USD and a workforce of 3,500 employees.
Key similarities and differences
Both Symbotic and Kadant operate in the industrial machinery sector and are headquartered in Massachusetts, focusing on technology-driven solutions. However, Symbotic specializes in warehouse automation for retail and wholesale markets, while Kadant offers a broader range of engineered systems across multiple industrial segments. Symbotic’s market cap is significantly larger, reflecting differing scales and market focuses.
Income Statement Comparison
This table presents a side-by-side comparison of the latest fiscal year income statement metrics for Symbotic Inc. and Kadant Inc., reflecting their financial performance in 2025 and 2024 respectively.
| Metric | Symbotic Inc. (SYM) | Kadant Inc. (KAI) |
|---|---|---|
| Market Cap | 42.8B | 3.76B |
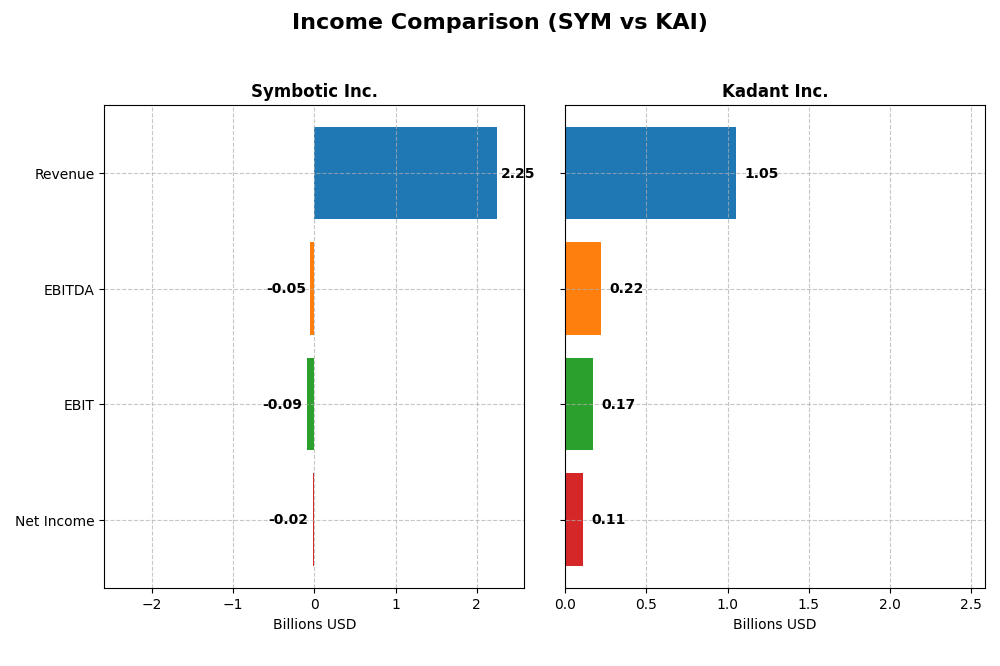
| Revenue | 2.25B | 1.05B |
| EBITDA | -48.0M | 223M |
| EBIT | -92.1M | 173M |
| Net Income | -16.9M | 111.6M |
| EPS | -0.16 | 9.51 |
| Fiscal Year | 2025 | 2024 |
Income Statement Interpretations
Symbotic Inc.
Symbotic’s revenue surged from 251M in 2021 to 2.25B in 2025, showing strong growth, while net income remained negative but improved from -122M to -17M. Gross margins stayed stable around 18.8%, yet EBIT and net margins remained unfavorable, reflecting ongoing operational challenges. In 2025, revenue growth accelerated by 25.7%, but EBIT declined by 10.6%, signaling margin pressures.
Kadant Inc.
Kadant demonstrated steady revenue growth from 635M in 2020 to over 1.05B in 2024, with net income rising from 55M to 112M. Margins remain solid with a gross margin above 44% and EBIT margin around 16.4%. The latest year saw a 10% revenue increase and modest EBIT growth, although net margin and EPS slightly declined, indicating some margin compression despite overall profitability.
Which one has the stronger fundamentals?
Kadant exhibits stronger fundamentals with consistent profitability, higher margins, and positive net income, supported by a favorable income statement evaluation of 71%. Symbotic shows impressive revenue growth but struggles with persistent losses and negative EBIT margins. Kadant’s stable earnings and margin profiles suggest more robust operational efficiency compared to Symbotic’s ongoing cost challenges.
Financial Ratios Comparison
Below is a comparison of key financial ratios for Symbotic Inc. (SYM) and Kadant Inc. (KAI) based on their most recent fiscal year data.
| Ratios | Symbotic Inc. (SYM) 2025 | Kadant Inc. (KAI) 2024 |
|---|---|---|
| ROE | -7.65% | 13.17% |
| ROIC | -16.63% | 10.08% |
| P/E | -334.54 | 36.90 |
| P/B | 25.60 | 4.86 |
| Current Ratio | 1.08 | 2.31 |
| Quick Ratio | 0.99 | 1.55 |
| D/E (Debt-to-Equity) | 0.14 | 0.38 |
| Debt-to-Assets | 1.32% | 22.57% |
| Interest Coverage | 0 | 8.55 |
| Asset Turnover | 0.94 | 0.74 |
| Fixed Asset Turnover | 15.92 | 6.18 |
| Payout Ratio | 0 | 13.15% |
| Dividend Yield | 0% | 0.36% |
Interpretation of the Ratios
Symbotic Inc.
Symbotic Inc. shows several unfavorable ratios, including negative net margin (-0.75%) and return on equity (-7.65%), indicating profitability and efficiency challenges. However, it benefits from favorable debt ratios and a strong fixed asset turnover of 15.92. The company does not pay dividends, likely reflecting ongoing reinvestment and a growth-focused strategy.
Kadant Inc.
Kadant Inc. presents mostly favorable ratios, such as a positive net margin of 10.59% and a robust current ratio of 2.31, signaling solid liquidity and profitability. Some ratios like price-to-earnings (36.9) and dividend yield (0.36%) are less favorable. The firm pays dividends with a modest yield, suggesting a balanced approach to shareholder returns and operational stability.
Which one has the best ratios?
Kadant Inc. holds a favorable overall ratios opinion with 57.14% favorable metrics, including strong profitability and liquidity. By contrast, Symbotic Inc. is slightly unfavorable, burdened by losses and weak returns despite some strengths in asset management and leverage. Kadant’s profile indicates a more stable financial footing relative to Symbotic.
Strategic Positioning
This section compares the strategic positioning of Symbotic Inc. and Kadant Inc. including Market position, Key segments, and exposure to disruption:
Symbotic Inc. (SYM)
- Larger market cap of 42.8B facing industrial machinery peers with high beta of 2.14
- Focuses on warehouse automation systems, operation services, and software maintenance
- Automation technology exposed to ongoing robotics and software innovation risks
Kadant Inc. (KAI)
- Smaller market cap of 3.76B with moderate beta of 1.25 in industrial machinery sector
- Diversified in flow control, industrial processing, material handling with capital and consumables segments
- Exposure to engineered systems and fluid-handling technology disruption, with industrial automation focus
Symbotic Inc. (SYM) vs Kadant Inc. (KAI) Positioning
SYM is concentrated in automation technology for retail and wholesale logistics, relying heavily on systems revenue. KAI is diversified across multiple industrial segments, spreading risk but with smaller overall scale. SYM targets efficiency gains, while KAI serves varied industrial needs.
Which has the best competitive advantage?
Based on MOAT evaluation, KAI shows a slightly favorable position with growing ROIC, indicating improving profitability. SYM has a very unfavorable MOAT with declining ROIC, suggesting value destruction and weaker competitive advantage.
Stock Comparison
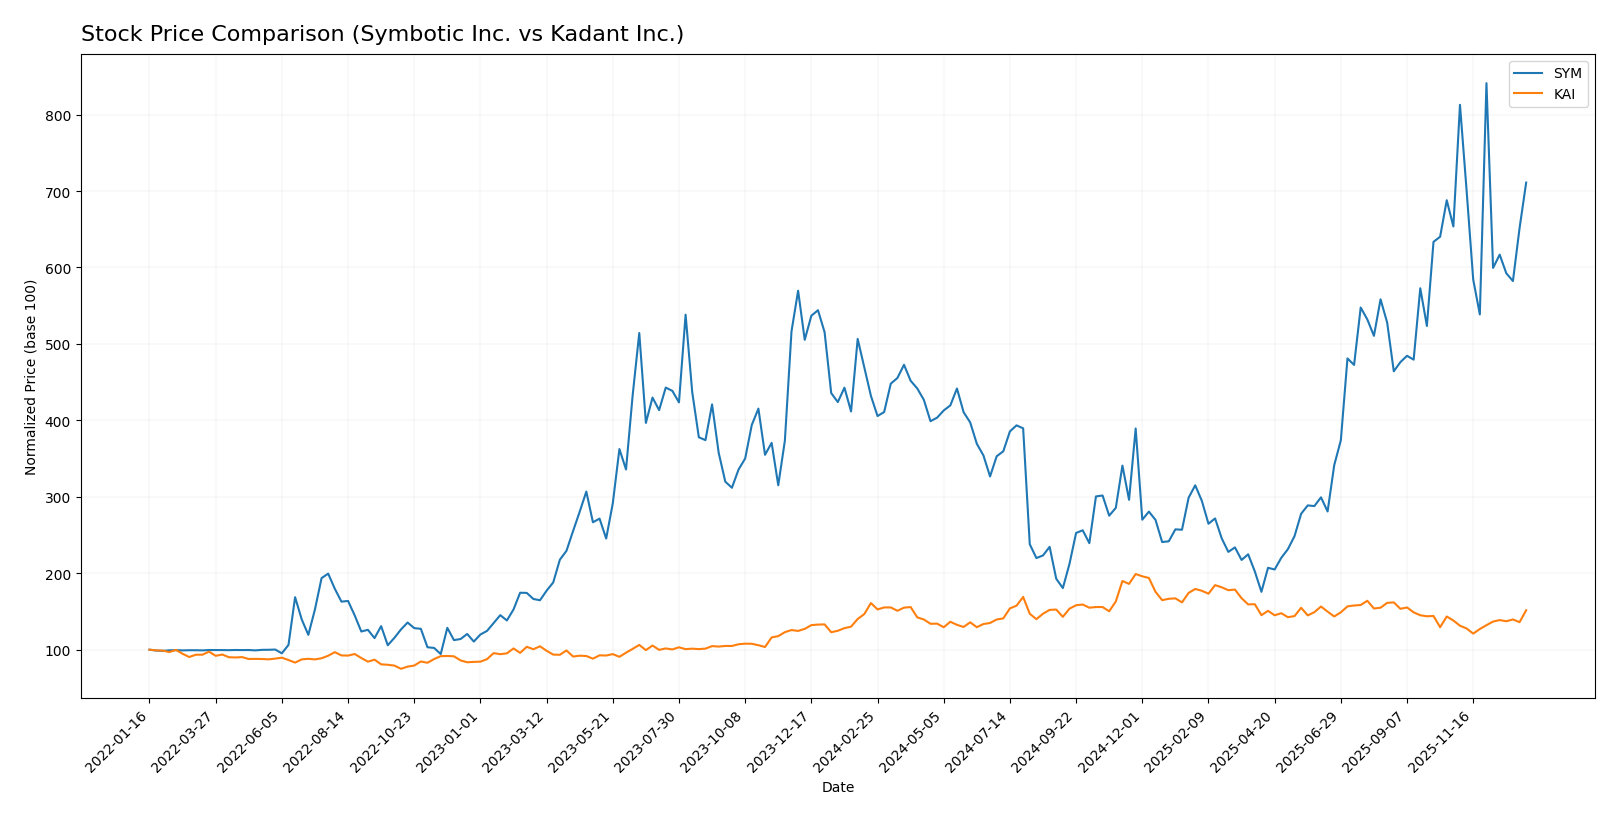
The past year has exhibited contrasting price movements and trading dynamics between Symbotic Inc. and Kadant Inc., with Symbotic showing a strong bullish trend while Kadant reflects a bearish trajectory despite recent recovery signs.
Trend Analysis
Symbotic Inc. (SYM) demonstrated a 64.58% price increase over the past 12 months, indicating a bullish trend with deceleration. Its price ranged from a low of 17.5 to a high of 83.77, and volatility measured by standard deviation is moderate at 15.15.
Kadant Inc. (KAI) experienced a 5.86% price decline over the same period, reflecting a bearish trend with acceleration. The stock price fluctuated between 254.91 and 419.01, accompanied by higher volatility at 34.44 standard deviation.
Comparing both, Symbotic’s stock has delivered the highest market performance over the past year, with a substantial positive price change, whereas Kadant’s stock has declined overall despite a recent short-term upward trend.
Target Prices
The target price consensus for Symbotic Inc. and Kadant Inc. reflects a positive outlook from analysts.
| Company | Target High | Target Low | Consensus |
|---|---|---|---|
| Symbotic Inc. | 83 | 41 | 65.11 |
| Kadant Inc. | 410 | 275 | 342.5 |
Analysts expect Symbotic Inc.’s price to hover slightly below its current price of 70.82 USD, while Kadant Inc.’s consensus target price of 342.5 USD suggests room for moderate appreciation from its current 319.22 USD.
Analyst Opinions Comparison
This section compares analysts’ ratings and grades for Symbotic Inc. and Kadant Inc.:
Rating Comparison
SYM Rating
- Rating: C+, considered Very Favorable by analysts.
- Discounted Cash Flow Score: 5, indicating a Very Favorable valuation based on future cash flows.
- ROE Score: 1, rated Very Unfavorable for efficiency in generating profit from equity.
- ROA Score: 1, rated Very Unfavorable for asset utilization efficiency.
- Debt To Equity Score: 3, evaluated as Moderate financial risk.
- Overall Score: 2, categorized as Moderate financial standing.
KAI Rating
- Rating: B, considered Very Favorable by analysts.
- Discounted Cash Flow Score: 3, reflecting a Moderate valuation based on future cash flows.
- ROE Score: 3, rated Moderate for profit generation efficiency.
- ROA Score: 4, rated Favorable for effective asset utilization.
- Debt To Equity Score: 3, evaluated as Moderate financial risk.
- Overall Score: 3, categorized as Moderate financial standing.
Which one is the best rated?
Based strictly on the provided data, Kadant Inc. holds a higher overall rating (B vs. C+) and better scores in ROE and ROA, indicating stronger profitability and asset efficiency compared to Symbotic Inc.
Scores Comparison
Here is a comparison of the Altman Z-Score and Piotroski Score for Symbotic Inc. and Kadant Inc.:
SYM Scores
- Altman Z-Score: 13.05, indicating a safe financial zone with very low bankruptcy risk.
- Piotroski Score: 3, classified as very weak, suggesting poor financial strength.
KAI Scores
- Altman Z-Score: 5.59, also in the safe zone, showing solid financial stability.
- Piotroski Score: 7, rated strong, reflecting good financial health and value.
Which company has the best scores?
Kadant Inc. shows a strong Piotroski Score of 7 compared to Symbotic’s very weak score of 3, while both have Altman Z-Scores in the safe zone. Kadant’s higher Piotroski Score indicates better overall financial strength.
Grades Comparison
Here is a detailed comparison of the latest grades assigned to Symbotic Inc. and Kadant Inc.:
Symbotic Inc. Grades
The following table summarizes recent grades from leading financial institutions for Symbotic Inc.:
| Grading Company | Action | New Grade | Date |
|---|---|---|---|
| Goldman Sachs | Sell | Sell | 2025-12-02 |
| Barclays | Hold | Underweight | 2025-11-26 |
| Baird | Hold | Neutral | 2025-11-26 |
| Craig-Hallum | Buy | Buy | 2025-11-25 |
| Northland Capital Markets | Hold | Outperform | 2025-11-25 |
| Needham | Buy | Buy | 2025-11-25 |
| Cantor Fitzgerald | Buy | Overweight | 2025-11-25 |
| DA Davidson | Hold | Neutral | 2025-11-25 |
| Citigroup | Buy | Buy | 2025-11-25 |
| UBS | Sell | Sell | 2025-09-23 |
Symbotic Inc. shows a mixed rating trend, with notable downgrades to Sell by Goldman Sachs and UBS, balanced by several Buy and Outperform ratings.
Kadant Inc. Grades
The following table summarizes recent grades from leading financial institutions for Kadant Inc.:
| Grading Company | Action | New Grade | Date |
|---|---|---|---|
| Barrington Research | Hold | Outperform | 2025-10-30 |
| Barrington Research | Hold | Outperform | 2025-10-29 |
| Barrington Research | Hold | Outperform | 2025-10-27 |
| Barrington Research | Hold | Outperform | 2025-10-10 |
| Barrington Research | Hold | Outperform | 2025-09-23 |
| DA Davidson | Hold | Neutral | 2025-08-04 |
| Barrington Research | Hold | Outperform | 2025-07-30 |
| Barrington Research | Hold | Outperform | 2025-07-29 |
| Barrington Research | Hold | Outperform | 2025-05-01 |
| DA Davidson | Hold | Neutral | 2025-05-01 |
Kadant Inc. maintains a consistent Outperform rating from Barrington Research and a Neutral rating from DA Davidson, indicating stable confidence.
Which company has the best grades?
Symbotic Inc. has a wider range of ratings, including several Buy and Outperform grades alongside some recent Sell downgrades, indicating mixed sentiment. Kadant Inc. shows more consistent Outperform and Neutral grades without Sell ratings, suggesting steadier analyst confidence. This contrast may affect investor perception of risk and potential returns.
Strengths and Weaknesses
Below is a comparison of key strengths and weaknesses for Symbotic Inc. (SYM) and Kadant Inc. (KAI) based on their latest financial and operational data.
| Criterion | Symbotic Inc. (SYM) | Kadant Inc. (KAI) |
|---|---|---|
| Diversification | Focused primarily on Systems (2.12B in 2025) with smaller segments in Operation Services and Software Support; moderate diversification. | Balanced revenue split between Parts and Consumables (694M) and Capital goods (360M); moderate diversification. |
| Profitability | Negative net margin (-0.75%) and ROIC (-16.63%) with declining profitability; value destroying. | Positive net margin (10.59%) and ROIC (10.08%) with improving profitability; value creating. |
| Innovation | High fixed asset turnover (15.92) suggests operational efficiency but lacks evidence of sustainable innovation; declining ROIC warns of weak moat. | Growing ROIC and profitable operations indicate innovation and competitive improvements; moderate asset turnover (6.18). |
| Global presence | Global moat status very unfavorable; likely limited competitive advantage internationally. | Slightly favorable moat and improving profitability suggest increasing global competitiveness. |
| Market Share | Large Systems segment but shrinking returns imply market pressure or inefficiencies. | Steady growth in parts and capital segments supports stable market position. |
Key takeaways: Kadant Inc. demonstrates stronger profitability, improving returns, and a favorable financial profile, indicating a more secure investment. Symbotic Inc. struggles with declining profitability and value destruction, requiring cautious consideration and further risk management.
Risk Analysis
Below is a summary table highlighting the key risks for Symbotic Inc. (SYM) and Kadant Inc. (KAI) based on the most recent data:
| Metric | Symbotic Inc. (SYM) | Kadant Inc. (KAI) |
|---|---|---|
| Market Risk | High beta (2.14), volatile price range (16.3-87.9) | Moderate beta (1.25), stable price range (244.9-409.7) |
| Debt level | Low debt-to-equity (0.14), very low debt-to-assets (1.3%) | Moderate debt-to-equity (0.38), debt-to-assets 22.6% |
| Regulatory Risk | Moderate, US industrial sector with no recent major issues | Moderate, operates worldwide, exposed to multiple regulations |
| Operational Risk | Negative profitability, weak ROE and ROIC, thin margins | Positive profitability, solid ROE, diversified segments |
| Environmental Risk | Limited exposure, industrial automation focus | Moderate, some segments involve material handling with environmental impact |
| Geopolitical Risk | Low, mostly US-based operations | Moderate, global operations sensitive to trade policies |
Symbotic faces higher market and operational risks due to its negative margins, weak returns, and high stock volatility. Kadant shows stronger financial health and lower operational risk but carries moderate exposure to global regulatory and geopolitical factors. Investors should weigh Symbotic’s growth potential against its financial instability and higher volatility.
Which Stock to Choose?
Symbotic Inc. (SYM) shows strong revenue growth of 791.94% over 2021-2025 but suffers from negative profitability and unfavorable returns on equity and capital. Its debt ratios are favorable, yet its overall financial ratios assessment remains slightly unfavorable with a very unfavorable economic moat and a moderate company rating.
Kadant Inc. (KAI) displays balanced income growth of 65.88% over 2020-2024, favorable profitability with positive net margin and return on assets, and solid debt management. Its financial ratios are largely favorable, the economic moat is slightly favorable due to improving ROIC, and its rating is very favorable with strong financial scores.
For investors focused on growth, SYM’s rapid revenue expansion might appear attractive despite profitability challenges and a weak moat. Conversely, those prioritizing financial stability and consistent returns may find KAI’s solid profitability and improving economic moat more aligned with a quality or value investing approach.
Disclaimer: Investment carries a risk of loss of initial capital. The past performance is not a reliable indicator of future results. Be sure to understand risks before making an investment decision.
Go Further
I encourage you to read the complete analyses of Symbotic Inc. and Kadant Inc. to enhance your investment decisions: