Symbotic Inc. (SYM) and JBT Marel Corporation (JBTM) are two key players in the industrial machinery sector, each driving innovation through automation and technology. Symbotic focuses on warehouse robotics for retailers and wholesalers, while JBT Marel specializes in advanced processing solutions for the global food and beverage industry. This article will explore their market positions and innovation strategies to help you decide which company offers the most promising investment opportunity.
Table of contents
Companies Overview
I will begin the comparison between Symbotic Inc. and JBT Marel Corporation by providing an overview of these two companies and their main differences.
Symbotic Inc. Overview
Symbotic Inc. is an automation technology company specializing in robotics and technology to enhance efficiency for retailers and wholesalers in the US. Its flagship offering, The Symbotic System, is a comprehensive warehouse automation solution designed to reduce costs, boost operational efficiency, and optimize inventory management. The company operates within the industrial machinery sector and is headquartered in Wilmington, Massachusetts.
JBT Marel Corporation Overview
JBT Marel Corporation delivers technology solutions to the food and beverage industry across multiple regions including North America, Europe, and Asia Pacific. It offers a broad range of value-added processing and packaging solutions, along with automated guided vehicle systems for manufacturing and medical facilities. Formerly known as John Bean Technologies, the company serves diverse industries and is headquartered in Chicago, Illinois, within the industrial machinery sector.
Key similarities and differences
Both Symbotic and JBT Marel operate in the industrial machinery sector, focusing on automation technology. Symbotic primarily targets warehouse automation for retail and wholesale clients, while JBT Marel serves the food, beverage, and health markets with extensive processing and packaging solutions. JBT Marel has a broader international footprint and larger workforce compared to Symbotic, which has a more specialized product offering concentrated in the US.
Income Statement Comparison
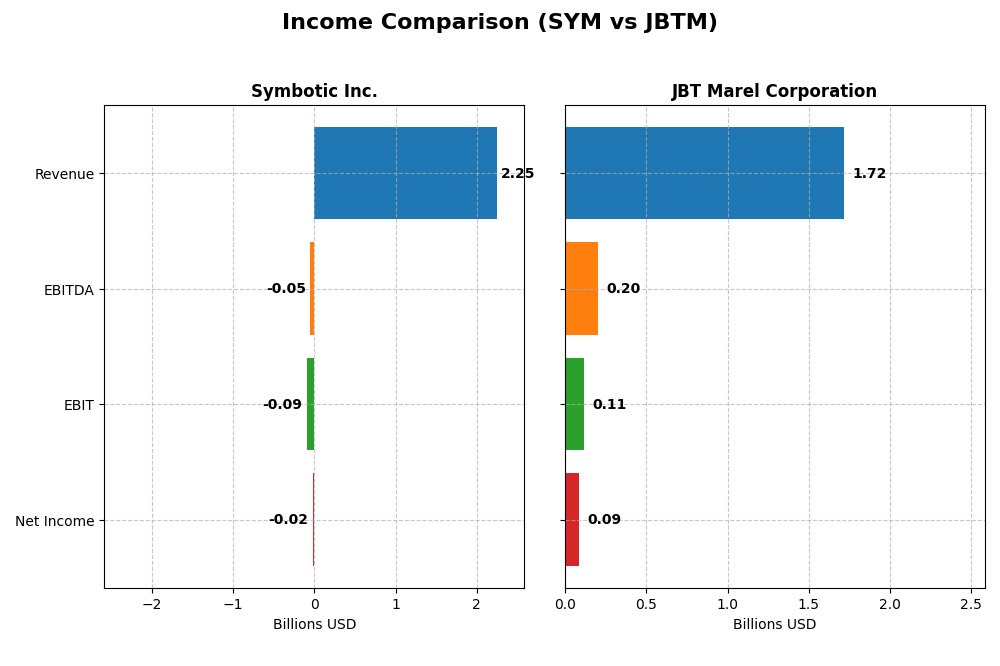
This table compares the key income statement metrics for Symbotic Inc. (SYM) and JBT Marel Corporation (JBTM) based on their most recent fiscal year data.
| Metric | Symbotic Inc. (SYM) | JBT Marel Corporation (JBTM) |
|---|---|---|
| Market Cap | 42.8B | 8.1B |
| Revenue | 2.25B | 1.72B |
| EBITDA | -48.0M | 204.2M |
| EBIT | -92.1M | 114.8M |
| Net Income | -16.9M | 85.4M |
| EPS | -0.16 | 2.67 |
| Fiscal Year | 2025 | 2024 |
Income Statement Interpretations
Symbotic Inc.
Symbotic Inc. experienced strong revenue growth from 2021 to 2025, surging from $252M to $2.25B, with net income improving but remaining negative at -$17M in 2025. Gross margins held steady around 18.8%, while EBIT and net margins stayed unfavorable below zero. The 2025 revenue growth of 25.7% was favorable, though EBIT declined 10.6%, reflecting ongoing operating challenges.
JBT Marel Corporation
JBT Marel’s revenue showed moderate growth from $1.4B in 2020 to $1.72B in 2024, but net income declined overall, falling to $85.4M in 2024 from $109M in 2020. The company maintained favorable gross margins near 36.5%, with EBIT at 6.7% margin in 2024. However, recent year growth slowed, with EBIT and net margin dropping sharply, indicating margin pressure.
Which one has the stronger fundamentals?
Symbotic displays robust revenue expansion and improving net income trends despite persistent losses and negative operating margins, with half of its income statement metrics favorable. JBT Marel has stronger profitability margins but faces declining net income and unfavorable growth over the period, with a majority of its metrics unfavorable. The fundamentals comparison highlights growth strength for Symbotic versus profitability challenges for JBT Marel.
Financial Ratios Comparison
The table below presents a side-by-side comparison of key financial ratios for Symbotic Inc. (SYM) and JBT Marel Corporation (JBTM) based on their most recent fiscal year data.
| Ratios | Symbotic Inc. (2025) | JBT Marel Corporation (2024) |
|---|---|---|
| ROE | -7.65% | 5.53% |
| ROIC | -16.63% | 3.65% |
| P/E | -335 | 47.63 |
| P/B | 25.60 | 2.63 |
| Current Ratio | 1.08 | 3.48 |
| Quick Ratio | 0.99 | 3.04 |
| D/E (Debt-to-Equity) | 0.14 | 0.81 |
| Debt-to-Assets | 1.32% | 36.68% |
| Interest Coverage | 0 | 6.10 |
| Asset Turnover | 0.94 | 0.50 |
| Fixed Asset Turnover | 15.92 | 7.34 |
| Payout Ratio | 0 | 15.34% |
| Dividend Yield | 0 | 0.32% |
Interpretation of the Ratios
Symbotic Inc.
Symbotic’s financial ratios reveal several weaknesses, including negative net margin (-0.75%) and return on equity (-7.65%), both unfavorable. Its valuation shows a high price-to-book ratio (25.6), indicating premium pricing, while leverage ratios like debt-to-equity (0.14) are favorable. The company does not pay dividends, likely reflecting ongoing investments in R&D and growth, with no payout risks.
JBT Marel Corporation
JBT Marel shows mixed ratios with modest profitability: net margin at 4.98% and return on equity at 5.53%, both labeled unfavorable despite positive returns. The firm maintains a strong quick ratio (3.04) and interest coverage (5.92), indicating solid liquidity and debt servicing. It pays a dividend with a 0.32% yield, suggesting steady but limited shareholder returns without excessive payout risks.
Which one has the best ratios?
Both companies exhibit slightly unfavorable overall ratio profiles, but JBT Marel demonstrates stronger operational liquidity and interest coverage, along with positive profitability metrics. Symbotic’s negative returns and high valuation multiples highlight more risk. Therefore, JBT Marel’s ratios suggest a relatively more stable financial position compared to Symbotic’s current challenges.
Strategic Positioning
This section compares the strategic positioning of Symbotic Inc. and JBT Marel Corporation, focusing on market position, key segments, and exposure to technological disruption:
Symbotic Inc.
- Large market cap at 42.7B USD; operates in industrial machinery with high beta indicating volatility.
- Key segments include warehouse automation systems, software maintenance, and operation services.
- Focused on warehouse automation with robotics technology to improve efficiency in retail and wholesale.
JBT Marel Corporation
- Smaller market cap at 8.1B USD; industrial machinery sector with lower beta, suggesting moderate volatility.
- Diverse segments in food and beverage processing technology across multiple industries and regions.
- Provides broad technology solutions including automated guided vehicles, impacting various manufacturing sectors.
Symbotic Inc. vs JBT Marel Corporation Positioning
Symbotic concentrates on warehouse automation with robotics, driving growth through a focused product offering. JBT Marel pursues a diversified approach across food processing and automation industries, which may spread operational risks but also require managing complexity.
Which has the best competitive advantage?
Both companies exhibit very unfavorable MOAT evaluations with declining ROIC trends and value destruction, indicating neither currently maintains a strong competitive advantage based on capital efficiency.
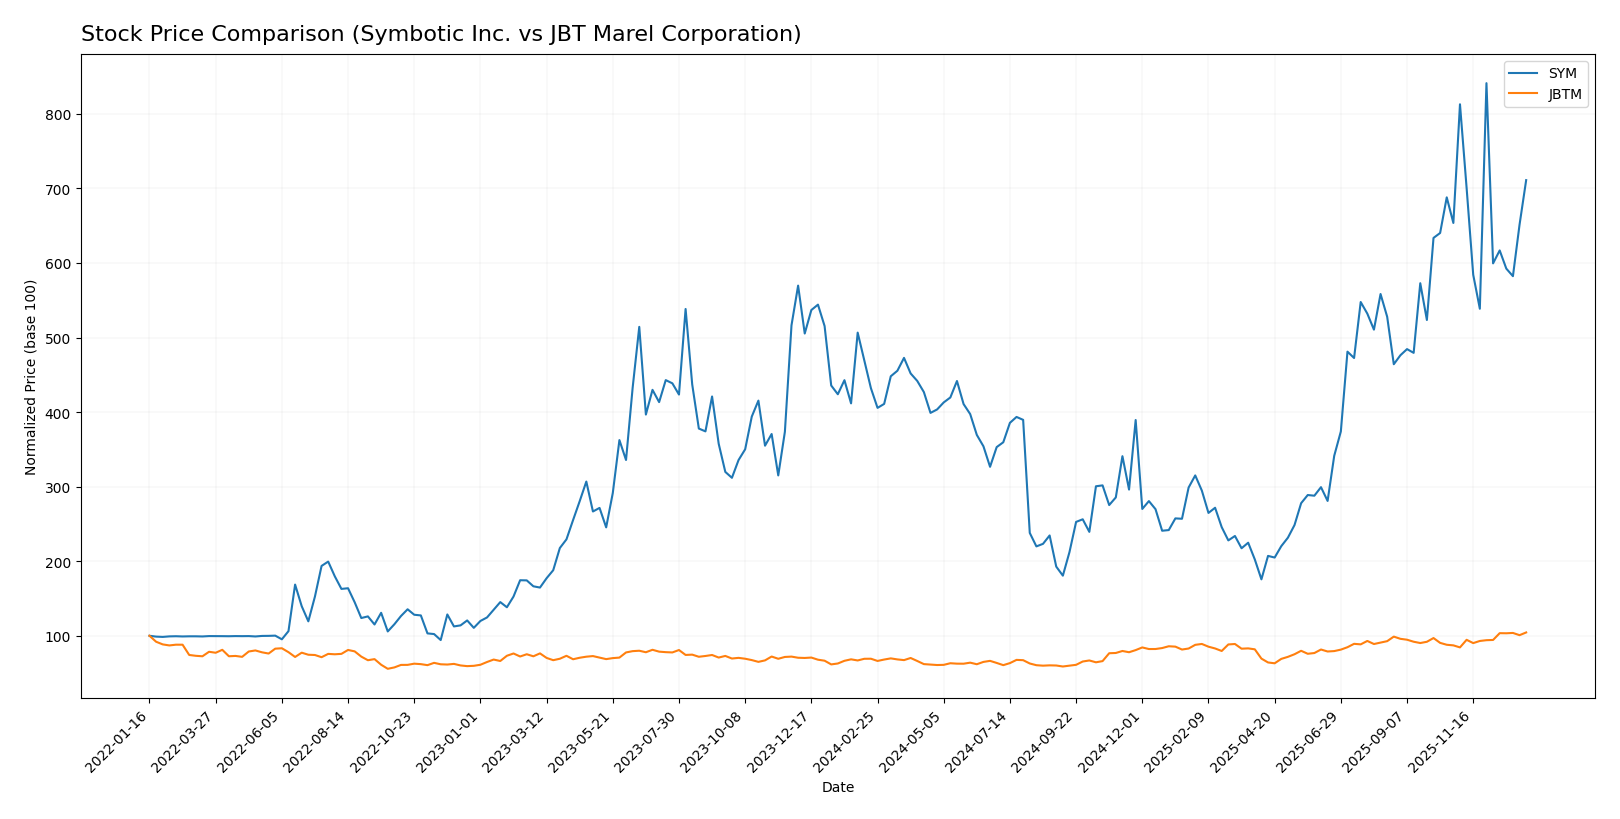
Stock Comparison
The stock prices of Symbotic Inc. (SYM) and JBT Marel Corporation (JBTM) have exhibited significant bullish trends over the past 12 months, with notable price appreciations and varied recent momentum dynamics.
Trend Analysis
Symbotic Inc. (SYM) showed a bullish trend over the past year with a 64.58% price increase, accompanied by a deceleration in trend momentum and a standard deviation of 15.15. The stock reached a high of 83.77 and a low of 17.5.
JBT Marel Corporation (JBTM) also experienced a bullish trend with a 50.89% price gain and accelerating momentum. The price volatility was higher, with a standard deviation of 19.24, and the stock ranged between 87.85 and 156.04.
Comparing the two, Symbotic Inc. delivered the highest market performance over the past year, despite JBTM showing stronger recent acceleration in price growth.
Target Prices
The target price consensus for Symbotic Inc. and JBT Marel Corporation reveals moderate upside potential based on analyst estimates.
| Company | Target High | Target Low | Consensus |
|---|---|---|---|
| Symbotic Inc. | 83 | 41 | 65.11 |
| JBT Marel Corporation | 180 | 169 | 174.5 |
Analysts expect Symbotic’s price to be slightly below its current level of $70.82, while JBT Marel’s consensus target of $174.5 is notably above its current price of $156.04, indicating stronger potential appreciation for JBTM.
Analyst Opinions Comparison
This section compares analysts’ ratings and grades for Symbotic Inc. and JBT Marel Corporation:
Rating Comparison
SYM Rating
- Rating: C+ indicating a very favorable overall evaluation.
- Discounted Cash Flow Score: 5, rated very favorable for assessing valuation.
- ROE Score: 1, considered very unfavorable for profitability efficiency.
- ROA Score: 1, very unfavorable for asset utilization effectiveness.
- Debt To Equity Score: 3, moderate financial risk indicating balanced leverage.
JBTM Rating
- Rating: C indicating a very favorable overall evaluation.
- Discounted Cash Flow Score: 3, rated moderate in valuation assessment.
- ROE Score: 1, also very unfavorable for profitability efficiency.
- ROA Score: 1, equally very unfavorable for asset utilization effectiveness.
- Debt To Equity Score: 2, moderate financial risk with slightly lower leverage.
Which one is the best rated?
Both companies share the same overall score of 2, reflecting a moderate rating. SYM shows a higher discounted cash flow score, suggesting a more favorable valuation outlook, while JBTM has a slightly better debt-to-equity score. Their profitability and asset utilization scores are equally low.
Scores Comparison
Here is a comparison of the financial scores for Symbotic Inc. and JBT Marel Corporation:
SYM Scores
- Altman Z-Score: 13.05, indicating a safe zone with very low bankruptcy risk.
- Piotroski Score: 3, classified as very weak financial strength.
JBTM Scores
- Altman Z-Score: 1.75, in the distress zone signaling high bankruptcy risk.
- Piotroski Score: 2, also very weak financial strength.
Which company has the best scores?
Symbotic Inc. shows a significantly stronger Altman Z-Score, indicating better financial stability. Both companies have very weak Piotroski Scores, with Symbotic slightly ahead. Overall, Symbotic has the better scores based on this data.
Grades Comparison
The recent grades from reputable firms for Symbotic Inc. and JBT Marel Corporation are as follows:
Symbotic Inc. Grades
The latest grades for Symbotic Inc. from leading financial institutions are summarized below.
| Grading Company | Action | New Grade | Date |
|---|---|---|---|
| Goldman Sachs | Downgrade | Sell | 2025-12-02 |
| Barclays | Maintain | Underweight | 2025-11-26 |
| Baird | Maintain | Neutral | 2025-11-26 |
| Craig-Hallum | Upgrade | Buy | 2025-11-25 |
| Northland Capital Markets | Maintain | Outperform | 2025-11-25 |
| Needham | Maintain | Buy | 2025-11-25 |
| Cantor Fitzgerald | Maintain | Overweight | 2025-11-25 |
| DA Davidson | Maintain | Neutral | 2025-11-25 |
| Citigroup | Maintain | Buy | 2025-11-25 |
| UBS | Downgrade | Sell | 2025-09-23 |
Overall, Symbotic Inc.’s grades show a mixed trend, with multiple buy and outperform ratings but notable recent downgrades to sell from major firms.
JBT Marel Corporation Grades
Key recent grades for JBT Marel Corporation from reputable sources are shown below.
| Grading Company | Action | New Grade | Date |
|---|---|---|---|
| Jefferies | Upgrade | Buy | 2025-12-10 |
| William Blair | Upgrade | Outperform | 2025-08-06 |
JBT Marel Corporation’s grades indicate a positive upgrade trend with no sell or hold ratings reported.
Which company has the best grades?
JBT Marel Corporation has received consistently positive upgrades with no downgrades, indicating a stronger and more unanimous analyst sentiment compared to Symbotic Inc., which shows a wider range of opinions including several sell ratings. This divergence may affect investor confidence and perceived risk differently for each company.
Strengths and Weaknesses
Below is a comparative overview of key strengths and weaknesses for Symbotic Inc. (SYM) and JBT Marel Corporation (JBTM) based on the most recent financial and operational data.
| Criterion | Symbotic Inc. (SYM) | JBT Marel Corporation (JBTM) |
|---|---|---|
| Diversification | Moderate: Revenue mainly from Systems (2.12B in 2025), with smaller segments in Operation Services (105M) and Software Maintenance (30M) | Limited data on product diversification; primarily focused on food processing technologies |
| Profitability | Unfavorable: Negative net margin (-0.75%) and negative ROIC (-16.63%), value destroying | Slightly unfavorable: Positive net margin (4.98%) and ROIC (3.65%) but both below ideal thresholds |
| Innovation | Strong: High fixed asset turnover (15.92) suggests efficient use of assets in innovation-heavy systems | Moderate: Fixed asset turnover good (7.34), indicating decent asset efficiency |
| Global presence | Established, but detailed regional data unavailable | Established global presence in food processing markets |
| Market Share | Growing revenue in Systems segment indicates expanding market share in automation | Market share data limited; steady but slower growth implied |
Key takeaways: Both companies show challenges in profitability with negative or minimal excess returns on capital, signaling caution. Symbotic’s strong asset turnover and Systems revenue growth highlight innovation and market expansion potential, while JBTM exhibits moderate financial health but requires improvement in profitability metrics.
Risk Analysis
Below is a comparative table of key risks for Symbotic Inc. (SYM) and JBT Marel Corporation (JBTM), based on the most recent available data for 2025 and 2024 respectively:
| Metric | Symbotic Inc. (SYM) | JBT Marel Corporation (JBTM) |
|---|---|---|
| Market Risk | High beta 2.14 indicates high volatility | Beta close to 1.00, moderate volatility |
| Debt level | Low debt-to-equity 0.14 (favorable) | Moderate debt-to-equity 0.81 (neutral) |
| Regulatory Risk | Moderate; operates in US industrial tech sector | Moderate; operates globally in food tech with regulatory complexity |
| Operational Risk | High due to negative profitability and ROIC | Moderate; stable operations but lower asset turnover |
| Environmental Risk | Low to moderate; industrial machinery sector with automation | Moderate; food processing technology with some environmental regulations |
| Geopolitical Risk | Low; mainly US-based operations | Moderate; global presence exposes to geopolitical tensions |
In synthesis, Symbotic faces significant market risk due to its high stock volatility and operational challenges shown by negative profitability metrics in 2025. Its low debt reduces financial risk but weak returns and a very weak Piotroski score highlight operational risk. JBT Marel, with moderate market volatility and global exposure, contends with moderate debt and geopolitical risks. Its distressed Altman Z-score signals financial vulnerability. Investors should weigh Symbotic’s growth potential against its operational weaknesses, while JBTM’s global footprint and financial distress warrant cautious monitoring.
Which Stock to Choose?
Symbotic Inc. (SYM) has shown strong revenue growth of 792% over five years but suffers from negative profitability metrics, including a -7.65% ROE and -16.63% ROIC, indicating value destruction. Its debt levels are low and rated very favorably overall despite mixed financial ratios.
JBT Marel Corporation (JBTM) displays moderate revenue decline over five years with positive but modest profitability: a 5.53% ROE and 3.65% ROIC, though both below ideal thresholds. Its debt ratios are moderate, and it holds a slightly unfavorable ratio profile but a very favorable overall rating.
Investors prioritizing growth might find SYM’s strong revenue expansion appealing despite profitability challenges, while those valuing financial stability and moderate returns may view JBTM’s consistent profitability and safer debt profile as more favorable. Both companies face challenges in creating value above their capital costs.
Disclaimer: Investment carries a risk of loss of initial capital. The past performance is not a reliable indicator of future results. Be sure to understand risks before making an investment decision.
Go Further
I encourage you to read the complete analyses of Symbotic Inc. and JBT Marel Corporation to enhance your investment decisions: