Symbotic Inc. and Columbus McKinnon Corporation are two notable players in the industrial machinery sector, each shaping the future of material handling and automation. Symbotic excels in robotics-driven warehouse automation, while Columbus McKinnon offers a broad range of intelligent motion and lifting solutions. Their overlapping focus on improving operational efficiency makes this comparison relevant. Join me as we explore which company presents the best investment opportunity in today’s evolving industrial landscape.
Table of contents
Companies Overview
I will begin the comparison between Symbotic Inc. and Columbus McKinnon Corporation by providing an overview of these two companies and their main differences.
Symbotic Inc. Overview
Symbotic Inc. is an automation technology company focused on robotics and technology to enhance efficiency for retailers and wholesalers in the US. Its flagship offering, The Symbotic System, is a comprehensive warehouse automation solution that lowers costs, boosts efficiency, and optimizes inventory management. The company is headquartered in Wilmington, Massachusetts, and operates in the industrial machinery sector.
Columbus McKinnon Corporation Overview
Columbus McKinnon Corporation designs and manufactures intelligent motion solutions for material handling worldwide. Its extensive product range includes hoists, crane systems, rigging equipment, and power and motion technology products. Serving diverse industries from construction to e-commerce, the company distributes products directly and via various partners. Founded in 1875, it is based in Buffalo, New York, operating within the agricultural machinery industry.
Key similarities and differences
Both companies operate in the industrial sector with a focus on machinery and equipment solutions. Symbotic emphasizes automation technology specifically for warehouse efficiency, while Columbus McKinnon offers a broader array of material handling and motion control products across multiple industries. Symbotic’s business centers on robotics and software integration, contrasting with Columbus McKinnon’s mechanical and electromechanical hardware focus.
Income Statement Comparison
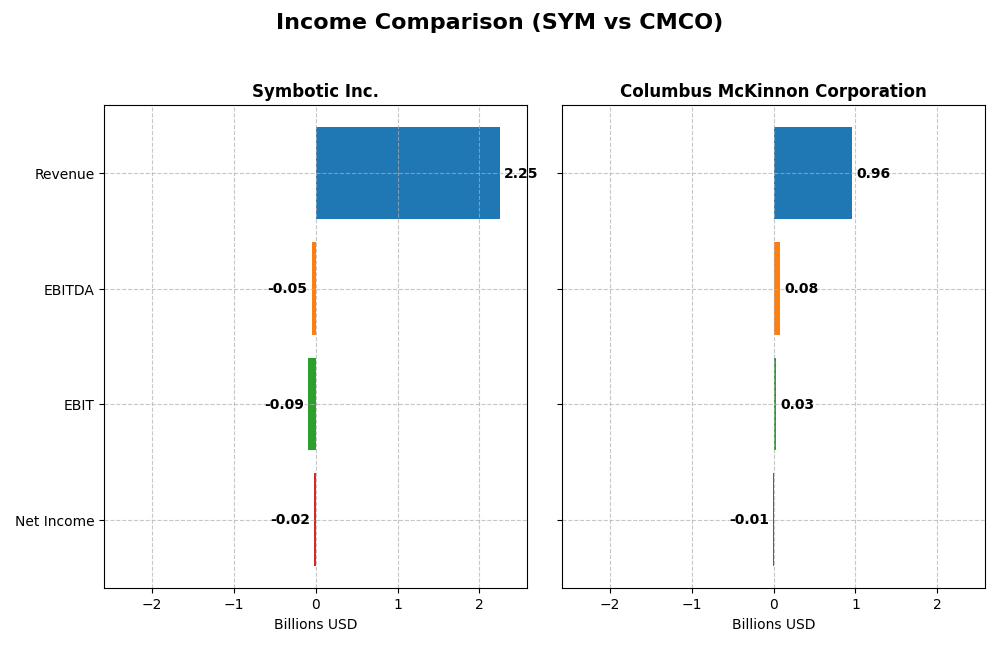
The table below compares the key income statement metrics for Symbotic Inc. and Columbus McKinnon Corporation for their most recent fiscal years.
| Metric | Symbotic Inc. (SYM) | Columbus McKinnon Corp. (CMCO) |
|---|---|---|
| Market Cap | 39.2B | 494M |
| Revenue | 2.25B | 963M |
| EBITDA | -48.0M | 75.1M |
| EBIT | -92.1M | 26.9M |
| Net Income | -16.9M | -5.14M |
| EPS | -0.16 | -0.18 |
| Fiscal Year | 2025 | 2024 |
Income Statement Interpretations
Symbotic Inc.
Symbotic Inc. has shown strong revenue growth from $252M in 2021 to $2.25B in 2025, indicating rapid expansion. However, margins remain pressured with a gross margin around 18.8% and negative EBIT and net income margins, reflecting ongoing operational challenges. The latest year saw a 25.7% revenue increase but a slight EBIT decline, signaling growth with margin struggles.
Columbus McKinnon Corporation
Columbus McKinnon’s revenues grew steadily from $650M in 2020 to $1.01B in 2023 before slipping to $963M in 2024. Gross margins are healthy at 33.8%, but EBIT margin fell to 2.8% and net margin turned negative recently, driven by increased expenses and interest costs. The latest year shows declining profitability despite relatively stable revenues.
Which one has the stronger fundamentals?
Symbotic presents favorable long-term revenue and net income growth with improving net margin trends, despite current negative profitability and margin pressures. Columbus McKinnon shows stable gross margins but faces unfavorable earnings and net margin trends, including recent profitability deterioration. Overall, Symbotic’s growth and margin improvements contrast with Columbus McKinnon’s recent operational and profitability challenges.
Financial Ratios Comparison
The table below compares the most recent financial ratios for Symbotic Inc. and Columbus McKinnon Corporation, reflecting their fiscal year 2025 and 2024 data respectively.
| Ratios | Symbotic Inc. (SYM) FY 2025 | Columbus McKinnon Corporation (CMCO) FY 2024 |
|---|---|---|
| ROE | -7.65% | -0.58% |
| ROIC | -16.63% | 3.30% |
| P/E | -335 | -94.69 |
| P/B | 25.6 | 0.55 |
| Current Ratio | 1.08 | 1.81 |
| Quick Ratio | 0.99 | 1.04 |
| D/E (Debt-to-Equity) | 0.14 | 0.61 |
| Debt-to-Assets | 1.32% | 31.09% |
| Interest Coverage | 0 | 1.68 |
| Asset Turnover | 0.94 | 0.55 |
| Fixed Asset Turnover | 15.92 | 9.07 |
| Payout Ratio | 0 | -156.5% |
| Dividend Yield | 0% | 1.65% |
Interpretation of the Ratios
Symbotic Inc.
Symbotic Inc. shows several unfavorable ratios including negative net margin (-0.75%) and return on equity (-7.65%), signaling operational and profitability challenges. The company’s low current and quick ratios (around 1.08 and 0.99) suggest average liquidity, while its debt levels are favorably low. Symbotic does not pay dividends, likely reflecting its reinvestment strategy amid losses and a growth phase.
Columbus McKinnon Corporation
Columbus McKinnon’s ratios present a mixed picture with a slightly favorable global evaluation. Despite a negative net margin (-0.53%) and return on equity (-0.58%), liquidity ratios are strong (current ratio 1.81, quick ratio 1.04), and its debt metrics are moderate. The firm pays a dividend with a 1.65% yield, indicating some shareholder returns despite profitability pressures.
Which one has the best ratios?
Columbus McKinnon exhibits a more balanced ratio profile with a higher proportion of favorable metrics and stronger liquidity, while Symbotic’s ratios reflect more significant operational weaknesses and a growth-focused strategy without dividends. Overall, Columbus McKinnon’s slightly favorable global ratio stance contrasts with Symbotic’s slightly unfavorable evaluation.
Strategic Positioning
This section compares the strategic positioning of Symbotic Inc. (SYM) and Columbus McKinnon Corporation (CMCO), focusing on market position, key segments, and exposure to technological disruption:
Symbotic Inc. (SYM)
- Leading in warehouse automation technology with high market cap and elevated beta, facing competitive industrial machinery pressures.
- Focused on automation systems, operation services, and software maintenance mainly for retailers and wholesalers in the U.S.
- Positioned in automation technology with potential disruption from robotics and software integration in supply chain operations.
Columbus McKinnon Corporation (CMCO)
- Smaller market cap, diversified industrial machinery presence with moderate competitive pressure and lower beta.
- Broad product portfolio including hoists, conveyors, cranes, actuators across multiple verticals globally.
- Exposed to traditional industrial machinery with incremental innovation; digital power control is part of product mix.
Symbotic Inc. (SYM) vs Columbus McKinnon Corporation (CMCO) Positioning
SYM adopts a concentrated strategy centered on warehouse automation and robotics, offering specialized systems and software. CMCO follows a diversified approach with a wide range of material handling and motion control products, serving multiple industries and geographies, which may dilute focus but spreads risk.
Which has the best competitive advantage?
Both companies are currently shedding value, with SYM showing very unfavorable and declining profitability, while CMCO has slightly unfavorable but improving ROIC trends. CMCO’s growing profitability suggests a more resilient competitive advantage based on recent MOAT evaluation.
Stock Comparison
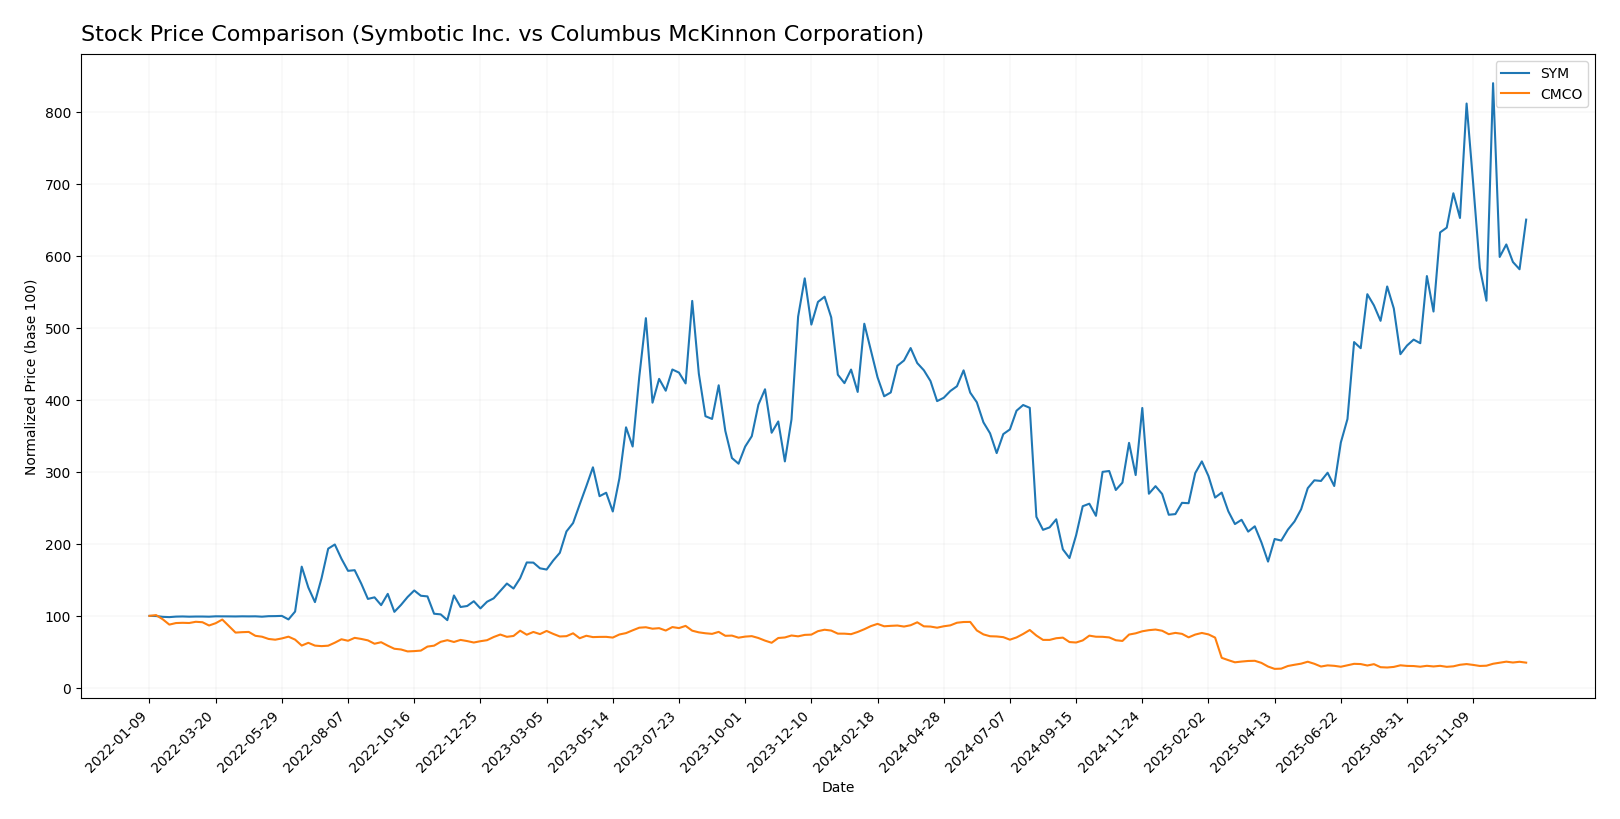
The stock price movements of Symbotic Inc. (SYM) and Columbus McKinnon Corporation (CMCO) over the past 12 months reveal contrasting dynamics, with SYM showing a strong overall gain despite recent weakness, and CMCO experiencing a steep decline followed by a modest recovery.
Trend Analysis
Symbotic Inc. (SYM) exhibited a 38.88% price increase over the past year, indicating a bullish trend with deceleration in momentum. The stock fluctuated between a high of 83.77 and a low of 17.5, showing moderate volatility with a standard deviation of 14.82.
Columbus McKinnon Corporation (CMCO) showed a 59.11% decline over the same period, marking a bearish trend with accelerating downward momentum. The price range was 12.96 to 44.9, with a volatility level of 11.28.
Comparing the two, SYM delivered the highest market performance with a significant positive return, while CMCO lagged due to its sustained bearish trend despite recent slight gains.
Target Prices
The current analyst consensus for target prices reflects moderate optimism for both Symbotic Inc. and Columbus McKinnon Corporation.
| Company | Target High | Target Low | Consensus |
|---|---|---|---|
| Symbotic Inc. | 83 | 41 | 65.11 |
| Columbus McKinnon Corporation | 50 | 48 | 49 |
Analysts expect Symbotic Inc.’s price to rise slightly above the current $64.87, while Columbus McKinnon’s consensus target of $49 substantially exceeds its current $17.20, indicating stronger upside potential for CMCO.
Analyst Opinions Comparison
This section compares analysts’ ratings and financial scores for Symbotic Inc. and Columbus McKinnon Corporation:
Rating Comparison
SYM Rating
- Rating: C+ with a Very Favorable status
- Discounted Cash Flow Score: 5, Very Favorable, indicating strong future cash flow projections
- ROE Score: 1, Very Unfavorable, showing low efficiency in generating profit from equity
- ROA Score: 1, Very Unfavorable, indicating poor asset utilization
- Debt To Equity Score: 3, Moderate, suggesting moderate financial risk
- Overall Score: 2, Moderate
CMCO Rating
- Rating: B with a Very Favorable status
- Discounted Cash Flow Score: 5, Very Favorable, indicating strong future cash flow projections
- ROE Score: 1, Very Unfavorable, showing low efficiency in generating profit from equity
- ROA Score: 2, Moderate, indicating better asset utilization than SYM
- Debt To Equity Score: 2, Moderate, indicating somewhat better financial stability
- Overall Score: 3, Moderate
Which one is the best rated?
Based strictly on the provided data, CMCO holds a better overall rating (B vs. C+) and a higher overall score (3 vs. 2). CMCO also has a better ROA and debt-to-equity score, indicating a slightly stronger financial position compared to SYM.
Scores Comparison
The scores comparison between Symbotic Inc. and Columbus McKinnon Corporation highlights their financial health indicators:
SYM Scores
- Altman Z-Score: 11.20, indicating a safe zone with low bankruptcy risk.
- Piotroski Score: 3, classified as very weak financial strength.
CMCO Scores
- Altman Z-Score: 1.40, indicating distress zone with high bankruptcy risk.
- Piotroski Score: 8, classified as very strong financial strength.
Which company has the best scores?
Based strictly on the provided data, Symbotic Inc. has a much stronger Altman Z-Score, signaling better bankruptcy safety. Columbus McKinnon shows higher Piotroski strength but faces financial distress risk.
Grades Comparison
Here is a comparison of recent grades issued by recognized grading companies for both companies:
Symbotic Inc. Grades
The table below shows recent grades from reputable firms for Symbotic Inc.:
| Grading Company | Action | New Grade | Date |
|---|---|---|---|
| Goldman Sachs | Sell | Sell | 2025-12-02 |
| Barclays | Maintain | Underweight | 2025-11-26 |
| Baird | Maintain | Neutral | 2025-11-26 |
| Craig-Hallum | Upgrade | Buy | 2025-11-25 |
| Northland Capital Markets | Maintain | Outperform | 2025-11-25 |
| Needham | Maintain | Buy | 2025-11-25 |
| Cantor Fitzgerald | Maintain | Overweight | 2025-11-25 |
| DA Davidson | Maintain | Neutral | 2025-11-25 |
| Citigroup | Maintain | Buy | 2025-11-25 |
| UBS | Downgrade | Sell | 2025-09-23 |
Overall, Symbotic Inc. displays a mixed rating trend with several buy and outperform grades balanced by notable recent downgrades to sell by Goldman Sachs and UBS.
Columbus McKinnon Corporation Grades
The table below summarizes recent grades from established firms for Columbus McKinnon Corporation:
| Grading Company | Action | New Grade | Date |
|---|---|---|---|
| DA Davidson | Downgrade | Neutral | 2025-02-11 |
| DA Davidson | Maintain | Buy | 2024-02-05 |
| DA Davidson | Maintain | Buy | 2022-10-04 |
| DA Davidson | Maintain | Buy | 2022-10-03 |
| Barrington Research | Maintain | Outperform | 2022-07-29 |
| Barrington Research | Maintain | Outperform | 2022-07-28 |
| JP Morgan | Downgrade | Neutral | 2022-05-26 |
| Barrington Research | Maintain | Outperform | 2022-05-26 |
| Barrington Research | Maintain | Outperform | 2022-05-25 |
| JP Morgan | Downgrade | Neutral | 2022-05-25 |
Columbus McKinnon exhibits a generally positive rating history with multiple buy and outperform grades, though some earlier downgrades to neutral are present.
Which company has the best grades?
Symbotic Inc. has a broader spread of recent grades, including several upgrades to buy and outperform but also some recent sell downgrades. Columbus McKinnon Corporation’s grades tend to cluster around buy and outperform but include some neutral downgrades. Investors may view Symbotic’s mixed signals as higher short-term uncertainty, while Columbus McKinnon’s more stable buy and outperform ratings suggest steadier sentiment.
Strengths and Weaknesses
Below is a comparative overview of key strengths and weaknesses for Symbotic Inc. (SYM) and Columbus McKinnon Corporation (CMCO) based on the most recent financial and market data.
| Criterion | Symbotic Inc. (SYM) | Columbus McKinnon Corporation (CMCO) |
|---|---|---|
| Diversification | Focused product segmentation: mainly Systems (2.12B in 2025), with smaller shares in Operation Services and Software Maintenance. | Broad product range: Hoists (480M), High Precision Conveyors (155M), Digital Power Control (110M), and others. |
| Profitability | Negative net margin (-0.75%), ROIC -16.63%, shedding value with declining profitability. | Negative net margin (-0.53%), positive ROIC (3.3%) with improving profitability trend, but still slightly unfavorable. |
| Innovation | Heavy focus on Systems and software support suggests tech-driven solutions, but financials indicate challenges in value creation. | Diverse industrial product innovations, steady growth in segment revenues, improving ROIC trends reflect moderate innovation success. |
| Global presence | Primarily operates in automation and robotics systems with scalable software services; limited data on global footprint. | Established in various industrial equipment markets with a wide product portfolio likely supporting broader global reach. |
| Market Share | Strong in automation and system integration within its niche but facing profitability issues. | Holds significant share in hoists and conveyor markets, with consistent revenue streams and improving operational efficiency. |
Key takeaway: Symbotic Inc. shows strong specialization in automation systems but struggles with profitability and value creation, posing higher risk. Columbus McKinnon offers broader diversification with improving profitability trends and a more stable financial footing, making it a less risky option for cautious investors.
Risk Analysis
Below is a comparison of key risks for Symbotic Inc. (SYM) and Columbus McKinnon Corporation (CMCO) based on the most recent data available.
| Metric | Symbotic Inc. (SYM) | Columbus McKinnon Corporation (CMCO) |
|---|---|---|
| Market Risk | High beta (2.11) indicates higher volatility; tech-driven industrial sector exposure | Moderate beta (1.29); diversified industrial machinery sector exposure |
| Debt Level | Low debt-to-equity (0.14) – favorable, low financial leverage | Moderate debt-to-equity (0.61) – neutral financial leverage |
| Regulatory Risk | Moderate – operates in US automation, subject to tech and labor regulations | Moderate – industrial machinery with international market exposure |
| Operational Risk | Medium – relies heavily on robotics innovation and system integration | Medium – complex manufacturing and global supply chain risks |
| Environmental Risk | Moderate – tech industry with moderate environmental footprint | Moderate to high – manufacturing processes with potential environmental impact |
| Geopolitical Risk | Low – primarily US-focused operations | Moderate – global supply chain exposure increases geopolitical sensitivity |
Symbotic’s most impactful risks stem from its high market volatility and operational dependency on advanced robotics innovation, while maintaining a strong balance sheet with low debt. Columbus McKinnon faces higher financial leverage and geopolitical risks due to its global reach, but benefits from a stronger Piotroski score signaling operational strength. Investors should weigh Symbotic’s growth potential against its financial and operational challenges, and consider Columbus McKinnon’s moderate risk profile with caution regarding its financial distress indicated by the Altman Z-Score.
Which Stock to Choose?
Symbotic Inc. (SYM) shows strong revenue growth of 25.65% in 2025 with favorable income statement evaluations despite negative profitability ratios including ROE at -7.65% and ROIC at -16.63%. Its debt levels are low, and the overall rating is very favorable (C+). However, the company’s MOAT is very unfavorable due to value destruction and declining profitability.
Columbus McKinnon Corporation (CMCO) has a less favorable recent income evolution with a 4.98% revenue decline in 2024 and mostly unfavorable income growth metrics. Financial ratios are slightly more favorable with ROIC at 3.3% but still below WACC, moderate debt, and a very favorable rating (B). The MOAT is slightly unfavorable, indicating value destruction but improving profitability.
For investors prioritizing growth potential, SYM’s strong revenue expansion and favorable income statement might appear more attractive despite its profitability challenges. Conversely, those focused on improving stability and moderate profitability could find CMCO’s improving ROIC trend and stronger rating more appealing. Ultimately, the choice might depend on the investor’s tolerance for risk and preference for growth versus gradual recovery.
Disclaimer: Investment carries a risk of loss of initial capital. The past performance is not a reliable indicator of future results. Be sure to understand risks before making an investment decision.
Go Further
I encourage you to read the complete analyses of Symbotic Inc. and Columbus McKinnon Corporation to enhance your investment decisions: