Home > Comparison > Technology > WDC vs SMCI
The strategic rivalry between Western Digital Corporation and Super Micro Computer, Inc. defines the trajectory of the computer hardware sector. Western Digital operates as a capital-intensive data storage giant, while Super Micro focuses on high-performance, modular server and storage solutions. This head-to-head contrasts scale and specialization in technology infrastructure. This analysis aims to identify which company offers a superior risk-adjusted profile for a diversified portfolio navigating evolving hardware demands.
Table of contents
Companies Overview
Western Digital and Super Micro Computer command critical roles in the global computer hardware sector, shaping data storage and server performance.
Western Digital Corporation: Data Storage Powerhouse
Western Digital leads as a top-tier data storage provider, generating revenue through hard disk drives, solid-state drives, and embedded flash products. Its 2026 strategy centers on expanding enterprise data center solutions and enhancing flash-based SSD technology. The company’s broad portfolio targets PCs, gaming, IoT, and automotive markets with strong brand recognition under G-Technology, SanDisk, and WD.
Super Micro Computer, Inc.: Modular Server Innovator
Super Micro Computer specializes in high-performance server and storage solutions built on modular, open architecture. It drives revenue from servers, blade systems, and management software tailored for enterprise data centers, cloud computing, AI, and edge markets. The company’s 2026 focus sharpens on integrated server configurations and comprehensive customer support services, leveraging agility and customization.
Strategic Collision: Similarities & Divergences
Both firms thrive in the computer hardware industry but diverge in philosophy: Western Digital emphasizes proprietary storage technologies, while Super Micro champions open, modular server architectures. They battle primarily in enterprise data solutions, with Western Digital dominating storage media and Super Micro excelling in server integration. Their investment profiles differ sharply—Western Digital offers scale and brand power; Super Micro delivers niche agility and innovation.
Income Statement Comparison
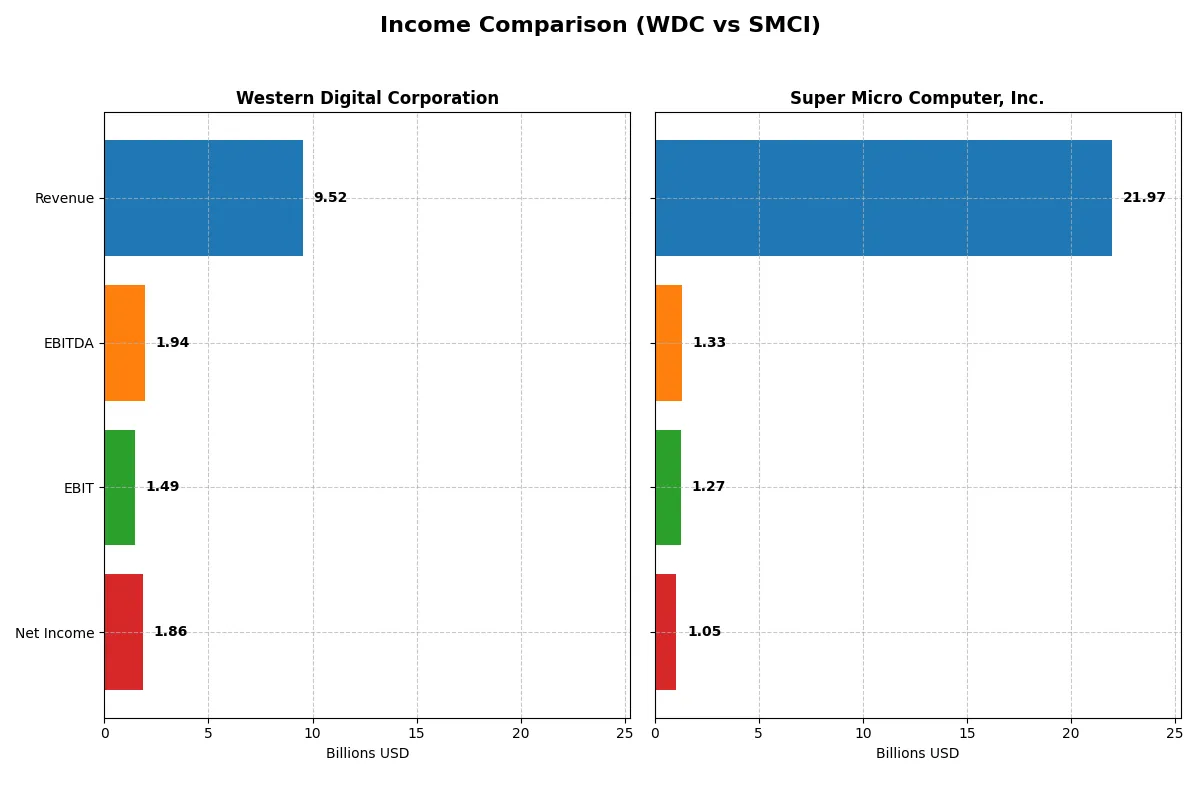
This data dissects the core profitability and scalability of both corporate engines to reveal who dominates the bottom line:
| Metric | Western Digital Corporation (WDC) | Super Micro Computer, Inc. (SMCI) |
|---|---|---|
| Revenue | 9.52B | 21.97B |
| Cost of Revenue | 5.83B | 19.54B |
| Operating Expenses | 1.36B | 1.18B |
| Gross Profit | 3.69B | 2.43B |
| EBITDA | 1.94B | 1.33B |
| EBIT | 1.49B | 1.27B |
| Interest Expense | 357M | 60M |
| Net Income | 1.86B | 1.05B |
| EPS | 5.31 | 1.77 |
| Fiscal Year | 2025 | 2025 |
Income Statement Analysis: The Bottom-Line Duel
This income statement comparison reveals which company drives superior operational efficiency and profitability in the current market environment.
Western Digital Corporation Analysis
Western Digital’s revenue surged 51% year-over-year to $9.5B in 2025, rebounding sharply from prior declines. Its gross margin improved to a robust 38.8%, and net margin climbed to 19.6%, signaling strong cost control. The $1.86B net income marks a powerful recovery, reflecting efficient expense management and favorable leverage on sales growth.
Super Micro Computer, Inc. Analysis
Super Micro’s revenue expanded 47% to $21.97B in 2025, continuing a strong growth trajectory over five years. However, its gross margin remained modest at 11.1%, with a net margin of just 4.8%, highlighting tight profitability despite scale. Net income of $1.05B reflects steady operational execution but slower margin improvement compared to peers.
Margin Strength vs. Revenue Expansion
Western Digital leads on profitability, boasting higher gross and net margins with a dramatic turnaround from losses. Super Micro excels in revenue growth and scale but posts weaker margins. For investors prioritizing bottom-line efficiency over top-line size, Western Digital’s sharply improved margins and net income present a more compelling profile.
Financial Ratios Comparison
These vital ratios act as a diagnostic tool to expose the underlying fiscal health, valuation premiums, and capital efficiency of the companies compared below:
| Ratios | Western Digital Corporation (WDC) | Super Micro Computer, Inc. (SMCI) |
|---|---|---|
| ROE | 35.0% | 16.6% |
| ROIC | 21.5% | 9.3% |
| P/E | 11.8x | 27.7x |
| P/B | 4.14x | 4.62x |
| Current Ratio | 1.08 | 5.25 |
| Quick Ratio | 0.84 | 3.25 |
| D/E | 0.96 | 0.76 |
| Debt-to-Assets | 36.3% | 34.1% |
| Interest Coverage | 6.54x | 21.0x |
| Asset Turnover | 0.68 | 1.57 |
| Fixed Asset Turnover | 4.06 | 27.53 |
| Payout ratio | 2.4% | 0% |
| Dividend yield | 0.20% | 0% |
| Fiscal Year | 2025 | 2025 |
Efficiency & Valuation Duel: The Vital Signs
Financial ratios act as a company’s DNA, uncovering hidden operational strengths and potential risks through key profitability and valuation metrics.
Western Digital Corporation
Western Digital commands a robust 35% ROE and a strong 19.55% net margin, signaling operational efficiency. Its P/E ratio of 11.8 reflects an attractively priced stock, though a high P/B of 4.14 marks some valuation tension. Dividend yield remains minimal at 0.2%, indicating modest shareholder returns with reinvestment focused on R&D and growth.
Super Micro Computer, Inc.
Super Micro posts a decent 16.6% ROE but a slim 4.77% net margin, showing profitability challenges. The stock trades at a stretched P/E of 27.7 and elevated P/B of 4.62, suggesting premium valuation. The company pays no dividend, channeling cash flow into growth and operational enhancements, supported by strong asset turnover and interest coverage.
Premium Valuation vs. Operational Safety
Western Digital offers superior profitability and a fair valuation, balancing risk and reward better than Super Micro’s expensive, lower-margin profile. Investors seeking operational safety and value may prefer Western Digital, while those chasing growth at a premium might consider Super Micro.
Which one offers the Superior Shareholder Reward?
I compare Western Digital Corporation (WDC) and Super Micro Computer, Inc. (SMCI) through their shareholder reward strategies. WDC pays a modest 0.2% dividend yield with a conservative 2.4% payout ratio, fully covered by free cash flow at 76%. WDC also maintains moderate buybacks, signaling a balanced capital return. SMCI pays no dividends but aggressively reinvests in growth, with a strong free cash flow yield and a robust buyback program fueling shareholder returns. Historically in tech hardware, sustainable buybacks combined with disciplined dividend policies often yield superior long-term value. I judge SMCI’s reinvestment and buyback intensity more sustainable and growth-oriented. Thus, I find SMCI offers a more attractive total return profile for 2026 investors.
Comparative Score Analysis: The Strategic Profile
The radar chart reveals the fundamental DNA and trade-offs of Western Digital Corporation and Super Micro Computer, Inc.:
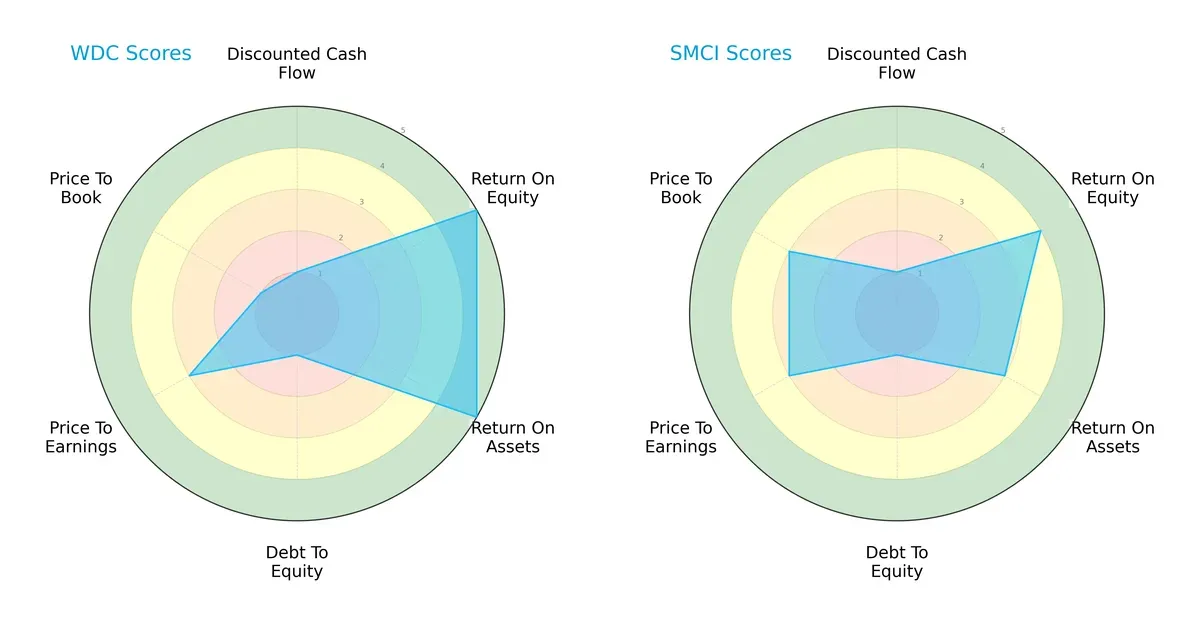
Western Digital dominates in profitability metrics with top ROE and ROA scores of 5 each, signaling efficient capital use. Super Micro Computer posts moderate ROE (4) and ROA (3), indicating less operational leverage. Both firms share very unfavorable debt-to-equity scores (1), highlighting elevated leverage risks. Valuation metrics favor Super Micro Computer slightly in price-to-book (3 vs. 1), while Western Digital edges in price-to-earnings parity. Overall, Western Digital presents a more balanced profile anchored in operational strength, whereas Super Micro Computer relies chiefly on moderate valuation multiples.
Bankruptcy Risk: Solvency Showdown
Western Digital’s Altman Z-Score of 8.96 places it firmly in the safe zone, while Super Micro Computer’s 2.33 lingers in the grey zone, indicating elevated bankruptcy risk in volatile markets:
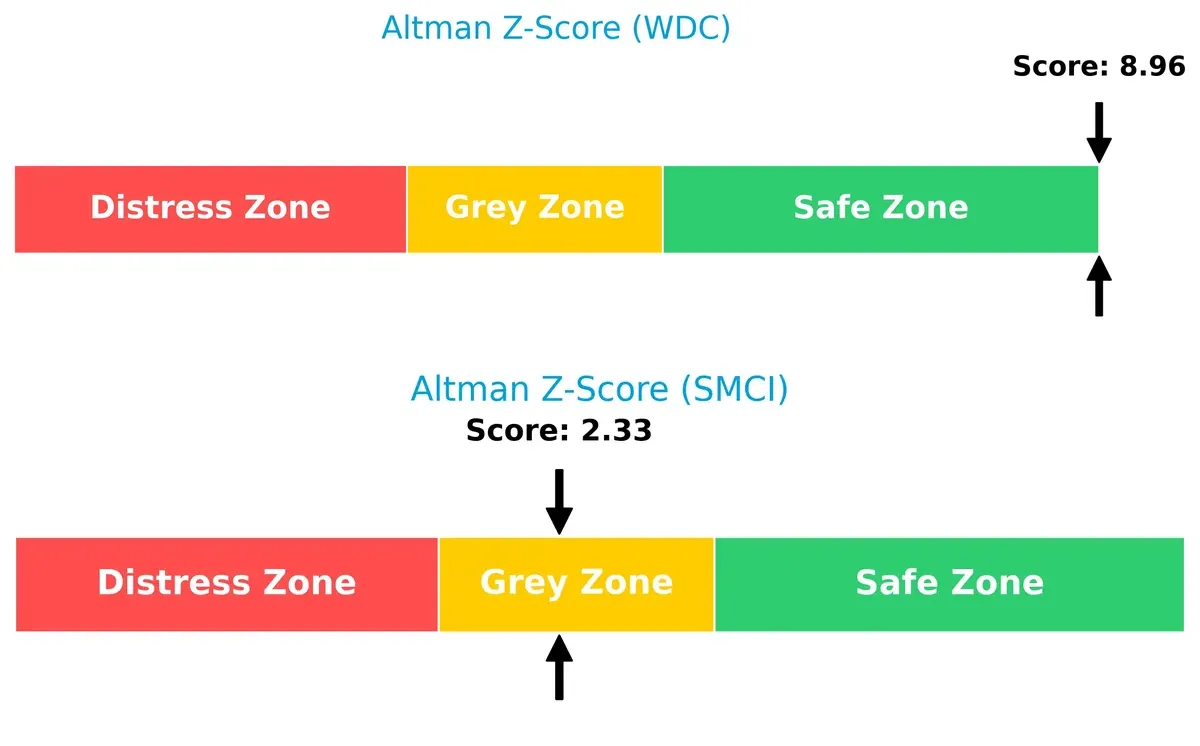
Western Digital’s strong solvency profile supports resilience through economic cycles. Super Micro Computer’s score warns investors of financial fragility, urging caution amid tightening credit conditions.
Financial Health: Quality of Operations
Western Digital’s Piotroski F-Score of 7 reflects robust internal financial health, surpassing Super Micro Computer’s weak score of 3, which signals potential red flags in operational quality:
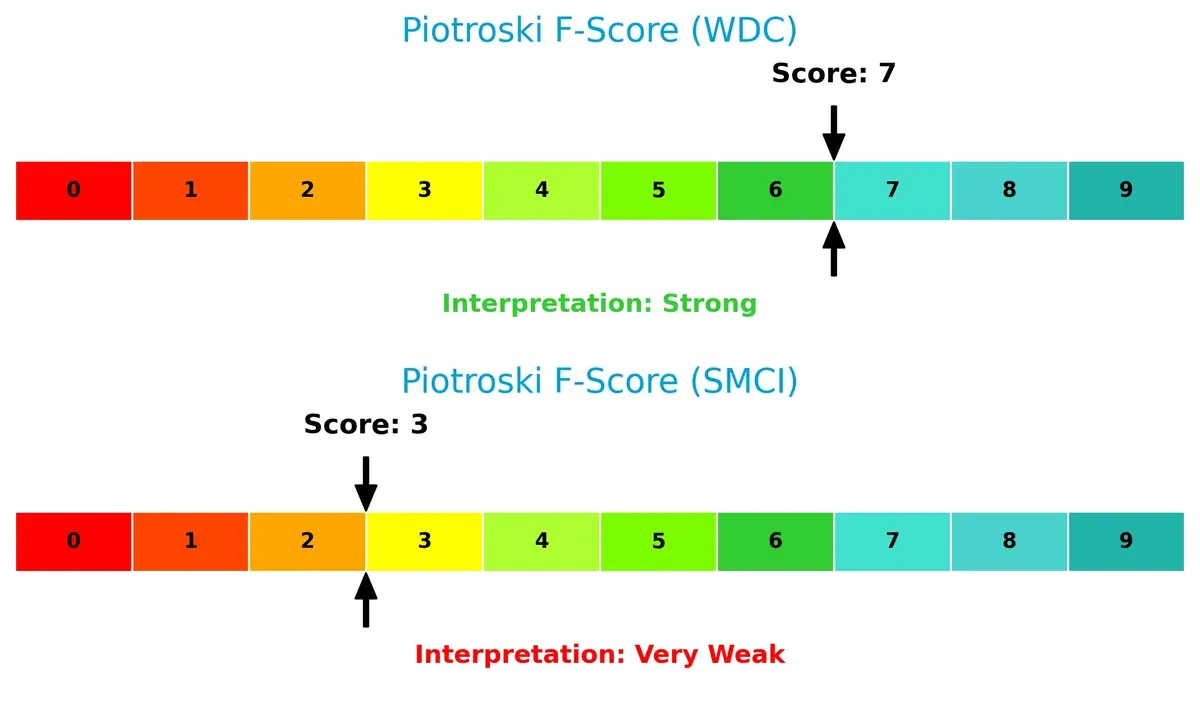
Western Digital demonstrates strong fundamentals across profitability, leverage, and liquidity metrics. Super Micro Computer’s low Piotroski score suggests vulnerabilities that could undermine long-term value creation. Investors should weigh these disparities carefully.
How are the two companies positioned?
This section dissects the operational DNA of WDC and SMCI by comparing their revenue distribution by segment, alongside their internal strengths and weaknesses. The final objective confronts their economic moats to identify which business model delivers the most resilient, sustainable competitive advantage today.
Revenue Segmentation: The Strategic Mix
This comparison dissects how Western Digital Corporation and Super Micro Computer, Inc. diversify their income streams and where they place their primary sector bets:
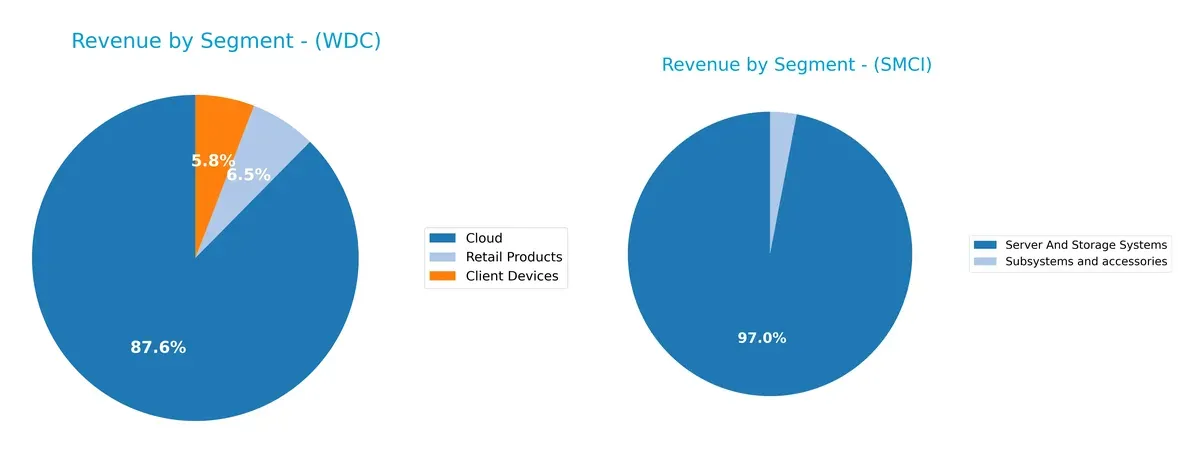
Western Digital’s 2025 revenue leans heavily on Cloud at $8.34B, dwarfing Client Devices at $556M and Retail Products at $623M. This signals a strategic pivot towards infrastructure dominance. Conversely, Super Micro Computer anchors $21.3B in Server And Storage Systems, with a modest $660M from Subsystems, reflecting a concentrated portfolio. WDC’s diversification mitigates risk, while SMCI’s reliance on one segment elevates exposure but leverages ecosystem lock-in.
Strengths and Weaknesses Comparison
This table compares the Strengths and Weaknesses of Western Digital Corporation and Super Micro Computer, Inc.:
Western Digital Corporation Strengths
- Diversified revenue streams including Cloud, Client Devices, and Retail Products
- Favorable profitability with 19.55% net margin and 35.04% ROE
- Strong fixed asset turnover at 4.06
- Balanced debt-to-assets ratio at 36.29%
- Global presence with substantial revenues across Asia, Americas, and EMEA
Super Micro Computer, Inc. Strengths
- High asset turnover at 1.57 and exceptional fixed asset turnover at 27.53
- Strong interest coverage ratio of 21.34 indicates robust ability to service debt
- Favorable ROE at 16.64%
- Quick ratio of 3.25 reflects strong short-term liquidity
- Large U.S. market presence with $13B revenue segment
Western Digital Corporation Weaknesses
- Unfavorable weighted average cost of capital (12.21%) above ROIC
- Unfavorable price-to-book ratio at 4.14
- Neutral current and quick ratios indicate moderate liquidity
- Low dividend yield at 0.2%
- Declining revenue in some segments like Client Devices and Retail Products
Super Micro Computer, Inc. Weaknesses
- Low net margin of 4.77% signals weak profitability
- Unfavorable high price-to-earnings ratio of 27.74
- Unfavorable current ratio at 5.25 may indicate inefficient asset use
- No dividend yield
- Smaller revenue diversification, heavily reliant on Server and Storage Systems
Both companies demonstrate strengths in asset efficiency and global reach but face challenges in profitability and valuation metrics. Western Digital shows better profitability metrics, while Super Micro excels in liquidity and asset turnover. Each must address specific financial and market risks to sustain competitive advantage.
The Moat Duel: Analyzing Competitive Defensibility
A structural moat alone shields long-term profits from relentless competition erosion. Let’s dissect the unique competitive advantages of Western Digital and Super Micro Computer:
Western Digital Corporation: Durable Cost Advantage
Western Digital’s moat stems from its scale and manufacturing efficiency, reflected in a robust 38.8% gross margin and rising ROIC over 2021-2025. Its deep footprint in storage tech secures margin stability. Expansion into enterprise SSDs in 2026 could strengthen this cost edge further.
Super Micro Computer, Inc.: Agile Modular Innovation
Super Micro’s moat lies in its modular, open architecture, enabling flexibility unlike Western Digital’s scale focus. Its thinner margins (11.1%) show less pricing power but growing ROIC signals improving capital efficiency. Continued AI and edge computing adoption in 2026 may unlock new growth avenues.
Scale Dominance vs. Modular Flexibility: Who Holds the Deeper Moat?
Western Digital’s wide cost advantage and high returns on capital give it a deeper, more sustainable moat than Super Micro’s evolving but still fragile competitive position. Western Digital is better equipped to defend market share amid intensifying competition.
Which stock offers better returns?
The past year reveals sharp contrasts: Western Digital surges with accelerating gains, while Super Micro Computer endures a steep decline despite recent mild recovery.
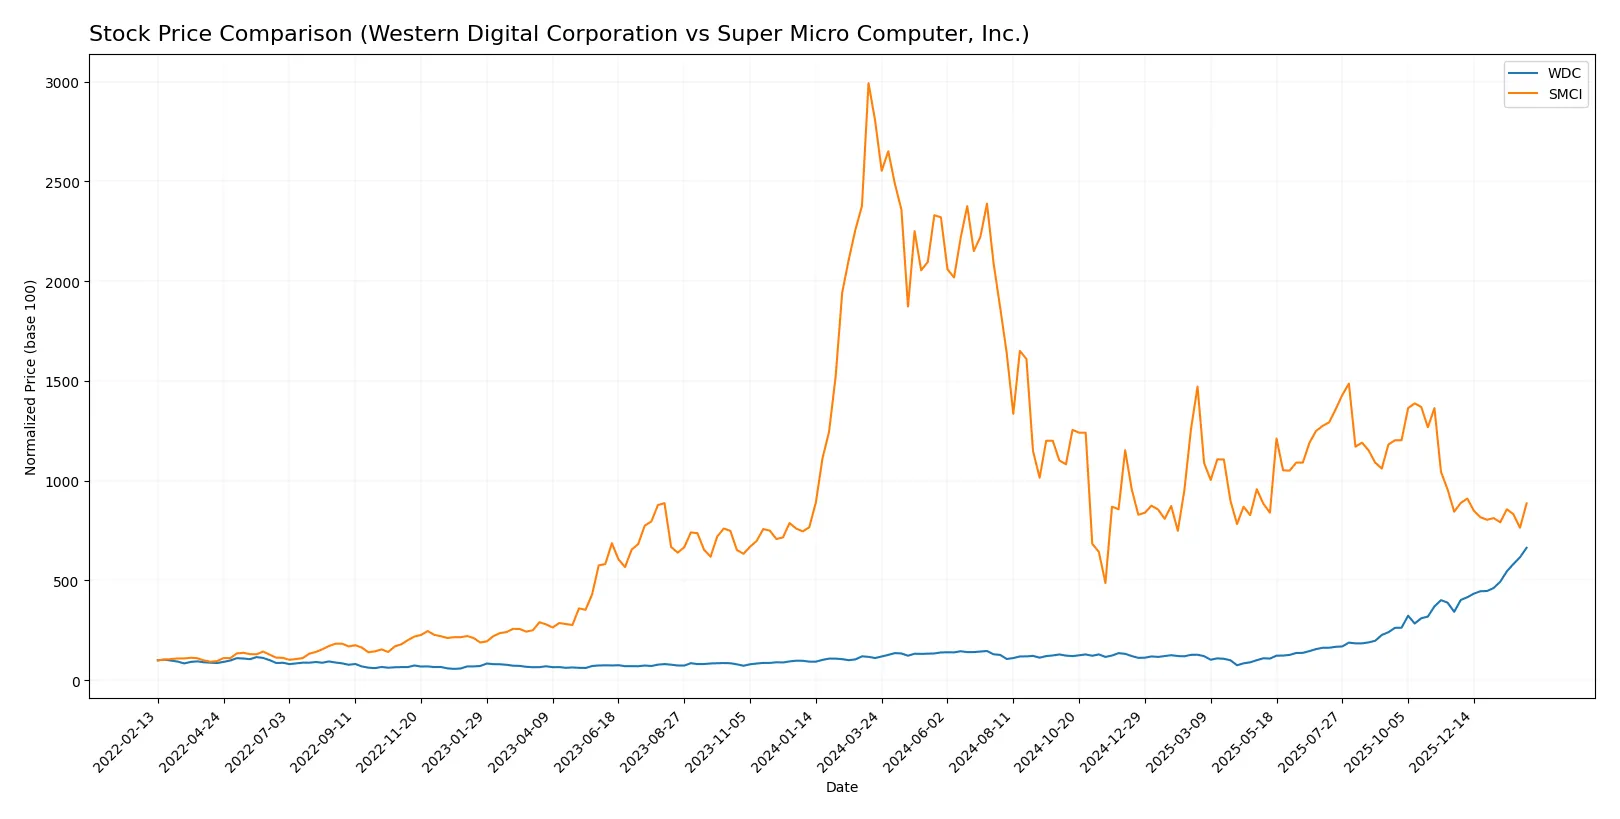
Trend Comparison
Western Digital’s stock rose 496.3% over the past 12 months, showing a bullish trend with accelerating momentum and high volatility, peaking at 269.41 and bottoming at 30.54. Super Micro Computer’s shares fell 68.41% over the same period, reflecting a bearish trend with accelerating decline; the stock ranged between 18.58 and 106.88. Western Digital clearly outperformed Super Micro Computer, delivering the highest market returns with strong buyer dominance and increasing volume trends.
Target Prices
Analysts present a cautiously optimistic target consensus for Western Digital Corporation and Super Micro Computer, Inc.
| Company | Target Low | Target High | Consensus |
|---|---|---|---|
| Western Digital Corporation | 205 | 340 | 285.92 |
| Super Micro Computer, Inc. | 26 | 64 | 47.13 |
Western Digital’s target consensus of 285.92 sits modestly above its current price of 269.41, suggesting moderate upside potential. Super Micro’s consensus at 47.13 implies significant growth from its current 33.76, reflecting stronger analyst confidence.

Don’t Let Luck Decide Your Entry Point
Optimize your entry points with our advanced ProRealTime indicators. You’ll get efficient buy signals with precise price targets for maximum performance. Start outperforming now!
How do institutions grade them?
Western Digital Corporation Grades
Here are the most recent official grades for Western Digital Corporation from top institutions:
| Grading Company | Action | New Grade | Date |
|---|---|---|---|
| Citigroup | Maintain | Buy | 2026-02-02 |
| Barclays | Maintain | Overweight | 2026-02-02 |
| Cantor Fitzgerald | Maintain | Overweight | 2026-01-30 |
| Wells Fargo | Maintain | Overweight | 2026-01-30 |
| Goldman Sachs | Maintain | Neutral | 2026-01-30 |
| Morgan Stanley | Maintain | Overweight | 2026-01-30 |
| TD Cowen | Maintain | Buy | 2026-01-30 |
| Wedbush | Maintain | Outperform | 2026-01-30 |
| Mizuho | Maintain | Outperform | 2026-01-27 |
| Morgan Stanley | Maintain | Overweight | 2026-01-22 |
Super Micro Computer, Inc. Grades
Below are the recent official grades for Super Micro Computer, Inc. from recognized grading firms:
| Grading Company | Action | New Grade | Date |
|---|---|---|---|
| Barclays | Maintain | Equal Weight | 2024-10-02 |
| Loop Capital | Maintain | Buy | 2024-09-23 |
| JP Morgan | Downgrade | Neutral | 2024-09-06 |
| Barclays | Downgrade | Equal Weight | 2024-09-04 |
| Barclays | Maintain | Overweight | 2024-08-28 |
| Wells Fargo | Maintain | Equal Weight | 2024-08-28 |
| CFRA | Downgrade | Hold | 2024-08-28 |
| Goldman Sachs | Maintain | Neutral | 2024-08-08 |
| Wells Fargo | Maintain | Equal Weight | 2024-08-07 |
| Rosenblatt | Maintain | Buy | 2024-08-07 |
Which company has the best grades?
Western Digital consistently receives positive grades, mostly Buy and Overweight, reflecting strong institutional confidence. Super Micro’s grades show more variability and downgrades, indicating mixed sentiment. Western Digital’s steadier grades may signal greater stability for investors.
Risks specific to each company
The following categories identify the critical pressure points and systemic threats facing both firms in the 2026 market environment:
1. Market & Competition
Western Digital Corporation
- Faces intense competition in data storage; market saturation risks pressure margins.
Super Micro Computer, Inc.
- Competes in modular server solutions with specialization but smaller scale limits pricing power.
2. Capital Structure & Debt
Western Digital Corporation
- Moderate leverage with debt-to-assets at 36%; interest coverage ratio at 4.17 signals manageable debt but caution warranted.
Super Micro Computer, Inc.
- Slightly lower leverage at 34%, strong interest coverage of 21.34 reduces refinancing risk significantly.
3. Stock Volatility
Western Digital Corporation
- Beta at 1.839 indicates high sensitivity to market swings; wide price range suggests volatility risk.
Super Micro Computer, Inc.
- Beta at 1.523 shows moderate volatility; price range is narrower but volume spikes may trigger abrupt moves.
4. Regulatory & Legal
Western Digital Corporation
- Exposure to international trade regulations in storage products; potential IP litigation risks.
Super Micro Computer, Inc.
- Faces regulatory scrutiny in server and AI markets; compliance costs could rise with evolving data laws.
5. Supply Chain & Operations
Western Digital Corporation
- Global supply chain complexity for HDD and SSD manufacturing poses operational disruption risks.
Super Micro Computer, Inc.
- Relies on modular components sourcing; supply chain agility is better but scale limits bargaining power.
6. ESG & Climate Transition
Western Digital Corporation
- Moderate ESG risk; manufacturing footprint and energy use under scrutiny by investors and regulators.
Super Micro Computer, Inc.
- Smaller footprint but increasing pressure to align with climate goals in data center solutions market.
7. Geopolitical Exposure
Western Digital Corporation
- Significant exposure to US-China tensions impacting production and sales channels.
Super Micro Computer, Inc.
- Also exposed to international markets, but less reliant on China manufacturing reduces some geopolitical risk.
Which company shows a better risk-adjusted profile?
Western Digital’s biggest risk is its high market volatility and exposure to geopolitical tensions, which could disrupt its large, complex supply chain. Super Micro’s critical risk lies in its weaker profitability and financial health, reflected in a lower Piotroski score and “grey zone” Altman Z-Score. Despite higher debt coverage and operational agility, Super Micro’s lower net margins and financial strength flag caution. I see Western Digital as having a better risk-adjusted profile due to stronger profitability and financial scores, even though its market risks remain elevated.
Final Verdict: Which stock to choose?
Western Digital’s superpower lies in its robust capital efficiency and impressive value creation, demonstrated by a growing ROIC well above its cost of capital. The point of vigilance is its moderate liquidity profile, which could constrain flexibility in volatile markets. This stock suits investors seeking aggressive growth with a value tilt.
Super Micro Computer commands a strategic moat through operational agility and strong asset turnover, supported by a solid liquidity cushion. Relative to Western Digital, it offers a safer balance sheet but sheds value on capital employed. It fits portfolios focused on GARP—growth at a reasonable price with an eye on stability.
If you prioritize sustained value creation and capital efficiency, Western Digital outshines as the compelling choice due to its proven moat and accelerating growth trajectory. However, if you seek balance with operational safety and less volatility, Super Micro Computer offers better stability despite a weaker capital return profile. Both present distinct analytical scenarios tailored to different investor risk appetites.
Disclaimer: Investment carries a risk of loss of initial capital. The past performance is not a reliable indicator of future results. Be sure to understand risks before making an investment decision.
Go Further
I encourage you to read the complete analyses of Western Digital Corporation and Super Micro Computer, Inc. to enhance your investment decisions: