Home > Comparison > Healthcare > SYK vs ZBH
The strategic rivalry between Stryker Corporation and Zimmer Biomet Holdings defines the current trajectory of the medical devices sector. Stryker operates a diversified medical technology model spanning MedSurg, Neurotechnology, and Orthopaedics, while Zimmer Biomet focuses on musculoskeletal healthcare and reconstructive products. This analysis contrasts their capital allocation and growth strategies to identify which offers superior risk-adjusted returns for a diversified healthcare portfolio in 2026.
Table of contents
Companies Overview
Stryker Corporation and Zimmer Biomet Holdings are pivotal players in the global medical devices market.
Stryker Corporation: Medical Technology Innovator
Stryker dominates the Medical – Devices sector through two segments: Orthopaedics and Spine, and MedSurg and Neurotechnology. Its core revenue comes from implants for joint replacements and advanced surgical equipment. In 2026, Stryker focuses strategically on expanding minimally invasive surgical technologies and neurotechnology products to deepen its market reach.
Zimmer Biomet Holdings, Inc.: Musculoskeletal Healthcare Leader
Zimmer Biomet specializes in orthopaedic reconstructive products including knees, hips, and spine devices, along with dental and trauma solutions. Its revenue engine thrives on diverse musculoskeletal healthcare products marketed globally. The company’s 2026 strategy centers on enhancing robotic surgery capabilities and broadening its footprint in regenerative medicine.
Strategic Collision: Similarities & Divergences
Both firms target orthopaedics but diverge in approach: Stryker emphasizes a broader surgical technology ecosystem, while Zimmer Biomet focuses on specialized musculoskeletal and dental solutions. Their primary battleground is advanced implant innovation and minimally invasive procedures. Investors face distinct profiles: Stryker’s scale and diversification contrast with Zimmer Biomet’s niche expertise and focused growth.
Income Statement Comparison
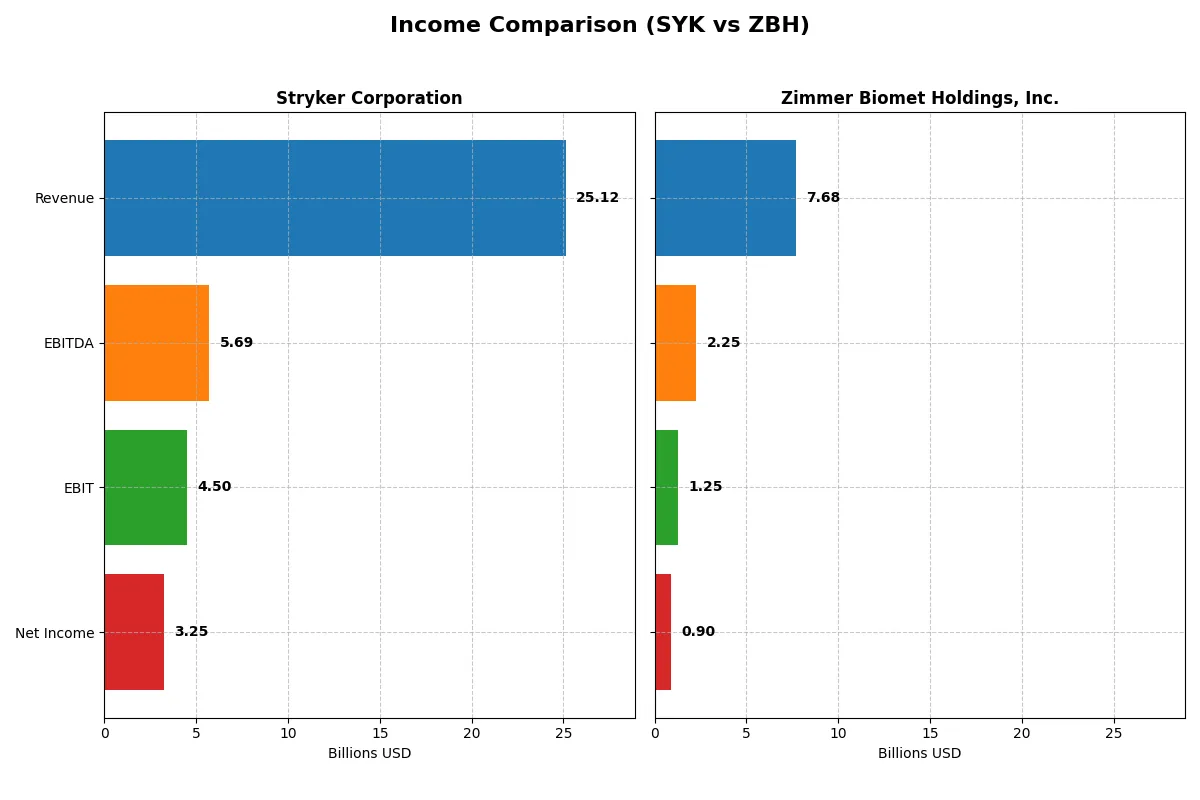
This data dissects the core profitability and scalability of both corporate engines to reveal who dominates the bottom line:
| Metric | Stryker Corporation (SYK) | Zimmer Biomet Holdings, Inc. (ZBH) |
|---|---|---|
| Revenue | 25.1B | 7.7B |
| Cost of Revenue | 9.7B | 2.2B |
| Operating Expenses | 9.8B | 4.2B |
| Gross Profit | 15.4B | 5.5B |
| EBITDA | 5.7B | 2.3B |
| EBIT | 4.5B | 1.3B |
| Interest Expense | 0 | 218M |
| Net Income | 3.2B | 904M |
| EPS | 8.49 | 4.45 |
| Fiscal Year | 2025 | 2024 |
Income Statement Analysis: The Bottom-Line Duel
This income statement comparison uncovers the operational efficiency and profitability trajectory that define each company’s financial engine.
Stryker Corporation Analysis
Stryker’s revenue surged from $17.1B in 2021 to $25.1B in 2025, reflecting robust growth. Net income grew by 63%, reaching $3.25B in 2025. Its gross margin stands at a strong 61.4%, while net margin remains healthy at 12.9%. The company’s EBIT margin improved to 17.9%, signaling efficient expense management and solid momentum in profitability.
Zimmer Biomet Holdings, Inc. Analysis
Zimmer Biomet’s revenue expanded from $6.1B in 2020 to $7.7B in 2024, a moderate increase. Net income jumped significantly from a loss in 2020 to $904M in 2024. Its gross margin is notably higher at 71.5%, with a net margin of 11.8%. However, EBIT margin declined slightly to 16.3%, reflecting pressure on operating efficiency despite strong margin levels.
Growth Momentum vs. Margin Strength
Stryker delivers superior top-line growth and margin expansion, with consistent operational efficiency gains. Zimmer Biomet boasts higher gross margins but shows weaker EBIT growth and margin contraction recently. Stryker’s profile appeals more to investors seeking sustained earnings momentum combined with expanding profitability.
Financial Ratios Comparison
These vital ratios act as a diagnostic tool to expose the underlying fiscal health, valuation premiums, and capital efficiency of the companies compared below:
| Ratios | Stryker Corporation (SYK) | Zimmer Biomet Holdings, Inc. (ZBH) |
|---|---|---|
| ROE | 14.48% | 7.25% |
| ROIC | 7.37% | 5.68% |
| P/E | 41.38 | 23.74 |
| P/B | 5.99 | 1.72 |
| Current Ratio | 1.89 | 1.91 |
| Quick Ratio | 1.21 | 0.99 |
| D/E | 0.66 | 0.50 |
| Debt-to-Assets | 31.06% | 29.04% |
| Interest Coverage | 0 | 5.90 |
| Asset Turnover | 0.52 | 0.36 |
| Fixed Asset Turnover | 6.48 | 3.75 |
| Payout Ratio | 39.56% | 21.69% |
| Dividend Yield | 0.96% | 0.91% |
| Fiscal Year | 2025 | 2024 |
Efficiency & Valuation Duel: The Vital Signs
Ratios act as a company’s DNA, revealing both hidden risks and operational excellence crucial for investors’ decisions.
Stryker Corporation
Stryker delivers solid profitability with a 14.48% ROE and a favorable 12.92% net margin, signaling operational strength. However, its P/E ratio at 41.38 marks the stock as expensive versus peers. The firm returns value modestly through a 0.96% dividend yield, balancing payouts with reinvestment in R&D for growth.
Zimmer Biomet Holdings, Inc.
Zimmer Biomet shows respectable profitability, with an 11.77% net margin but a weaker 7.25% ROE, indicating less efficiency. Its valuation appears more reasonable with a P/E of 23.74. The company offers a 0.91% dividend yield, reflecting a cautious payout amid efforts to maintain financial stability and invest selectively.
Premium Valuation vs. Operational Safety
Stryker’s higher profitability contrasts with its stretched valuation, raising risk for value-focused investors. Zimmer Biomet trades at a more attractive price but delivers lower returns on equity. Investors seeking growth may favor Stryker’s profile, while those prioritizing balanced risk might lean toward Zimmer Biomet.
Which one offers the Superior Shareholder Reward?
I compare Stryker Corporation (SYK) and Zimmer Biomet Holdings (ZBH) on shareholder returns. SYK yields ~0.96% with a 40% payout ratio, backed by strong free cash flow (FCF) coverage above 2.4x. Its buybacks are modest but consistent. ZBH offers a similar dividend yield near 0.91% but with a more conservative payout ratio of ~22%, preserving cash for steady buybacks and reinvestment. Zimmer’s free cash flow coverage exceeds 2.7x, signaling solid dividend sustainability. Historically, SYK’s higher payout risks compression under downturns, while ZBH’s balanced distribution and buybacks foster long-term value. In 2026, I favor Zimmer Biomet for a superior total return profile, blending yield with capital allocation discipline.
Comparative Score Analysis: The Strategic Profile
The radar chart reveals the fundamental DNA and trade-offs of Stryker Corporation and Zimmer Biomet Holdings, Inc., highlighting their strategic strengths and vulnerabilities:
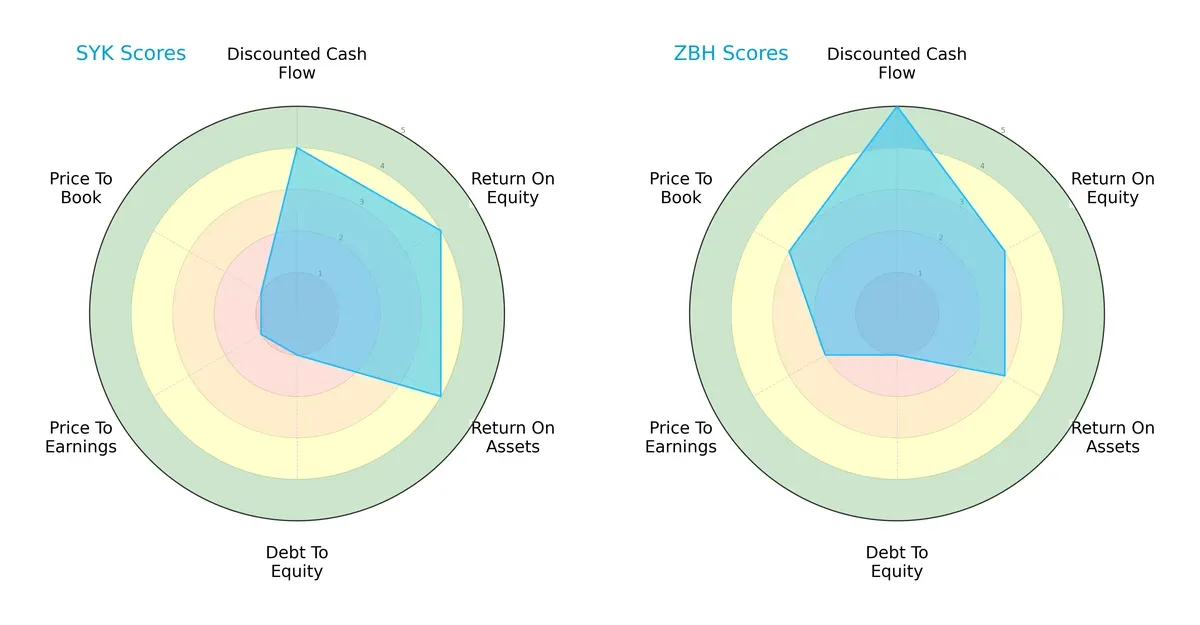
Stryker shows superior operational efficiency with higher ROE (4) and ROA (4) scores, reflecting stronger asset utilization. Zimmer Biomet excels in discounted cash flow (5) and valuation metrics (P/E 2, P/B 3), indicating better market pricing and cash flow prospects. Both companies share a weak debt-to-equity score (1), signaling leverage concerns. Zimmer presents a more balanced profile, while Stryker leans on operational prowess but struggles with valuation and leverage.
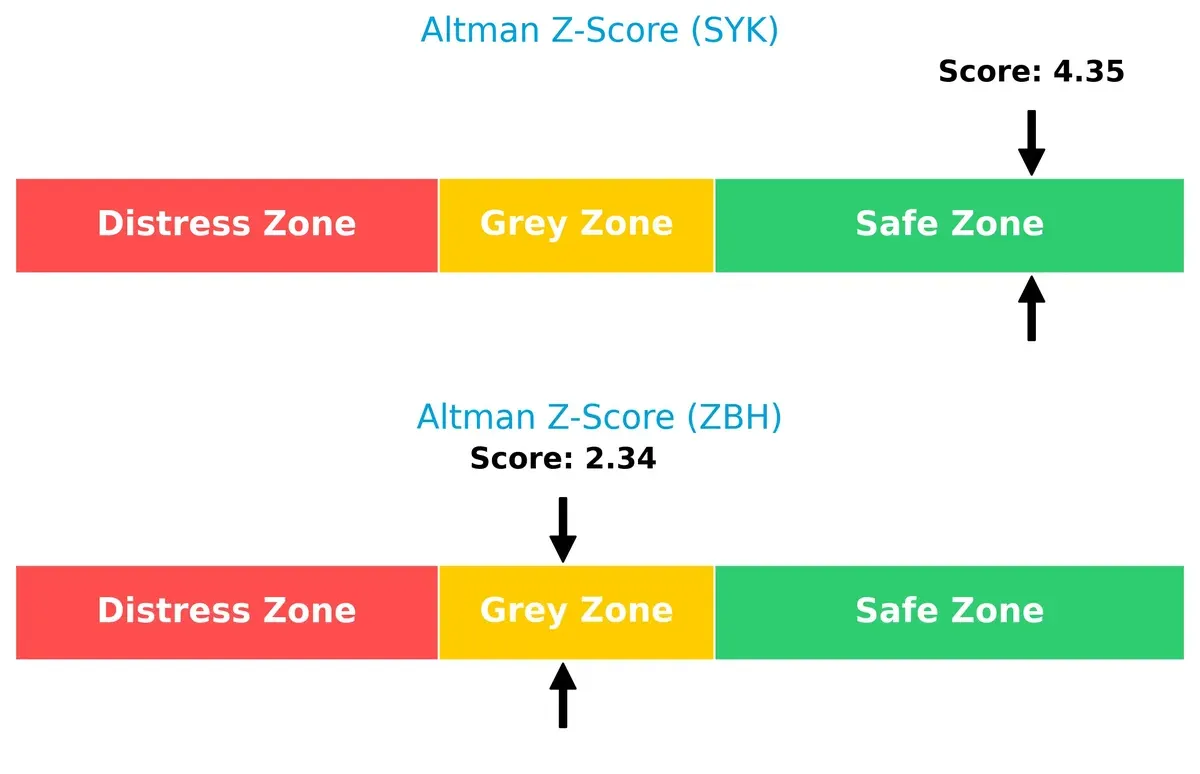
Bankruptcy Risk: Solvency Showdown
Stryker’s Altman Z-Score of 4.35 places it safely above distress thresholds, while Zimmer’s 2.34 signals moderate bankruptcy risk in this cycle:
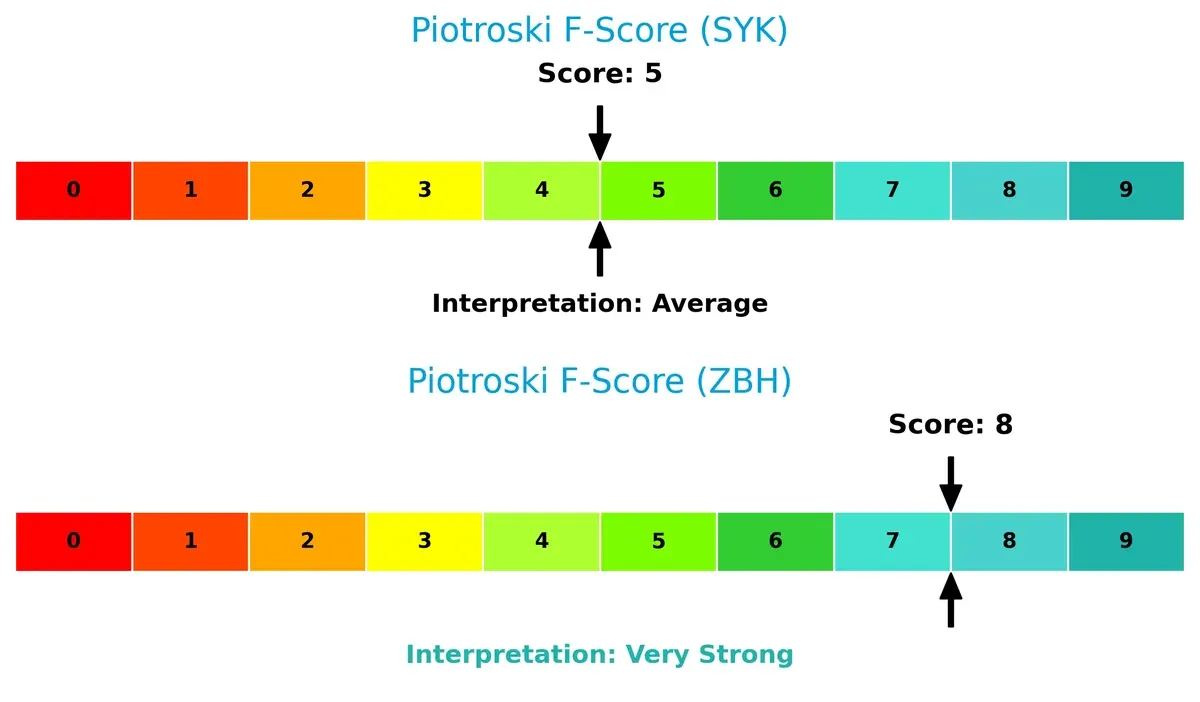
Financial Health: Quality of Operations
Zimmer’s Piotroski F-Score at 8 shows robust financial health and internal strength, outperforming Stryker’s average score of 5, which raises mild red flags on operational quality:
How are the two companies positioned?
This section dissects the operational DNA of Stryker and Zimmer Biomet by comparing their revenue distribution and internal strengths and weaknesses. The goal is to confront their economic moats and identify which model offers the most resilient competitive advantage today.
Revenue Segmentation: The Strategic Mix
This visual comparison dissects how Stryker Corporation and Zimmer Biomet Holdings diversify their income streams and where their primary sector bets lie:
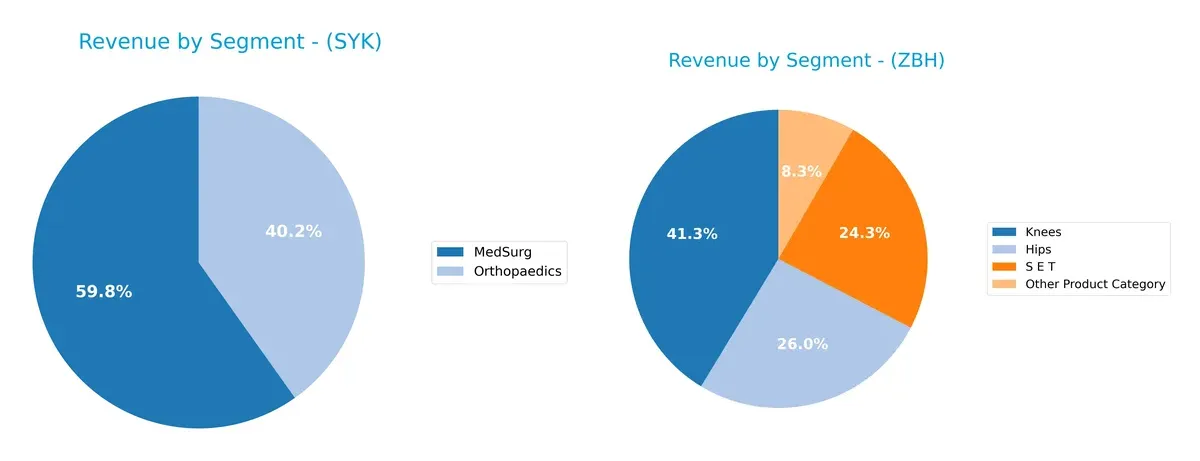
Stryker dominates with MedSurg at $13.5B and Orthopaedics near $9.1B, showing a strong two-segment focus. Zimmer Biomet spreads revenue across Knees ($3.2B), Hips ($2B), S E T ($1.9B), and Other ($640M), revealing a more diversified portfolio. Stryker’s concentration fuels deep ecosystem lock-in, while Zimmer’s mix reduces single-segment risk but may dilute scale advantages.
Strengths and Weaknesses Comparison
This table compares the strengths and weaknesses of Stryker Corporation and Zimmer Biomet Holdings, Inc.:
Stryker Strengths
- Strong revenue diversification in MedSurg and Orthopaedics
- Favorable net margin at 12.92%
- Robust current and quick ratios indicate liquidity
- High fixed asset turnover at 6.48
- Global presence with significant US and EMEA sales
Zimmer Biomet Strengths
- Balanced product segmentation across Hips, Knees, and S E T
- Favorable net margin at 11.77%
- Solid debt metrics with low debt-to-assets at 29%
- Favorable interest coverage ratio at 5.76
- Global sales well spread in Americas, Asia Pacific, and EMEA
Stryker Weaknesses
- Unfavorable valuation multiples with PE at 41.38 and PB at 5.99
- Neutral ROE and ROIC close to WACC indicate limited capital efficiency
- Low dividend yield below 1%
- Moderate debt levels with D/E at 0.66
- Asset turnover moderate at 0.52
Zimmer Biomet Weaknesses
- Unfavorable ROE at 7.25% well below industry standards
- Unfavorable asset turnover at 0.36 affects efficiency
- Neutral PE and PB valuations limit upside clarity
- Quick ratio just below 1 suggests tighter liquidity
- Dividend yield also below 1%
Both companies exhibit slightly favorable overall financial health but face challenges in capital efficiency and valuation multiples. Stryker’s stronger product diversification contrasts with Zimmer Biomet’s more conservative leverage profile, shaping distinct strategic priorities.
The Moat Duel: Analyzing Competitive Defensibility
A structural moat protects long-term profits from competition’s erosion; only a durable moat sustains economic value over time:
Stryker Corporation: Innovation-Driven Intangible Assets
Stryker’s moat stems from its deep portfolio of patented surgical and neurotechnology devices. This drives stable margins and strong revenue growth. Yet, declining ROIC signals margin pressure in 2026, risking moat erosion.
Zimmer Biomet Holdings, Inc.: Operational Efficiency and Scale
Zimmer Biomet leverages cost advantages and scale in orthopaedics, delivering above-industry gross margins. Unlike Stryker, its improving ROIC trend indicates operational gains and expanding market reach, offsetting short-term margin softness.
Innovation Intensity vs. Operational Scale: Who Holds the Moat Edge?
Stryker’s intangible asset moat is more vulnerable now, with shrinking ROIC and margin risks. Zimmer Biomet’s rising ROIC and cost efficiency suggest a deeper, more sustainable moat. Zimmer Biomet appears better positioned to defend and grow market share in the evolving landscape.
Which stock offers better returns?
Over the past 12 months, Stryker Corporation and Zimmer Biomet Holdings, Inc. exhibited contrasting price trajectories with shifts in momentum and trading activity.
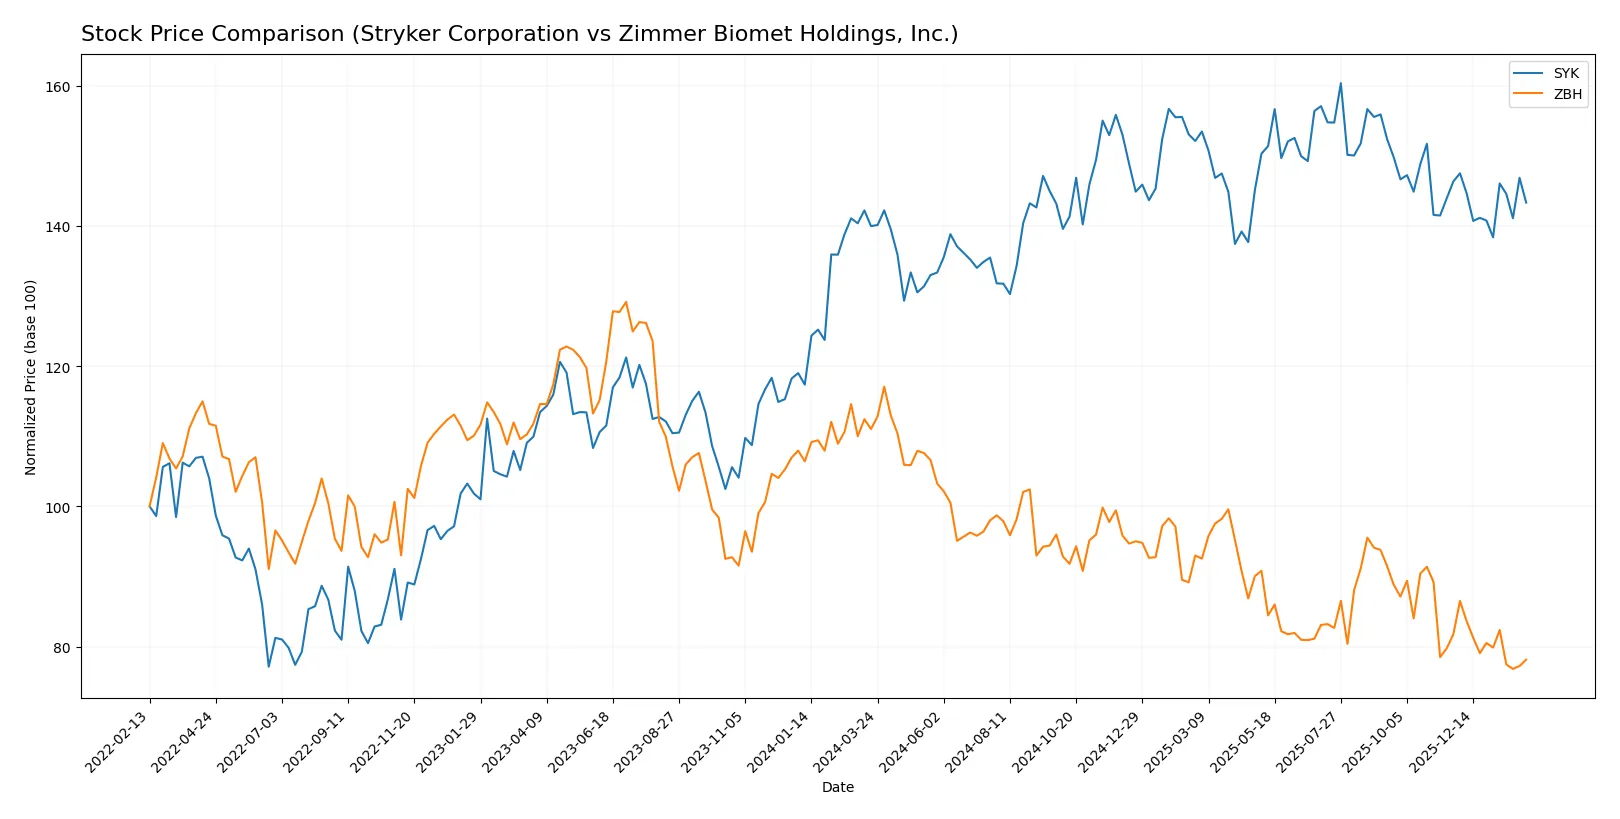
Trend Comparison
Stryker Corporation’s stock rose 2.39% over the past year, marking a bullish trend with decelerating gains and a high-low range between 403.53 and 325.43.
Zimmer Biomet’s shares fell 29.62% over the same period, reflecting a bearish trend with deceleration and a price range from 131.98 down to 86.6.
Stryker outperformed Zimmer Biomet, delivering positive returns while Zimmer faced significant declines, resulting in the highest market performance among the two.
Target Prices
Analysts show a bullish outlook on Stryker Corporation and Zimmer Biomet Holdings, Inc., with clear upside potential.
| Company | Target Low | Target High | Consensus |
|---|---|---|---|
| Stryker Corporation | 390 | 469 | 426 |
| Zimmer Biomet Holdings, Inc. | 86 | 130 | 108 |
The target consensus for Stryker at 426 sits about 18% above its current 361 price, signaling solid growth expectations. Zimmer Biomet’s 108 target consensus offers a 23% premium over its 88 current price, reflecting optimistic analyst sentiment.

Don’t Let Luck Decide Your Entry Point
Optimize your entry points with our advanced ProRealTime indicators. You’ll get efficient buy signals with precise price targets for maximum performance. Start outperforming now!
How do institutions grade them?
Here is a comparison of recent institutional grades for Stryker Corporation and Zimmer Biomet Holdings, Inc.:
Stryker Corporation Grades
The latest institutional grades for Stryker Corporation are summarized below.
| Grading Company | Action | New Grade | Date |
|---|---|---|---|
| BTIG | Maintain | Buy | 2026-01-30 |
| Needham | Maintain | Buy | 2026-01-30 |
| Bernstein | Maintain | Outperform | 2026-01-09 |
| Citizens | Upgrade | Market Outperform | 2025-12-19 |
| Truist Securities | Maintain | Hold | 2025-12-18 |
| Citigroup | Maintain | Buy | 2025-12-11 |
| Needham | Maintain | Buy | 2025-11-14 |
| Truist Securities | Maintain | Hold | 2025-11-14 |
| Wells Fargo | Maintain | Overweight | 2025-11-14 |
| BTIG | Maintain | Buy | 2025-11-14 |
Zimmer Biomet Holdings, Inc. Grades
The recent institutional grades for Zimmer Biomet Holdings, Inc. are detailed here.
| Grading Company | Action | New Grade | Date |
|---|---|---|---|
| UBS | Maintain | Sell | 2026-01-28 |
| Bernstein | Maintain | Market Perform | 2026-01-09 |
| BTIG | Maintain | Buy | 2026-01-08 |
| Evercore ISI Group | Upgrade | Outperform | 2026-01-05 |
| Baird | Downgrade | Neutral | 2025-12-16 |
| Citigroup | Maintain | Neutral | 2025-12-11 |
| Canaccord Genuity | Maintain | Hold | 2025-11-10 |
| Barclays | Maintain | Underweight | 2025-11-06 |
| RBC Capital | Maintain | Outperform | 2025-11-06 |
| JP Morgan | Downgrade | Neutral | 2025-11-06 |
Which company has the best grades?
Stryker Corporation has received consistently stronger grades, mostly Buy and Outperform ratings. Zimmer Biomet’s grades are more mixed, including Sell and Neutral ratings. This disparity may influence investor confidence and perceived growth potential.
Risks specific to each company
The following categories identify the critical pressure points and systemic threats facing both firms in the 2026 market environment:
1. Market & Competition
Stryker Corporation
- Strong presence in surgical navigation and orthopaedics, but faces premium valuation risk.
Zimmer Biomet Holdings, Inc.
- Competes in musculoskeletal healthcare with a lower market cap and moderate valuation.
2. Capital Structure & Debt
Stryker Corporation
- Moderate debt-to-equity ratio (0.66), but low debt rating signals caution.
Zimmer Biomet Holdings, Inc.
- Lower debt-to-equity (0.5) with favorable debt metrics; stronger balance sheet resilience.
3. Stock Volatility
Stryker Corporation
- Beta at 0.87 indicates moderate volatility aligned with healthcare sector trends.
Zimmer Biomet Holdings, Inc.
- Lower beta at 0.61 suggests less price fluctuation and lower market risk.
4. Regulatory & Legal
Stryker Corporation
- Exposure to complex global medical device regulations; litigation risk remains high.
Zimmer Biomet Holdings, Inc.
- Similar regulatory environment with additional risks from product recalls in orthopaedics.
5. Supply Chain & Operations
Stryker Corporation
- Global supply chain dependency; disruption risk elevated by geopolitical tensions.
Zimmer Biomet Holdings, Inc.
- Smaller scale but diversified global operations; supply risks mitigated by leaner footprint.
6. ESG & Climate Transition
Stryker Corporation
- Increasing ESG pressures to reduce carbon footprint and improve sustainability practices.
Zimmer Biomet Holdings, Inc.
- Advanced ESG initiatives but challenges remain in sourcing and waste management.
7. Geopolitical Exposure
Stryker Corporation
- Significant international sales expose it to currency and trade policy risks.
Zimmer Biomet Holdings, Inc.
- Exposure concentrated in Americas and Europe, somewhat insulating from Asia-Pacific volatility.
Which company shows a better risk-adjusted profile?
Stryker faces its biggest risk in valuation and capital structure, with a high P/E and poor debt rating despite solid operating fundamentals. Zimmer Biomet’s key risk lies in operational scale and regulatory pressures but benefits from a stronger balance sheet and lower volatility. Zimmer Biomet’s Altman Z-Score places it in a grey zone, while Stryker is firmly in the safe zone. This dynamic suggests Zimmer’s risk-adjusted profile is slightly less robust. Zimmer’s recent improvement in discounted cash flow scores signals potential undervaluation, but its moderate ROE and operational risks weigh on its profile. Overall, Stryker shows a marginally better risk-adjusted position due to stronger liquidity and operational efficiency despite its stretched valuation.
Final Verdict: Which stock to choose?
Stryker Corporation’s superpower lies in its operational excellence and consistent cash generation, positioning it as a robust cash machine. However, its declining return on invested capital signals a point of vigilance. It suits investors seeking aggressive growth with tolerance for cyclical value erosion risks.
Zimmer Biomet Holdings, Inc. offers a strategic moat through its improving profitability trend and solid income quality, despite currently shedding value. Its more moderate valuation and stronger balance sheet stability make it a fit for investors favoring growth at a reasonable price with a tilt toward safety.
If you prioritize operational efficiency and strong cash flow generation, Stryker outshines due to its superior income growth and market presence. However, if you seek a more stable growth profile with improving profitability, Zimmer offers better stability and an attractive risk-reward balance despite recent price weakness. Both present analytical scenarios worth considering based on your portfolio’s risk tolerance and strategic goals.
Disclaimer: Investment carries a risk of loss of initial capital. The past performance is not a reliable indicator of future results. Be sure to understand risks before making an investment decision.
Go Further
I encourage you to read the complete analyses of Stryker Corporation and Zimmer Biomet Holdings, Inc. to enhance your investment decisions: