In today’s dynamic tech landscape, Workday, Inc. (WDAY) and Strategy Inc (MSTR) stand out as compelling players within the software application industry. While Workday focuses on enterprise cloud solutions for finance and human capital management, Strategy Inc uniquely blends AI-powered analytics with bitcoin treasury management. This comparison explores their market approaches and innovation strategies, guiding investors toward the company with the most promising growth potential. Let’s uncover which stock deserves a place in your portfolio.

Table of contents
Companies Overview
I will begin the comparison between Workday, Inc. and Strategy Inc by providing an overview of these two companies and their main differences.
Workday Overview
Workday, Inc. is a leading provider of enterprise cloud applications in the software application industry. The company focuses on financial management, human capital management, planning, and analytics solutions to help organizations optimize operations and gain real-time insights. Headquartered in Pleasanton, California, Workday serves diverse sectors including healthcare, education, government, and retail, emphasizing efficiency and automation in business processes.
Strategy Overview
Strategy Inc operates as a bitcoin treasury company offering investors exposure to Bitcoin through various securities, alongside AI-powered enterprise analytics software. Its products include Strategy One for actionable insights and Strategy Mosaic for data governance across platforms. Founded in 1989 and based in Tysons Corner, Virginia, Strategy serves global markets, blending cryptocurrency investment with advanced analytics solutions for enterprises.
Key similarities and differences
Both companies operate in the software application industry, leveraging cloud and AI technologies to serve enterprise clients. Workday primarily focuses on financial and human capital management solutions, while Strategy combines bitcoin-related investment products with AI analytics software. Workday’s larger workforce and diverse industry reach contrast with Strategy’s specialized focus on cryptocurrency exposure and data intelligence tools.
Income Statement Comparison
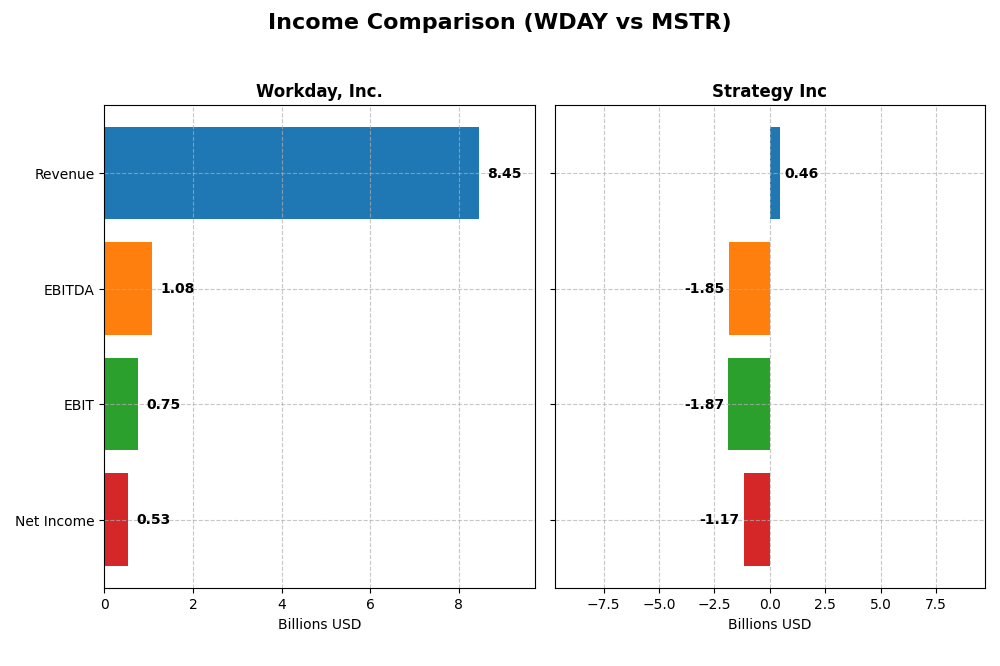
This table compares key income statement metrics for Workday, Inc. and Strategy Inc for their most recent fiscal years, providing a snapshot of their financial performance.
| Metric | Workday, Inc. (WDAY) | Strategy Inc (MSTR) |
|---|---|---|
| Market Cap | 49.9B | 50.3B |
| Revenue | 8.45B | 463M |
| EBITDA | 1.08B | -1.85B |
| EBIT | 752M | -1.87B |
| Net Income | 526M | -1.17B |
| EPS | 1.98 | -6.06 |
| Fiscal Year | 2025 | 2024 |
Income Statement Interpretations
Workday, Inc.
Workday’s revenue increased steadily from $4.3B in 2021 to $8.4B in 2025, nearly doubling over five years. Net income improved significantly, turning from losses into a $526M profit in 2025. Gross margin remained favorable at 75.5%, with EBIT margin neutral at 8.9%. The recent year saw 16.35% revenue growth but a decline in net margin and EPS by over 60%.
Strategy Inc
Strategy Inc’s revenue declined modestly from $480M in 2020 to $463M in 2024. Net income fluctuated widely, turning deeply negative to -$1.17B in 2024 after a positive $438M in 2023. The gross margin remained favorable at 72%, but EBIT and net margins were substantially negative, reflecting high interest expenses and operating losses. The latest year showed declines in all key growth metrics.
Which one has the stronger fundamentals?
Workday exhibits stronger fundamentals with consistent revenue growth, improving profitability, and favorable margins, despite some recent margin compression. In contrast, Strategy Inc faces persistent losses, negative EBIT and net margins, high interest costs, and declining revenues. The overall income statement evaluation favors Workday, which demonstrates more stable and positive financial performance.
Financial Ratios Comparison
The following table compares key financial ratios for Workday, Inc. (WDAY) and Strategy Inc (MSTR) based on the most recent full fiscal year data available, FY 2025 for WDAY and FY 2024 for MSTR.
| Ratios | Workday, Inc. (WDAY) | Strategy Inc (MSTR) |
|---|---|---|
| ROE | 5.8% | -6.4% |
| ROIC | 2.7% | -4.4% |
| P/E | 132.2 | -47.8 |
| P/B | 7.7 | 3.1 |
| Current Ratio | 1.85 | 0.71 |
| Quick Ratio | 1.85 | 0.71 |
| D/E (Debt-to-Equity) | 0.37 | 0.40 |
| Debt-to-Assets | 18.7% | 28.1% |
| Interest Coverage | 3.64 | -29.9 |
| Asset Turnover | 0.47 | 0.02 |
| Fixed Asset Turnover | 5.36 | 5.73 |
| Payout Ratio | 0 | 0 |
| Dividend Yield | 0 | 0 |
Data is reported in USD and ratios are expressed as decimals or percentages where applicable. Negative values in P/E and interest coverage ratios for Strategy Inc indicate net losses and negative earnings coverage respectively.
Interpretation of the Ratios
Workday, Inc.
Workday shows a mixed ratio profile with favorable liquidity (current and quick ratios at 1.85) and debt management (debt-to-equity at 0.37) but faces challenges in profitability metrics like ROE (5.82%) and ROIC (2.73%), both viewed as unfavorable. The company does not pay dividends, reflecting a focus on reinvestment and growth rather than shareholder payouts.
Strategy Inc
Strategy Inc exhibits predominantly unfavorable financial ratios, including a deeply negative net margin (-251.73%) and ROE (-6.4%), alongside weak liquidity ratios (current and quick ratios at 0.71). Despite a favorable debt-to-equity ratio (0.4), the company pays no dividends, likely prioritizing reinvestment, growth, or managing its volatile bitcoin treasury exposure.
Which one has the best ratios?
Between the two, Workday presents a more balanced financial structure with stronger liquidity and debt management, despite some profitability weaknesses. Strategy Inc’s ratios are largely unfavorable, with significant profitability and liquidity concerns. Overall, Workday’s ratio profile is comparatively stronger and less risky based on the available data.
Strategic Positioning
This section compares the strategic positioning of Workday, Inc. and Strategy Inc, including market position, key segments, and exposure to technological disruption:
Workday, Inc.
- Established software application provider with $49.9B market cap, facing moderate competitive pressure (beta 1.14).
- Key segments include subscription services ($7.7B in 2025) and professional services ($728M in 2025).
- Provides cloud enterprise applications with augmented analytics and machine learning integration.
Strategy Inc
- Bitcoin treasury and AI analytics company with $50.3B market cap, facing high competitive pressure (beta 3.43).
- Diverse revenue from licenses, maintenance, subscriptions, and technology services totaling several hundred million.
- Offers AI-powered analytics software and bitcoin-related financial products, blending tech and crypto sectors.
Workday, Inc. vs Strategy Inc Positioning
Workday has a diversified business focused on cloud applications and enterprise solutions with steady subscription growth. Strategy Inc concentrates on bitcoin treasury and AI analytics, blending financial and technological services, but with a smaller employee base and higher market volatility.
Which has the best competitive advantage?
Both companies are shedding value relative to their cost of capital; Workday shows improving profitability with growing ROIC, while Strategy Inc faces declining ROIC and worsening profitability, indicating a weaker competitive moat for Strategy Inc.
Stock Comparison
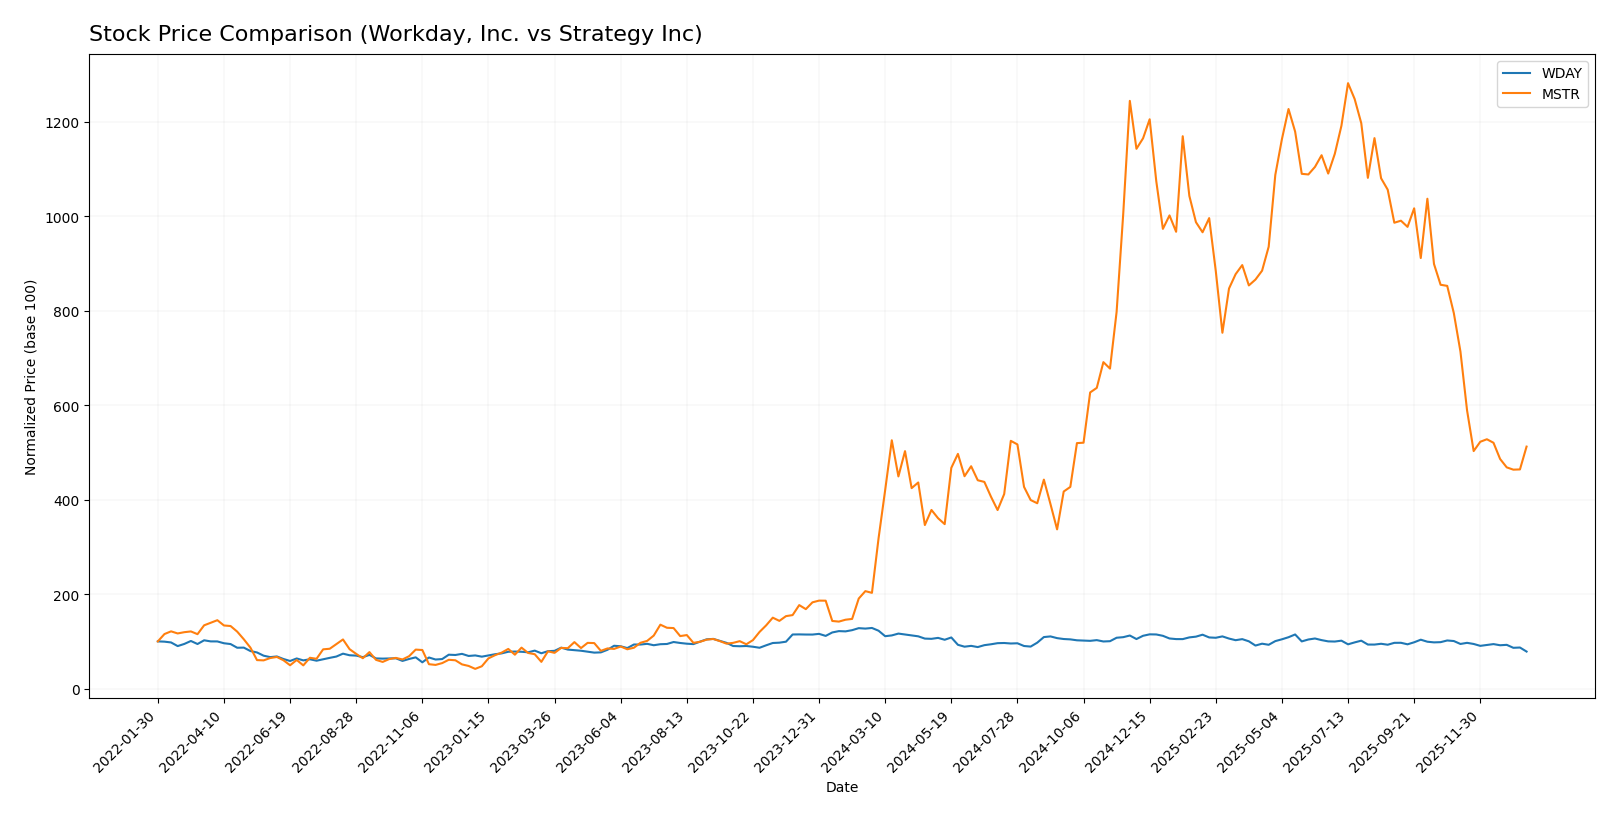
The stock price movements over the past year reveal contrasting dynamics, with Workday, Inc. exhibiting a significant decline and Strategy Inc showing notable gains, despite recent downward adjustments in both.
Trend Analysis
Workday, Inc. experienced a bearish trend over the past 12 months, with a price decrease of 38.91%. The trend shows deceleration, a high volatility of 20.22, and a peak price of 305.88 contrasted by a low of 186.86.
Strategy Inc demonstrated a bullish trend over the same period, gaining 152.71%. Although the trend is decelerating, volatility remains very high at 103.09. The highest price reached 434.58, with a low of 68.74.
Comparing the two, Strategy Inc delivered the highest market performance, outperforming Workday, Inc. by a wide margin in percentage terms over the past year.
Target Prices
Analysts provide a clear target price consensus for Workday, Inc. and Strategy Inc, reflecting expected stock performance ranges.
| Company | Target High | Target Low | Consensus |
|---|---|---|---|
| Workday, Inc. | 320 | 235 | 274.47 |
| Strategy Inc | 705 | 175 | 433.57 |
The consensus target prices suggest substantial upside potential for both stocks compared to their current prices: Workday trades near 187 USD, well below its 274.47 USD consensus, while Strategy Inc trades around 174 USD, significantly lower than its 433.57 USD consensus. This indicates overall positive analyst expectations.
Analyst Opinions Comparison
This section compares analysts’ ratings and grades for Workday, Inc. and Strategy Inc:
Rating Comparison
WDAY Rating
- Rating: B-, considered Very Favorable overall.
- Discounted Cash Flow Score: 4, indicating a Favorable valuation outlook.
- ROE Score: 3, reflecting Moderate efficiency in generating profit from equity.
- ROA Score: 3, indicating Moderate asset utilization efficiency.
- Debt To Equity Score: 2, representing Moderate financial risk.
- Overall Score: 2, assessed as Moderate overall financial standing.
MSTR Rating
- Rating: A-, considered Very Favorable overall.
- Discounted Cash Flow Score: 1, signaling a Very Unfavorable valuation outlook.
- ROE Score: 4, reflecting Favorable efficiency in generating profit from equity.
- ROA Score: 5, indicating Very Favorable asset utilization efficiency.
- Debt To Equity Score: 3, representing Moderate financial risk.
- Overall Score: 4, assessed as Favorable overall financial standing.
Which one is the best rated?
Based strictly on provided data, Strategy Inc (MSTR) holds a superior overall rating (A-) and higher scores in ROE, ROA, and overall financial standing compared to Workday, Inc. (WDAY), which has a B- rating and lower scores.
Scores Comparison
The comparison of the Altman Z-Score and Piotroski Score for both companies is as follows:
WDAY Scores
- Altman Z-Score: 4.41, indicating a safe zone for bankruptcy risk.
- Piotroski Score: 6, reflecting average financial strength.
MSTR Scores
- Altman Z-Score: 2.78, indicating a grey zone with moderate bankruptcy risk.
- Piotroski Score: 4, reflecting average financial strength.
Which company has the best scores?
WDAY has a higher Altman Z-Score, placing it in the safe zone, compared to MSTR’s grey zone score. Both have average Piotroski Scores, but WDAY’s score is slightly higher.
Grades Comparison
The following is a comparison of the recent grades assigned to Workday, Inc. and Strategy Inc by various reputable grading companies:
Workday, Inc. Grades
This table presents the latest grades and actions from leading financial institutions on Workday, Inc.:
| Grading Company | Action | New Grade | Date |
|---|---|---|---|
| Barclays | Maintain | Overweight | 2026-01-12 |
| RBC Capital | Maintain | Outperform | 2026-01-05 |
| TD Cowen | Maintain | Buy | 2025-11-26 |
| DA Davidson | Maintain | Neutral | 2025-11-26 |
| Wells Fargo | Maintain | Overweight | 2025-11-26 |
| Barclays | Maintain | Overweight | 2025-11-26 |
| Keybanc | Maintain | Overweight | 2025-11-26 |
| Citigroup | Maintain | Neutral | 2025-11-26 |
| JP Morgan | Maintain | Overweight | 2025-11-26 |
| UBS | Maintain | Neutral | 2025-11-26 |
Workday’s grades consistently show a positive outlook, with multiple Overweight and Buy ratings and only a few Neutral assessments, indicating broad analyst confidence.
Strategy Inc Grades
This table presents the latest grades and actions from leading financial institutions on Strategy Inc:
| Grading Company | Action | New Grade | Date |
|---|---|---|---|
| Citigroup | Maintain | Buy | 2025-12-22 |
| Bernstein | Maintain | Outperform | 2025-12-08 |
| Monness, Crespi, Hardt | Upgrade | Neutral | 2025-11-10 |
| HC Wainwright & Co. | Maintain | Buy | 2025-11-03 |
| Canaccord Genuity | Maintain | Buy | 2025-11-03 |
| BTIG | Maintain | Buy | 2025-10-31 |
| TD Cowen | Maintain | Buy | 2025-10-31 |
| Cantor Fitzgerald | Maintain | Overweight | 2025-10-31 |
| Wells Fargo | Downgrade | Equal Weight | 2025-09-30 |
| TD Cowen | Maintain | Buy | 2025-09-16 |
Strategy Inc shows a strong buy-side consensus with many Buy and Outperform ratings, although a recent downgrade to Equal Weight by Wells Fargo introduces some caution.
Which company has the best grades?
Both Workday, Inc. and Strategy Inc have predominantly positive grades, but Workday shows a higher number of Overweight and Neutral ratings with fewer downgrades, suggesting more stable analyst sentiment. Strategy Inc’s good grades include multiple Buy ratings but also a notable downgrade, implying a slightly more mixed outlook. This difference may influence investors seeking steadier analyst confidence versus those considering potential upside with some risk.
Strengths and Weaknesses
Below is a comparative overview of Workday, Inc. (WDAY) and Strategy Inc (MSTR) highlighting their key strengths and weaknesses based on diversification, profitability, innovation, global presence, and market share.
| Criterion | Workday, Inc. (WDAY) | Strategy Inc (MSTR) |
|---|---|---|
| Diversification | Strong focus on subscription services (7.7B in 2025) with growing professional services (728M); limited product diversification but expanding in cloud software. | Revenue diversified across licenses (49M), maintenance (244M), subscriptions (107M), and tech services (64M); more balanced product mix but smaller scale. |
| Profitability | Net margin 6.23%, ROIC 2.73% but below WACC (8.86%), showing value destruction despite increasing profitability trend. | Negative net margin (-251.73%) and ROIC (-4.38%) well below WACC (16.81%); profitability is declining sharply, value destruction severe. |
| Innovation | Moderate innovation with growing ROIC trend (162% increase), but high P/E (132) and P/B (7.69) reflect market expectations for future growth. | Innovation seems limited with declining ROIC and poor financial ratios, though P/E is low due to negative earnings. |
| Global presence | Strong global footprint in cloud HR and finance software; subscription revenue growth supports international expansion. | More regional presence with modest revenues and limited growth, less global scale than WDAY. |
| Market Share | Leading position in cloud-based enterprise solutions, growing subscription base supports expanding market share. | Smaller market share with declining revenues in core license and maintenance segments. |
Key takeaways: Workday shows a solid growth trajectory with strong subscription revenue but struggles with profitability and high valuation. Strategy Inc faces significant financial challenges, including declining profitability and shrinking market presence, making it a riskier investment.
Risk Analysis
Below is a comparative table summarizing key risks for Workday, Inc. (WDAY) and Strategy Inc (MSTR) based on the most recent data.
| Metric | Workday, Inc. (WDAY) | Strategy Inc (MSTR) |
|---|---|---|
| Market Risk | Moderate (Beta: 1.14) | High (Beta: 3.43) |
| Debt level | Low (Debt/Equity: 0.37) | Moderate (Debt/Equity: 0.40) |
| Regulatory Risk | Moderate (Tech sector) | High (Crypto exposure) |
| Operational Risk | Moderate (Cloud software) | Moderate (AI & Crypto operations) |
| Environmental Risk | Low | Low |
| Geopolitical Risk | Moderate (Global clients) | Moderate (International crypto markets) |
The most impactful risks lie with Strategy Inc due to its high market volatility (beta 3.43) and significant regulatory uncertainty tied to its bitcoin treasury activities. Workday faces moderate market and regulatory risks typical of the enterprise software sector but benefits from a stronger financial position and lower leverage. Investors should carefully consider Strategy’s exposure to crypto market swings and regulatory changes, while Workday appears more stable but with less growth momentum.
Which Stock to Choose?
Workday, Inc. (WDAY) has shown favorable income growth with a 16.35% revenue rise in 2025 and a positive net margin of 6.23%. Its financial ratios are mixed, with favorable liquidity and debt metrics but unfavorable profitability ratios. The company carries moderate debt and holds a very favorable B- rating.
Strategy Inc (MSTR) experienced an unfavorable income evolution with declining revenue and negative net margin of -251.73% in 2024. Most financial ratios are unfavorable, despite a few favorable debt metrics. The company shows high financial risk and holds a very favorable A- rating, reflecting some strengths despite operational challenges.
For investors, the choice might depend on risk tolerance: those prioritizing stability and consistent income growth could find Workday’s profile more appealing, while risk-tolerant investors seeking potential turnaround opportunities might view Strategy Inc’s financials as suggestive of higher volatility but with rating strengths.
Disclaimer: Investment carries a risk of loss of initial capital. The past performance is not a reliable indicator of future results. Be sure to understand risks before making an investment decision.
Go Further
I encourage you to read the complete analyses of Workday, Inc. and Strategy Inc to enhance your investment decisions: