Home > Comparison > Technology > MSTR vs U
The strategic rivalry between Strategy Inc and Unity Software Inc. shapes the evolving landscape of the technology sector. Strategy Inc operates as a bitcoin treasury and AI-driven analytics provider, blending financial innovation with software solutions. Unity Software Inc. leads with an interactive real-time 3D content platform, targeting diverse digital creators. This analysis will evaluate which business model delivers a superior risk-adjusted return, crucial for portfolio diversification in a dynamic market environment.
Table of contents
Companies Overview
Strategy Inc and Unity Software Inc. drive innovation in distinct segments of the software application market. Their influence shapes evolving tech landscapes and investor focus.
Strategy Inc: Bitcoin Treasury and AI Analytics Leader
Strategy Inc dominates as a bitcoin treasury company while delivering AI-powered enterprise analytics software. Its revenue stems from offering securities tied to Bitcoin and selling advanced analytics tools like Strategy One and Strategy Mosaic. In 2025, the company sharpened its focus on integrating AI with data governance to enhance decision-making for non-technical users.
Unity Software Inc.: Real-Time 3D Content Platform Pioneer
Unity Software Inc. leads in interactive real-time 3D content platforms. It generates revenue by licensing software that empowers creators to build, run, and monetize 2D and 3D content across multiple devices. The company’s 2026 strategy emphasizes expanding global reach and enhancing platform capabilities for immersive experiences in gaming and augmented reality.
Strategic Collision: Similarities & Divergences
Both companies leverage software innovation but diverge sharply in business philosophy: Strategy Inc embraces financial products linked to Bitcoin and AI analytics, while Unity prioritizes an open platform for content creation and monetization. Their primary battleground is digital transformation, yet Strategy Inc appeals to investors seeking crypto exposure, whereas Unity targets growth in interactive media markets.
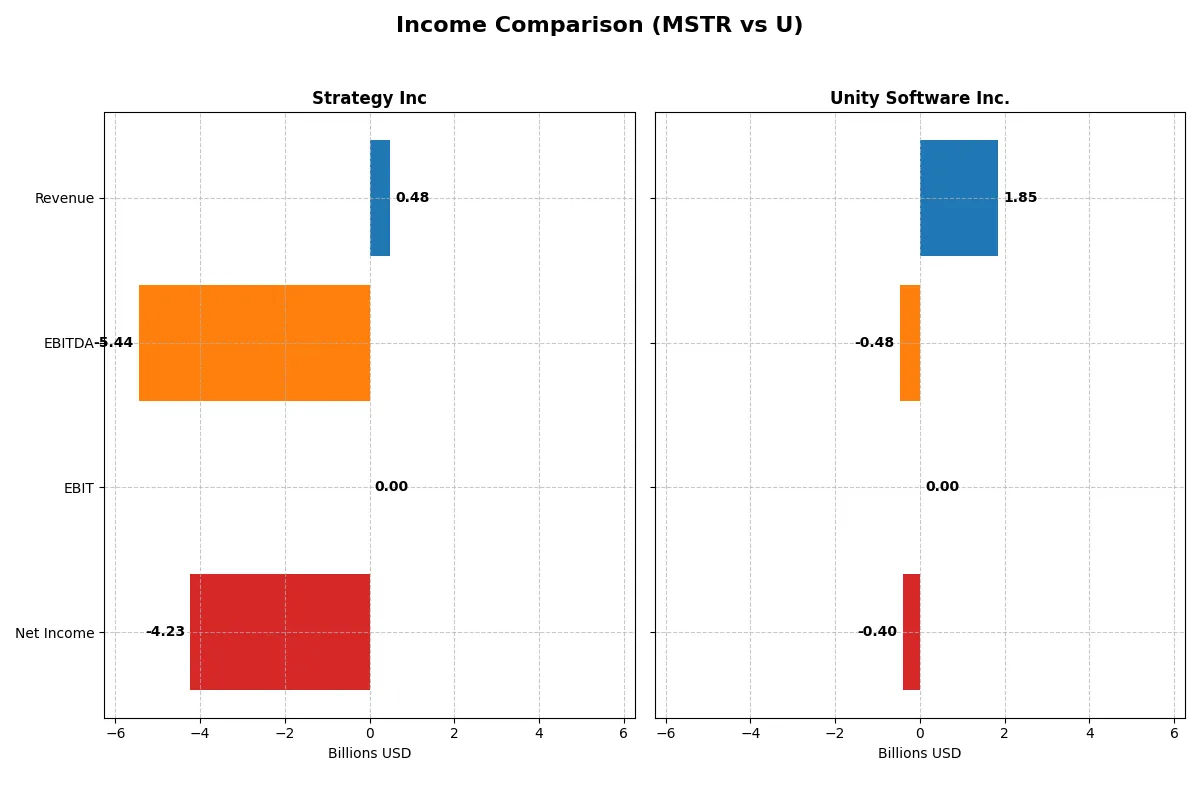
Income Statement Comparison
This data dissects the core profitability and scalability of both corporate engines to reveal who dominates the bottom line:
| Metric | Strategy Inc (MSTR) | Unity Software Inc. (U) |
|---|---|---|
| Revenue | 477M | 1.85B |
| Cost of Revenue | 149M | 478M |
| Operating Expenses | 5.62B | 1.85B |
| Gross Profit | 328M | 1.37B |
| EBITDA | -5.44B | -479M |
| EBIT | 0 | 0 |
| Interest Expense | 65M | 24M |
| Net Income | -4.23B | -403M |
| EPS | -15.23 | -0.96 |
| Fiscal Year | 2025 | 2025 |
Income Statement Analysis: The Bottom-Line Duel
This income statement comparison reveals how efficiently each company converts revenue into profit, spotlighting their operational strengths and weaknesses.
Strategy Inc Analysis
Strategy Inc’s revenue slightly declined from 510M in 2021 to 477M in 2025, with net income swinging from a 535M loss in 2021 to a 4.2B loss in 2025. Its gross margin remains strong near 69%, but net margin collapses to -886%, reflecting ballooning expenses and other losses. The 2025 figures show deteriorating profitability despite stable top-line trends.
Unity Software Inc. Analysis
Unity Software’s revenue grew robustly from 1.1B in 2021 to 1.85B in 2025, with net losses narrowing from 533M to 403M. Its gross margin improved to 74%, signaling solid cost control. Although still unprofitable, Unity shows positive momentum with gains in net margin and EPS growth over the period, suggesting operational improvements.
Margin Resilience vs. Growth Recovery
Strategy Inc struggles with deepening net losses despite steady revenue and healthy gross margins, indicating poor expense management. Unity Software outperforms with strong revenue growth and improving margins, reducing losses steadily. For investors, Unity’s trajectory suggests a better risk-reward profile, while Strategy’s widening losses highlight fundamental challenges.
Financial Ratios Comparison
These vital ratios act as a diagnostic tool to expose the underlying fiscal health, valuation premiums, and capital efficiency of the companies compared below:
| Ratios | Strategy Inc (MSTR) | Unity Software Inc. (U) |
|---|---|---|
| ROE | -8.29% | -12.44% |
| ROIC | -6.19% | -8.16% |
| P/E | -9.98 | -46.16 |
| P/B | 0.83 | 5.74 |
| Current Ratio | 5.62 | 1.84 |
| Quick Ratio | 5.62 | 1.84 |
| D/E | 0.16 | 0.69 |
| Debt-to-Assets | 13.44% | 32.69% |
| Interest Coverage | 83.80 | 19.95 |
| Asset Turnover | 0.008 | 0.27 |
| Fixed Asset Turnover | 6.29 | 27.09 |
| Payout ratio | 0 | 0 |
| Dividend yield | 0 | 0 |
| Fiscal Year | 2025 | 2025 |
Efficiency & Valuation Duel: The Vital Signs
Ratios serve as a company’s DNA, exposing underlying risks and operational strengths critical for investment decisions.
Strategy Inc
Strategy Inc posts negative core profitability, with ROE at -8.3% and net margin deeply unfavorable at -886%. Despite this, valuation appears attractive, with a favorable P/E of -10 and a low P/B of 0.83, suggesting the stock is undervalued. The firm does not pay dividends, focusing instead on reinvesting heavily in R&D and growth initiatives.
Unity Software Inc.
Unity Software Inc. also suffers from weak profitability, with ROE at -12.4% and net margin at -21.8%. Its valuation is mixed: P/E is favorable at -46, yet P/B is stretched at 5.74, indicating possible overvaluation. Unity maintains a solid current ratio of 1.84 but lacks dividends, channeling cash flow towards R&D and operational expansion.
Valuation Appeal Meets Profitability Challenges
Both companies struggle with profitability and return metrics, facing unfavorable operating conditions. Strategy Inc offers a more compelling valuation relative to its fundamentals, while Unity’s stronger liquidity contrasts with its lofty price-to-book. Investors seeking value might lean towards Strategy Inc, whereas those prioritizing operational stability may prefer Unity’s profile.
Which one offers the Superior Shareholder Reward?
I compare Strategy Inc (MSTR) and Unity Software Inc. (U) on distribution philosophies, dividend yields, payout ratios, and buybacks. Neither pays dividends, focusing on reinvestment and buybacks. MSTR lacks buybacks, with zero dividend yield and payout ratio. U also pays no dividends but shows active buybacks, supporting free cash flow coverage near 96%. MSTR’s negative margins and zero free cash flow undermine sustainability. U’s positive free cash flow per share (0.96) and modest capex (0.05) signal a healthier buyback capacity. I conclude Unity Software Inc. offers superior total shareholder reward through sustainable buybacks and reinvestment in 2026.
Comparative Score Analysis: The Strategic Profile
The radar chart reveals the fundamental DNA and trade-offs of Strategy Inc and Unity Software Inc., highlighting their distinct financial strengths and weaknesses:
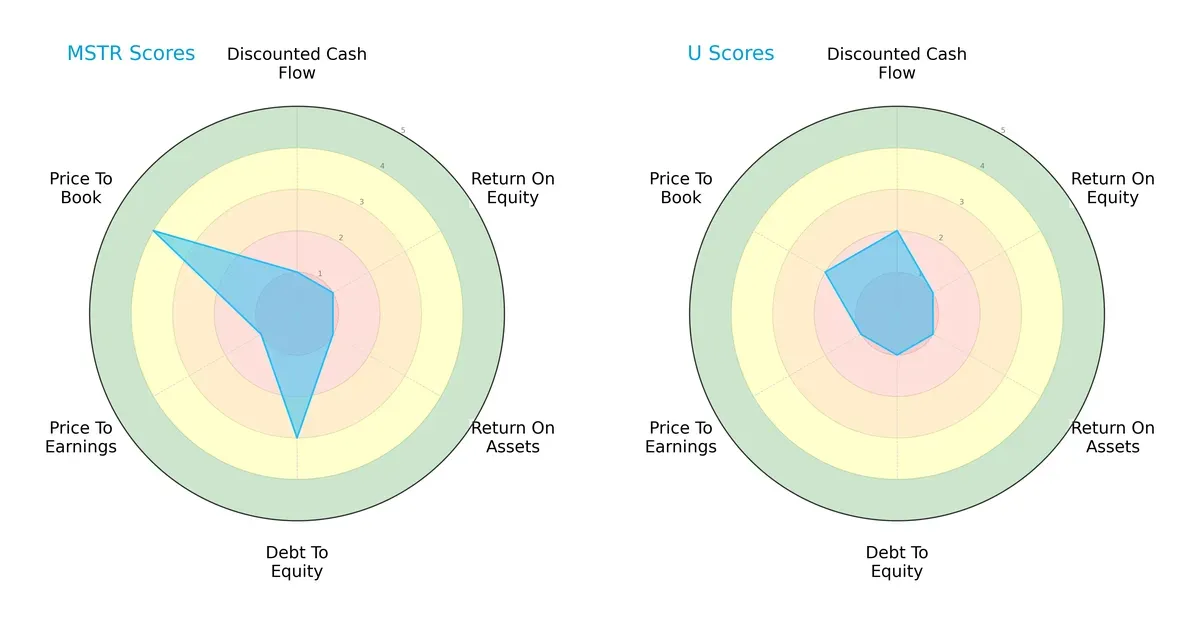
Strategy Inc shows a more balanced profile with moderate debt management and favorable price-to-book valuation. Unity Software Inc relies heavily on discounted cash flow strength but struggles with debt and valuation metrics. Both firms display weak returns on equity and assets, indicating operational challenges.
Bankruptcy Risk: Solvency Showdown
Strategy Inc’s Altman Z-Score of 2.08 places it in the grey zone, signaling moderate bankruptcy risk. Unity Software Inc’s 1.05 score lands it in distress, suggesting higher long-term survival risk:

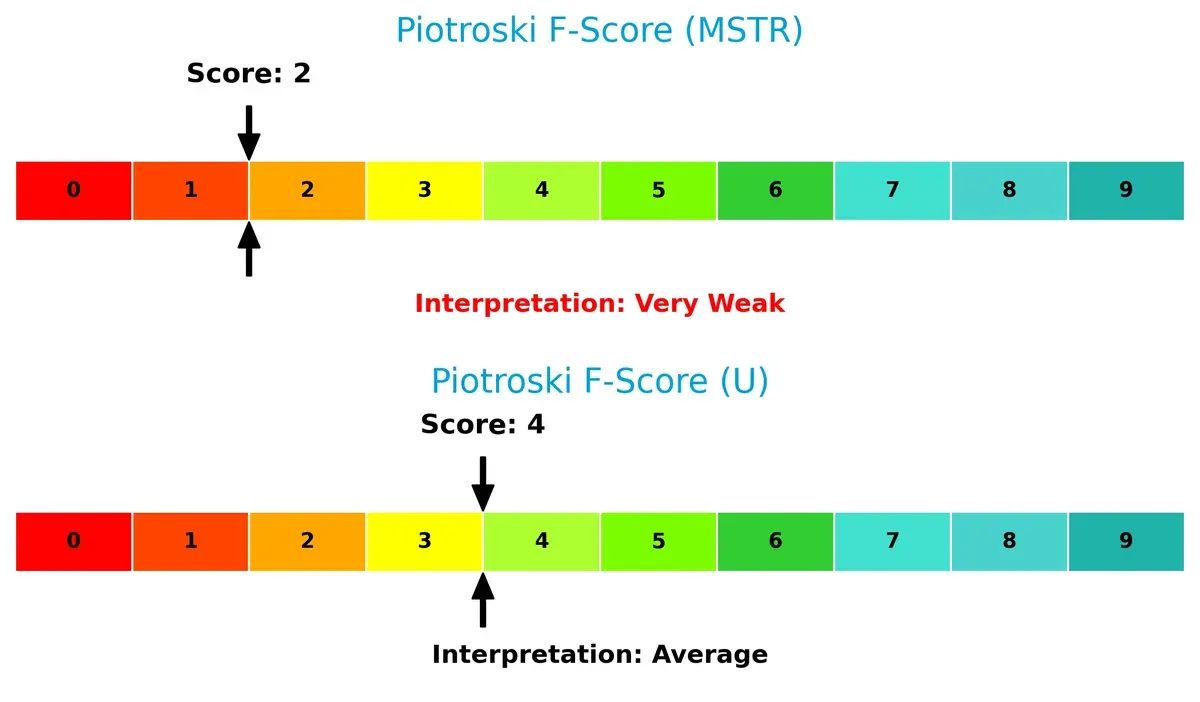
Financial Health: Quality of Operations
Unity Software Inc’s Piotroski Score of 4 outperforms Strategy Inc’s weak score of 2, indicating healthier internal financial metrics and fewer red flags for Unity:
How are the two companies positioned?
This section dissects the operational DNA of Strategy Inc and Unity Software by comparing their revenue distribution and internal strengths and weaknesses. The goal is to confront their economic moats to identify which business model offers the most resilient, sustainable competitive advantage today.
Revenue Segmentation: The Strategic Mix
This visual comparison dissects how Strategy Inc and Unity Software Inc. diversify their income streams and where their primary sector bets lie:
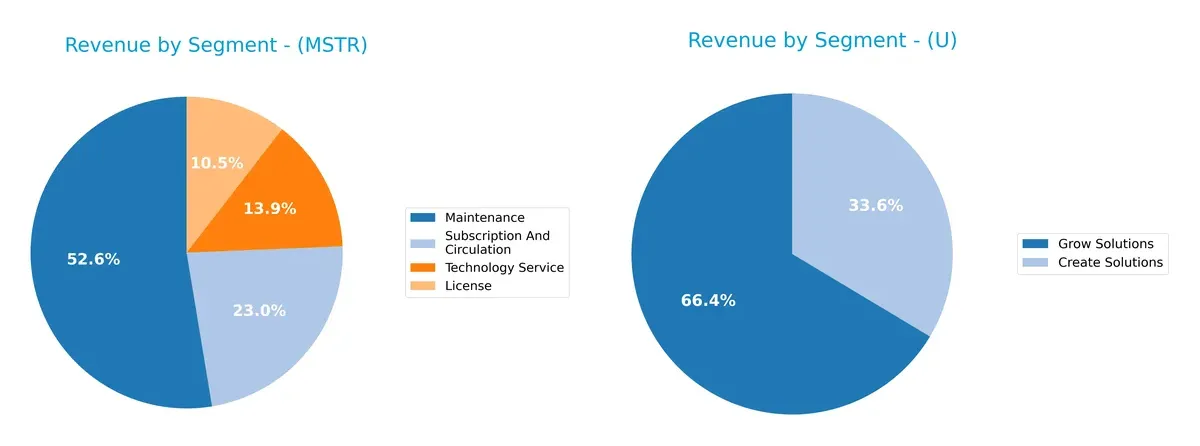
Strategy Inc leans heavily on Maintenance, anchoring revenue at $244M in 2024, with smaller contributions from Subscription ($107M) and Technology Service ($64M). Unity Software Inc. splits revenue more evenly between Create Solutions ($613M) and Operate Solutions ($1.2B), showing a more balanced mix. Strategy Inc’s concentration in Maintenance risks dependency, while Unity’s diversified model supports ecosystem lock-in and infrastructure dominance.
Strengths and Weaknesses Comparison
This table compares the strengths and weaknesses of Strategy Inc and Unity Software Inc based on diversification, profitability, financials, innovation, global presence, and market share:
Strategy Inc Strengths
- Diverse revenue streams across License, Maintenance, Subscription, and Technology Services
- Strong fixed asset turnover at 6.29
- Low debt-to-assets ratio at 13.44%
- High current and quick ratios highlight liquidity
Unity Software Inc. Strengths
- Large revenue base with Create and Grow/Operate Solutions
- Exceptional fixed asset turnover at 27.09
- Favorable current and quick ratios at 1.84
- Broad geographic reach including Asia Pacific and Greater China
Strategy Inc Weaknesses
- Negative net margin (-886%) and ROE (-8.29%) indicate poor profitability
- High WACC at 17% undermines capital efficiency
- Very low asset turnover at 0.01
- Negative interest coverage and zero dividend yield
- High current ratio flagged as unfavorable (5.62)
Unity Software Inc. Weaknesses
- Negative net margin (-21.78%) and ROE (-12.44%) reflect losses
- Elevated WACC at 11.27% limits returns
- Negative interest coverage and zero dividend yield
- High PB ratio at 5.74 suggests overvaluation
- Moderate debt metrics with neutral ratings
The assessment reveals both companies struggle with profitability and capital efficiency, despite solid liquidity and asset utilization. Strategy Inc shows stronger balance sheet conservatism, while Unity’s innovation and geographic diversification may support growth but come with valuation and leverage concerns. These factors shape their strategic options and risk profiles.
The Moat Duel: Analyzing Competitive Defensibility
A structural moat is the only true barrier protecting long-term profits from relentless competition erosion. Let’s dissect the core moats of these two tech firms:
Strategy Inc: Intangible Assets Driving AI-Powered Insights
Strategy Inc’s moat centers on proprietary AI analytics software and bitcoin treasury integration. This niche delivers stable gross margins near 69%. However, its negative net margin signals financial strain. The 2026 outlook hinges on expanding AI offerings and crypto exposure amid volatile markets.
Unity Software Inc.: Network Effects Fueling Real-Time 3D Platforms
Unity’s competitive edge lies in powerful network effects within its interactive content platform. It sustains superior gross margins above 74% and shows accelerating revenue growth. Despite current losses, growing profitability and geographic expansion across Asia-Pacific and EMEA could deepen its moat in 2026.
The Moat Battle: Intangible Assets vs. Network Effects
Both companies destroy value currently, but I see Unity’s growing ROIC and strong network effects as a wider moat than Strategy’s intangible assets. Unity is better positioned to defend and expand market share amid intensifying competition.
Which stock offers better returns?
The past year saw both Strategy Inc and Unity Software Inc. experience sharp declines, with notable lows contrasting their earlier highs and increasing trading volumes reflecting intensifying market activity.
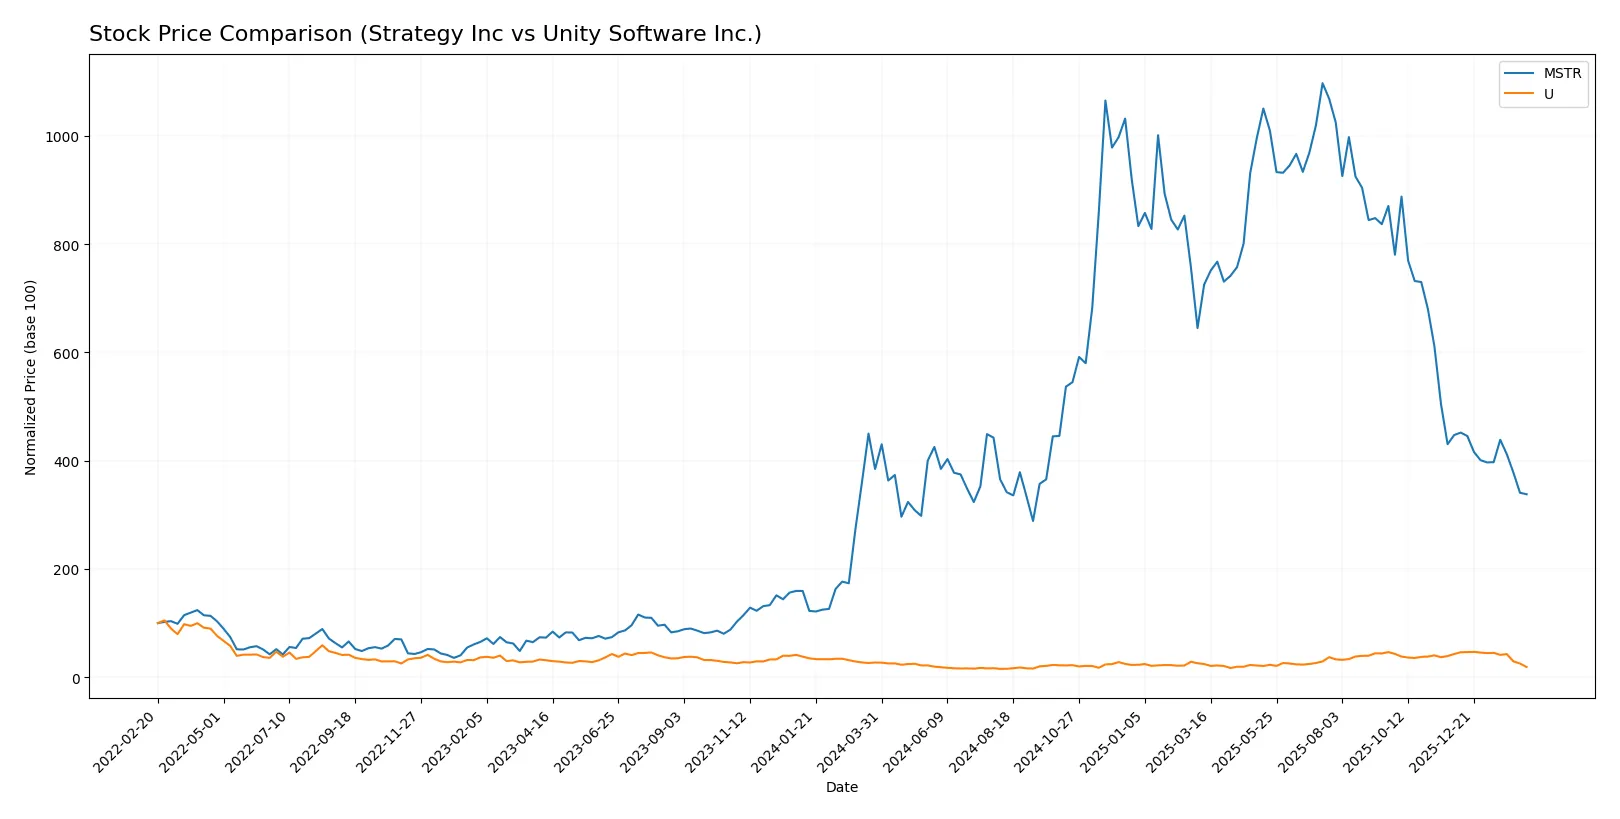
Trend Comparison
Strategy Inc’s stock fell 12.09% over the past year, marking a bearish trend with decelerating losses. The price volatility is high, with a wide range between 114.3 and 434.58.
Unity Software Inc. declined 30.79% over the same period, also bearish with decelerating downside momentum. Volatility is lower than Strategy Inc., ranging between 15.32 and 46.42.
Comparing both, Strategy Inc delivered a smaller loss and higher price stability, outperforming Unity Software Inc. in market performance over the past year.
Target Prices
Analysts present a wide range of target prices, indicating varied sentiment but generally optimistic outlooks.
| Company | Target Low | Target High | Consensus |
|---|---|---|---|
| Strategy Inc | 175 | 705 | 374.5 |
| Unity Software Inc. | 26 | 60 | 37.7 |
The consensus targets for Strategy Inc and Unity Software Inc. exceed their current prices of $133.88 and $18.68, suggesting analysts expect significant upside potential.

Don’t Let Luck Decide Your Entry Point
Optimize your entry points with our advanced ProRealTime indicators. You’ll get efficient buy signals with precise price targets for maximum performance. Start outperforming now!
How do institutions grade them?
Strategy Inc Grades
The following table summarizes recent institutional grades for Strategy Inc:
| Grading Company | Action | New Grade | Date |
|---|---|---|---|
| Cantor Fitzgerald | Maintain | Overweight | 2026-02-09 |
| BTIG | Maintain | Buy | 2026-02-06 |
| Canaccord Genuity | Maintain | Buy | 2026-02-04 |
| Mizuho | Maintain | Outperform | 2026-01-16 |
| TD Cowen | Maintain | Buy | 2026-01-15 |
| Citigroup | Maintain | Buy | 2025-12-22 |
| Bernstein | Maintain | Outperform | 2025-12-08 |
| Monness, Crespi, Hardt | Upgrade | Neutral | 2025-11-10 |
| Canaccord Genuity | Maintain | Buy | 2025-11-03 |
| HC Wainwright & Co. | Maintain | Buy | 2025-11-03 |
Unity Software Inc. Grades
The following table summarizes recent institutional grades for Unity Software Inc.:
| Grading Company | Action | New Grade | Date |
|---|---|---|---|
| Goldman Sachs | Maintain | Neutral | 2026-02-12 |
| BTIG | Maintain | Buy | 2026-02-12 |
| Needham | Maintain | Buy | 2026-02-12 |
| Wells Fargo | Maintain | Overweight | 2026-02-12 |
| Wedbush | Maintain | Outperform | 2026-02-12 |
| Macquarie | Maintain | Outperform | 2026-02-12 |
| UBS | Maintain | Neutral | 2026-02-12 |
| Citigroup | Maintain | Buy | 2026-02-12 |
| Barclays | Maintain | Equal Weight | 2026-02-12 |
| Citizens | Maintain | Market Outperform | 2026-02-12 |
Which company has the best grades?
Unity Software Inc. shows a broader range of strong buy-side grades including Outperform and Market Outperform. Strategy Inc. also has multiple Buy and Outperform ratings but fewer top-tier designations. Unity’s stronger consensus may influence investor confidence positively.
Risks specific to each company
The following categories identify the critical pressure points and systemic threats facing both firms in the 2026 market environment:
1. Market & Competition
Strategy Inc
- High beta (3.54) indicates significant market sensitivity and volatility risk in the competitive bitcoin treasury and AI analytics space.
Unity Software Inc.
- Lower beta (2.09) suggests less volatility but still exposed to intense competition in interactive 3D content platforms.
2. Capital Structure & Debt
Strategy Inc
- Low debt-to-equity (0.16) signals conservative leverage; however, negative interest coverage is a red flag for debt servicing.
Unity Software Inc.
- Moderate debt-to-equity (0.69) increases financial risk, compounded by negative interest coverage, indicating strained ability to cover debt costs.
3. Stock Volatility
Strategy Inc
- Wide price range ($104-$457) and high beta show extreme stock price swings, elevating investment risk.
Unity Software Inc.
- Narrower price range ($15-$52) and lower beta suggest relatively more stable stock price behavior.
4. Regulatory & Legal
Strategy Inc
- Bitcoin treasury business faces evolving regulatory scrutiny globally, posing compliance and operational risks.
Unity Software Inc.
- Operates in multiple jurisdictions with potential data privacy, content regulation, and IP risks affecting operations.
5. Supply Chain & Operations
Strategy Inc
- AI software operations depend on data integrity and technological infrastructure, vulnerable to disruptions.
Unity Software Inc.
- Relies on global platforms and partners; supply chain risks include software compatibility and platform dependency.
6. ESG & Climate Transition
Strategy Inc
- Exposure to ESG risks from energy-intensive bitcoin holdings and corporate governance challenges.
Unity Software Inc.
- Faces pressure to improve sustainability and social governance standards in tech development and data centers.
7. Geopolitical Exposure
Strategy Inc
- International bitcoin and analytics operations expose it to cross-border regulatory and geopolitical tensions.
Unity Software Inc.
- Global footprint in diverse markets subjects it to geopolitical risks impacting sales and regulatory costs.
Which company shows a better risk-adjusted profile?
Strategy Inc’s biggest risk stems from extreme stock volatility and regulatory pressures on its bitcoin treasury model. Unity Software’s critical threat lies in its elevated financial leverage and weaker debt coverage. Despite both facing unfavorable financial ratios, Strategy Inc’s conservative capital structure and higher liquidity offer a marginally better risk-adjusted profile. Notably, Strategy Inc’s Altman Z-score in the grey zone contrasts with Unity’s distress zone, underscoring greater bankruptcy risk for Unity.
Final Verdict: Which stock to choose?
Strategy Inc (MSTR) stands out for its exceptional liquidity cushion, reflecting a strong cash buffer that supports operational flexibility. Its main point of vigilance is the persistent value destruction indicated by negative ROIC versus WACC, signaling caution. This stock suits an aggressive growth portfolio willing to tolerate volatility for potential turnaround gains.
Unity Software Inc. (U) leverages a strategic moat anchored in its cloud software niche, emphasizing recurring revenue streams that add resilience. Compared to MSTR, Unity offers better balance sheet stability and a more consistent growth trajectory. It fits well in a GARP portfolio aiming for growth tempered by reasonable valuation discipline.
If you prioritize operational cash strength and a high-risk, high-reward growth angle, Strategy Inc might be the compelling choice due to its strong liquidity and improving profitability trend. However, if you seek a stock with a clearer strategic moat and better financial stability, Unity Software offers better stability and a more consistent income growth profile. Both carry risks, but their investor appeal hinges on distinct strategic priorities.
Disclaimer: Investment carries a risk of loss of initial capital. The past performance is not a reliable indicator of future results. Be sure to understand risks before making an investment decision.
Go Further
I encourage you to read the complete analyses of Strategy Inc and Unity Software Inc. to enhance your investment decisions: