Home > Comparison > Technology > UBER vs MSTR
The strategic rivalry between Uber Technologies, Inc. and Strategy Inc defines the evolving landscape of the technology sector. Uber operates as a capital-intensive platform connecting consumers with mobility and delivery services globally. In contrast, Strategy Inc focuses on bitcoin treasury management and AI-driven enterprise analytics, representing a niche, high-volatility model. This analysis will determine which trajectory offers superior risk-adjusted returns for a diversified portfolio amid technological disruption.

Table of contents
Companies Overview
Uber Technologies and Strategy Inc dominate distinct niches within the technology software sector.
Uber Technologies, Inc.: Global Mobility & Delivery Leader
Uber commands the ride-sharing and delivery market by connecting consumers with independent drivers and service providers worldwide. Its revenue stems from three segments: Mobility, Delivery, and Freight, leveraging proprietary technology applications. In 2026, Uber strategically focuses on expanding its multimodal transportation ecosystem and enhancing logistics efficiency across continents.
Strategy Inc: Bitcoin Treasury & AI Analytics Pioneer
Strategy Inc specializes in bitcoin treasury management and AI-driven enterprise analytics. The company generates revenue by offering investors access to Bitcoin exposure through equity and fixed income instruments while providing advanced AI software for decision-making. In 2026, its strategic emphasis lies in expanding AI analytics capabilities and integrating blockchain assets into corporate finance.
Strategic Collision: Similarities & Divergences
Both companies operate in the technology software industry but pursue radically different business models—Uber leans on platform-based physical mobility services, while Strategy Inc blends digital asset management with AI analytics. Their competition unfolds in investor attention and technology innovation, targeting distinct market segments. Their investment profiles diverge sharply: Uber offers scale and global reach, whereas Strategy Inc bets on niche fintech and AI growth.
Income Statement Comparison
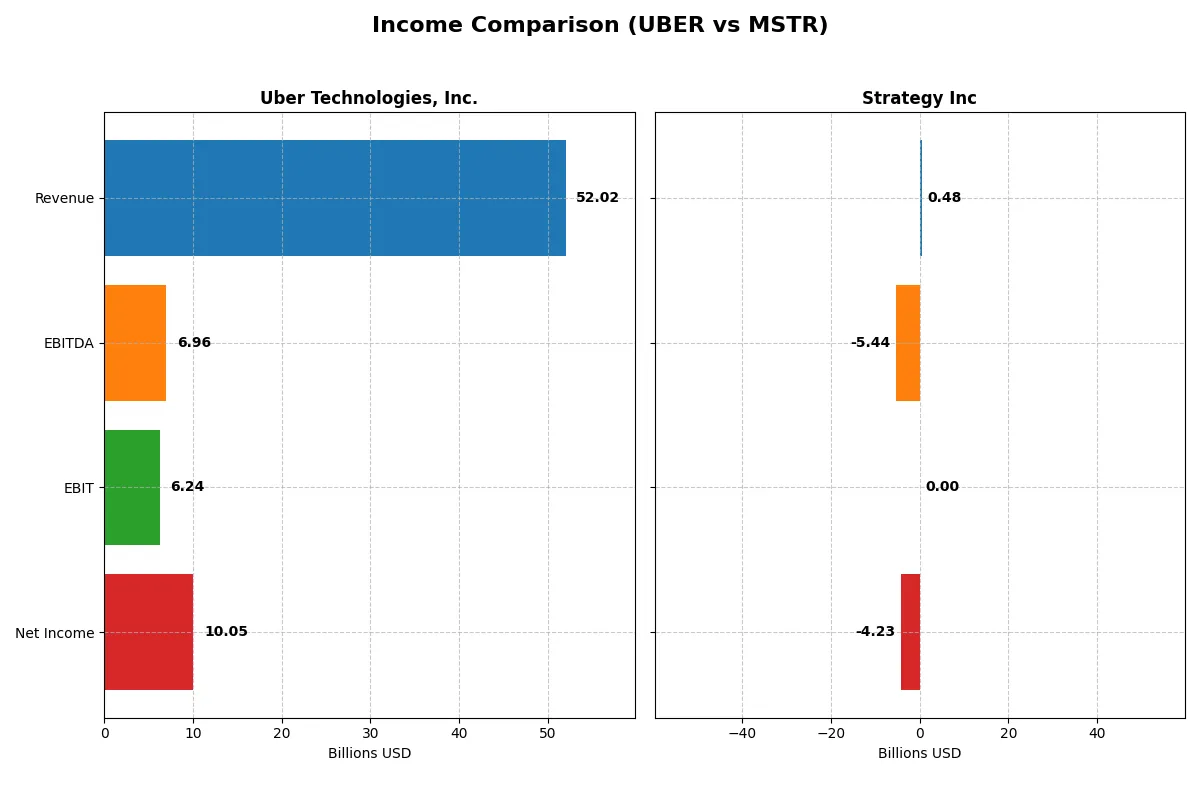
This table dissects the core profitability and scalability of both corporate engines to reveal who dominates the bottom line:
| Metric | Uber Technologies, Inc. (UBER) | Strategy Inc (MSTR) |
|---|---|---|
| Revenue | 52B | 477M |
| Cost of Revenue | 31.3B | 149M |
| Operating Expenses | 15.1B | 5.6B |
| Gross Profit | 20.7B | 328M |
| EBITDA | 7B | -5.4B |
| EBIT | 6.2B | 0 |
| Interest Expense | 440M | 65M |
| Net Income | 10B | -4.2B |
| EPS | 4.82 | -15.23 |
| Fiscal Year | 2025 | 2025 |
Income Statement Analysis: The Bottom-Line Duel
This income statement comparison reveals which company runs a more efficient and profitable business engine through their financial performance.
Uber Technologies, Inc. Analysis
Uber’s revenue surged from 17.5B in 2021 to 52B in 2025, with net income rising from a loss to 10B. Gross margin stabilizes near 40%, while net margin reached a healthy 19% in 2025. The company shows strong momentum, with EBITDA and EBIT expanding sharply, signaling improving operational efficiency and scale benefits.
Strategy Inc Analysis
Strategy Inc’s revenue remained flat around 460-510M from 2021 to 2025 but plunged to a massive net loss of 4.2B in 2025. Despite a high gross margin near 69%, the company suffers from crushing operating expenses and an unfavorable net margin of -886%. Recent years show deteriorating profitability and negative EPS growth, reflecting severe operational challenges.
Margin Strength vs. Profitability Scale
Uber dominates with robust revenue growth and positive net income, highlighting operational scaling and margin improvement. Strategy Inc’s impressive gross margins cannot offset soaring costs and steep net losses. For investors prioritizing solid profits and efficiency, Uber’s profile offers a clearer path to sustainable returns.
Financial Ratios Comparison
These vital ratios act as a diagnostic tool to expose the underlying fiscal health, valuation premiums, and capital efficiency of the companies compared below:
| Ratios | Uber Technologies, Inc. (UBER) | Strategy Inc (MSTR) |
|---|---|---|
| ROE | 37.18% | -8.29% |
| ROIC | 11.21% | -6.19% |
| P/E | 16.85 | -9.98 |
| P/B | 6.27 | 0.83 |
| Current Ratio | 1.14 | 5.62 |
| Quick Ratio | 1.14 | 5.62 |
| D/E | 0.50 | 0.16 |
| Debt-to-Assets | 21.80% | 13.44% |
| Interest Coverage | 12.65 | 83.80 |
| Asset Turnover | 0.84 | 0.01 |
| Fixed Asset Turnover | 17.28 | 6.29 |
| Payout ratio | 0 | 0 |
| Dividend yield | 0% | 0% |
| Fiscal Year | 2025 | 2025 |
Efficiency & Valuation Duel: The Vital Signs
Financial ratios act as the company’s DNA, uncovering hidden risks and operational strengths that drive shareholder value and market positioning.
Uber Technologies, Inc.
Uber demonstrates robust profitability with a 37.18% ROE and a healthy 19.33% net margin, signaling operational excellence. The valuation appears reasonable with a P/E of 16.85, though the price-to-book ratio suggests some premium. Uber does not pay dividends but channels cash flow into growth and R&D, enhancing long-term value creation.
Strategy Inc
Strategy Inc struggles with negative profitability metrics, including an -8.29% ROE and a severely negative net margin at -886.26%. The stock shows a low P/B of 0.83 and a negative P/E, reflecting valuation distress. High current ratio contrasts weak operational efficiency. Absence of dividends aligns with reinvestment in restructuring or turnaround efforts.
Balanced Profitability vs. Value Distress
Uber offers superior operational efficiency and a balanced valuation, presenting a clearer path to sustainable returns. Strategy Inc’s metrics reveal significant risks with weak profitability and stretched valuation signals. Investors prioritizing stable growth should gravitate toward Uber, while risk-tolerant profiles may consider Strategy Inc’s turnaround potential.
Which one offers the Superior Shareholder Reward?
Uber Technologies, Inc. (UBER) opts for zero dividends but consistently generates robust free cash flow (~4.7/share in 2025). It leverages this to fund aggressive share buybacks, supporting a PE of ~17 and a sustainable payout. Strategy Inc (MSTR) also pays no dividend and suffers negative free cash flow with heavy operating losses and volatile margins, despite a low price-to-book near 0.83. MSTR’s weak cash conversion and high leverage raise sustainability concerns. I find Uber’s disciplined capital allocation and strong cash generation deliver a superior total return profile for 2026 investors.
Comparative Score Analysis: The Strategic Profile
The radar chart reveals the fundamental DNA and strategic trade-offs of Uber Technologies, Inc. and Strategy Inc, highlighting their financial strengths and weaknesses:
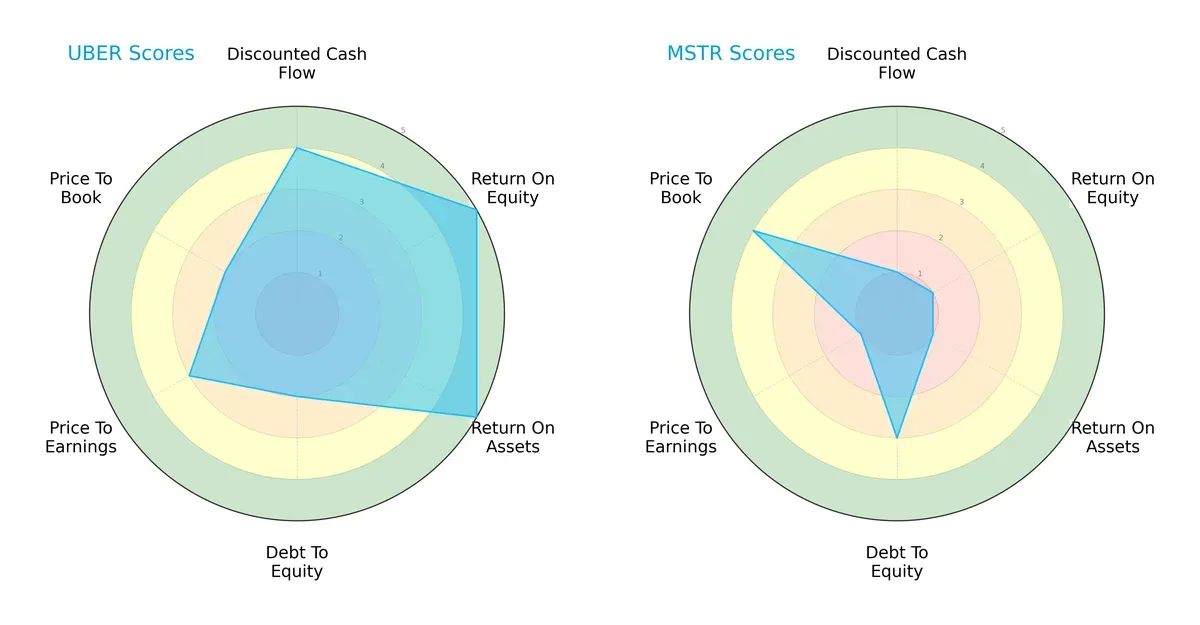
Uber delivers a balanced profile with strong returns on equity (5) and assets (5), supported by solid discounted cash flow (4). However, its debt-to-equity (2) and price-to-book (2) scores reflect financial leverage risks and valuation concerns. Strategy Inc relies heavily on its price-to-book advantage (4) but shows severe weakness in profitability and cash flow metrics, with all scores at 1 except debt-to-equity (3). Uber’s diversified strengths position it better for stability, while Strategy Inc depends narrowly on valuation appeal.
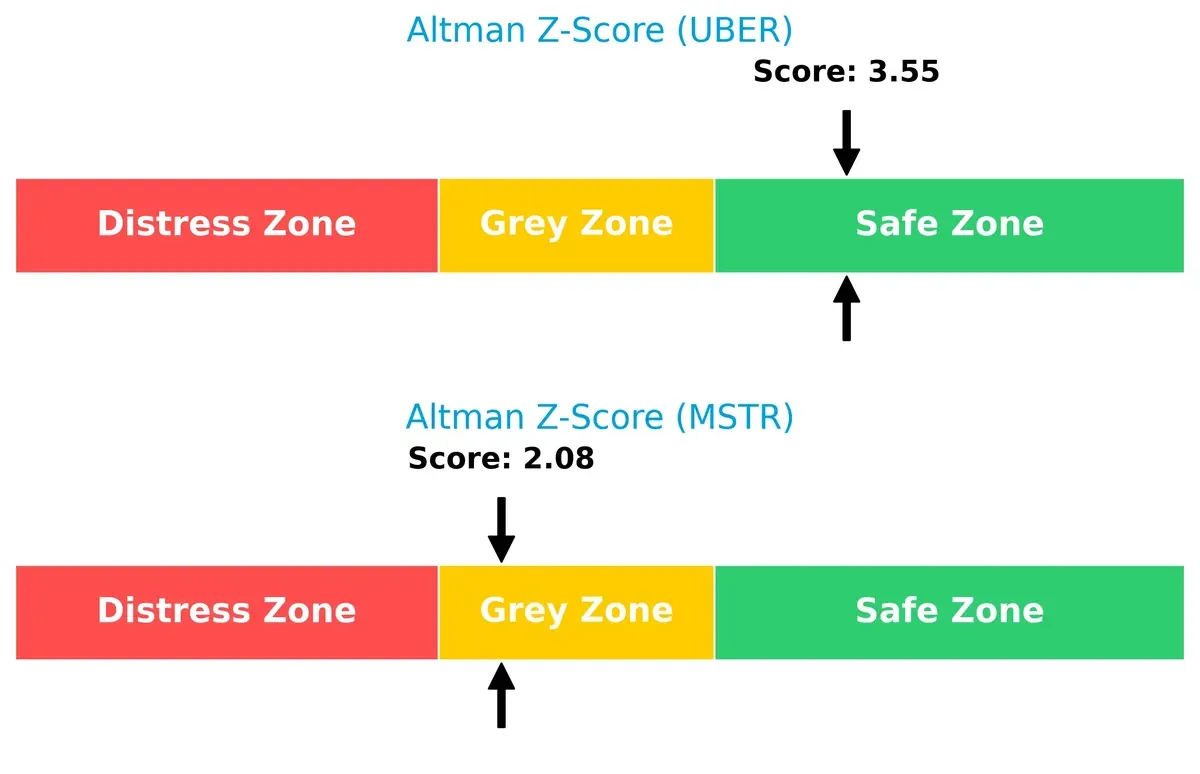
Bankruptcy Risk: Solvency Showdown
Uber’s Altman Z-Score of 3.55 places it firmly in the safe zone, indicating low bankruptcy risk. Strategy Inc’s 2.08 score situates it in the grey zone, signaling moderate financial distress and higher survival risk in volatile markets:
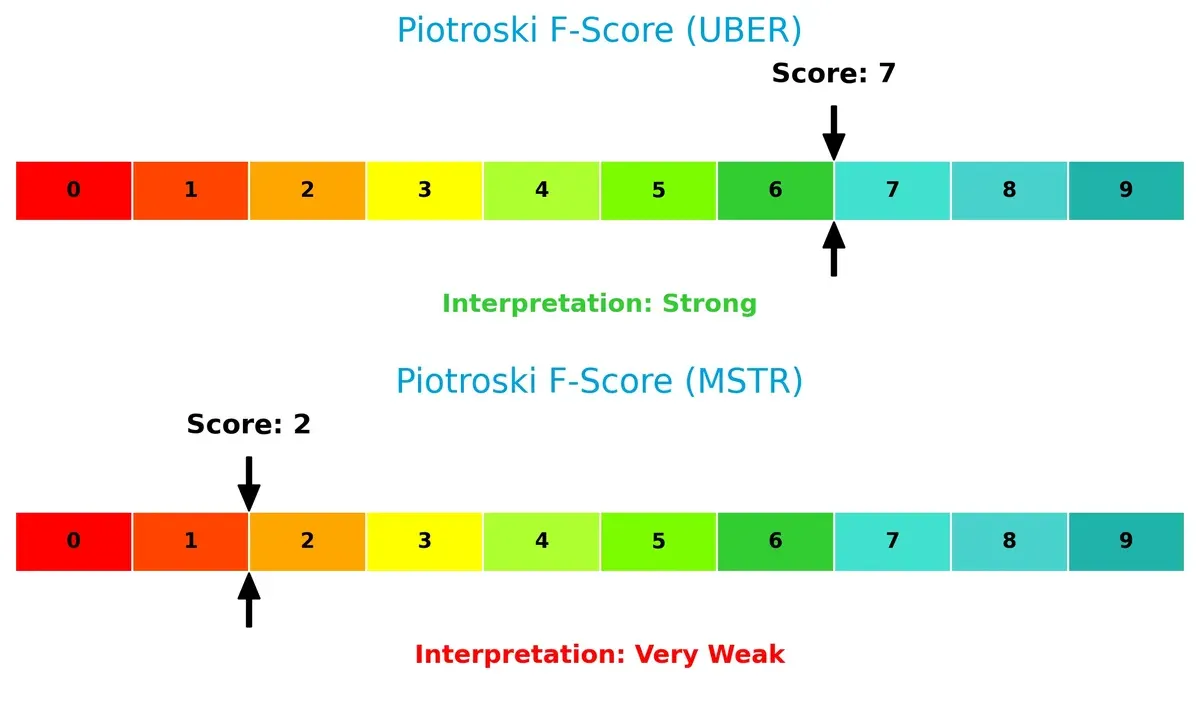
Financial Health: Quality of Operations
Uber’s Piotroski F-Score of 7 reflects strong financial health and operational quality. In contrast, Strategy Inc’s score of 2 raises red flags about its internal financial stability and efficiency:
How are the two companies positioned?
This section dissects the operational DNA of Uber and Strategy Inc by comparing their revenue distribution by segment alongside their core strengths and weaknesses. The ultimate goal is to confront their economic moats to reveal which model delivers the most resilient, sustainable competitive advantage today.
Revenue Segmentation: The Strategic Mix
This visual comparison dissects how Uber Technologies, Inc. and Strategy Inc diversify their income streams and where their primary sector bets lie:
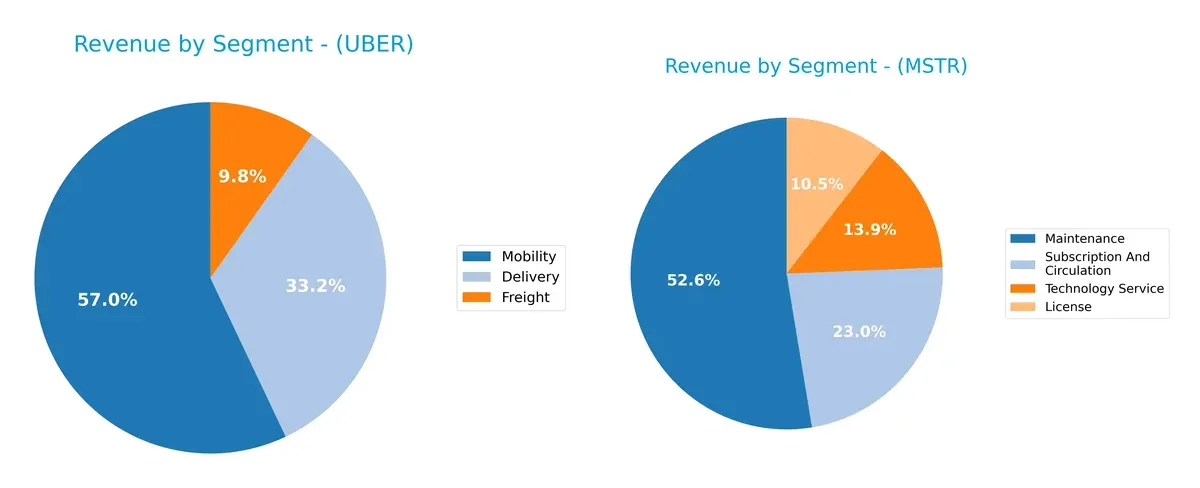
Uber’s revenue pivots heavily on Mobility, generating $29.7B in 2025, dwarfs its Delivery ($17.2B) and Freight ($5.1B) segments. This concentration anchors Uber’s ecosystem dominance but raises concentration risk. In contrast, Strategy Inc shows a more balanced mix with Maintenance leading at $244M, but License, Subscription, and Technology Services each contribute significantly, reflecting a steady, diversified revenue base with reduced risk exposure.
Strengths and Weaknesses Comparison
This table compares the Strengths and Weaknesses of Uber and Strategy Inc based on diversification, profitability, financials, innovation, global presence, and market share:
Uber Strengths
- Diverse revenue streams across Mobility, Delivery, and Freight
- Strong profitability metrics: 19.33% net margin, 37.18% ROE
- Favorable debt management with 0.5 debt-to-equity
- Global presence with significant revenues in US, EMEA, Asia Pacific
- High fixed asset turnover at 17.28
- Quick ratio at 1.14 indicating good liquidity
Strategy Inc Strengths
- Favorable price-to-book at 0.83
- Low debt-to-equity at 0.16 and debt-to-assets at 13.44%
- Quick ratio strong at 5.62, signaling liquidity
- Favorable fixed asset turnover at 6.29
- Positive valuation metric (PE) despite negative earnings
- Presence in North America and EMEA markets
Uber Weaknesses
- Unfavorable price-to-book at 6.27 suggests overvaluation risk
- Neutral current ratio at 1.14 may limit short-term flexibility
- No dividend yield
- Neutral weighted average cost of capital (WACC) at 8.78%
- Asset turnover at 0.84 is only neutral
- High exposure to competitive delivery and mobility sectors
Strategy Inc Weaknesses
- Negative profitability with -886.26% net margin and -8.29% ROE
- Unfavorable WACC at 17% raises capital cost concerns
- Negative interest coverage ratio
- Very low asset turnover at 0.01 indicates poor asset utilization
- Neutral dividend yield at zero
- High proportion of unfavorable financial ratios (57.14%)
Uber’s strengths lie in diversified revenue and solid profitability with global scale, but valuation and liquidity aspects warrant attention. Strategy Inc faces significant profitability and efficiency challenges despite strong liquidity and conservative leverage, indicating strategic focus areas for improvement.
The Moat Duel: Analyzing Competitive Defensibility
A structural moat protects long-term profits from relentless competition erosion. Without it, gains quickly vanish into commoditization pressures:
Uber Technologies, Inc.: Network Effects Powerhouse
Uber’s primary moat stems from powerful network effects connecting millions of riders and drivers globally. This scale drives stable margins and a rising ROIC exceeding WACC by 2.4%. Expansion into freight and delivery deepens this moat in 2026, reinforcing dominance in mobility ecosystems.
Strategy Inc: Intangible Assets with Volatile Profitability
Strategy Inc’s moat relies heavily on intangible assets like proprietary AI analytics and bitcoin treasury exposure. Unlike Uber, it struggles with negative net margins and ROIC well below WACC, signaling value destruction despite some ROIC improvement. Market shifts in crypto and enterprise AI could disrupt or expand its positioning.
Network Effects vs. Intangible Assets: The Moat Measurement
Uber’s wider and deeper moat, evidenced by sustained value creation and growing profitability, outmatches Strategy Inc’s challenged intangible asset base. I see Uber as better equipped to defend and grow its market share amid sector headwinds and evolving competition.
Which stock offers better returns?
Over the past year, both Uber Technologies, Inc. and Strategy Inc have exhibited bearish price trends with significant declines and decelerating momentum. Their trading volumes show contrasting buyer-seller dynamics amid persistent downward pressure.
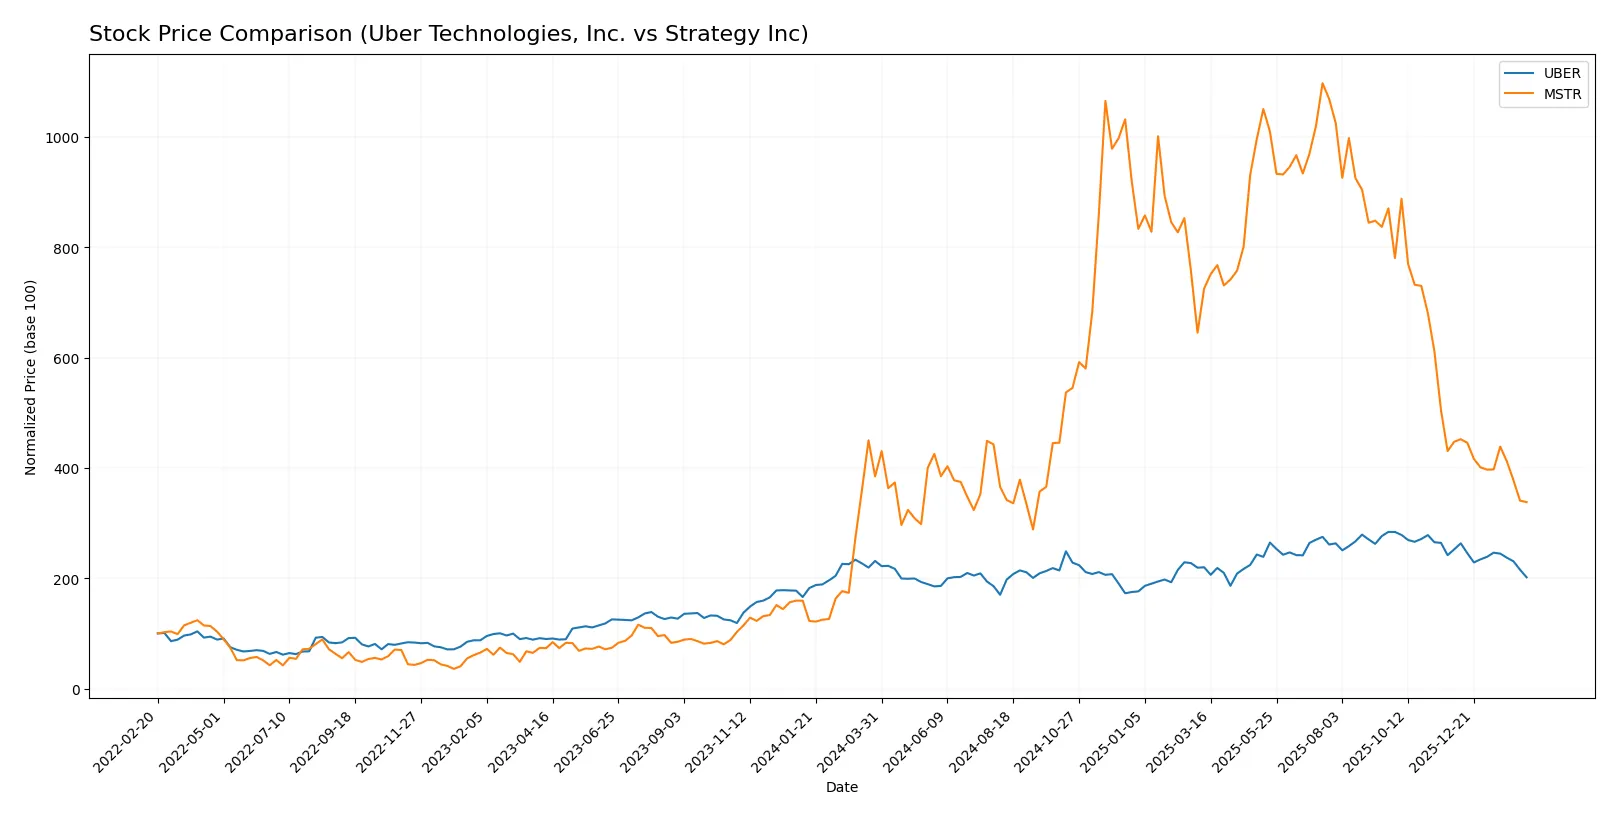
Trend Comparison
Uber’s stock price fell 12.76% over the past 12 months, confirming a bearish trend with decelerating losses. It peaked at 98.51 and bottomed at 58.99, with volatility measured by a 10.33 standard deviation.
Strategy Inc’s stock decreased 12.09% in the same period, also bearish with deceleration. It showed much higher volatility (101.79 std deviation) and ranged between 114.3 and 434.58.
Both stocks delivered negative returns, but Uber’s slightly larger decline and lower volatility suggest a relatively steadier downtrend compared to Strategy Inc.
Target Prices
Analysts show a broad consensus on target prices for Uber Technologies, Inc. and Strategy Inc.
| Company | Target Low | Target High | Consensus |
|---|---|---|---|
| Uber Technologies, Inc. | 72 | 140 | 105.76 |
| Strategy Inc | 175 | 705 | 374.5 |
The consensus target for Uber at 105.76 significantly exceeds its current 69.99 price, signaling strong upside potential. Strategy Inc’s consensus of 374.5 also far surpasses its 133.88 share price, reflecting high expected growth despite elevated volatility.

Don’t Let Luck Decide Your Entry Point
Optimize your entry points with our advanced ProRealTime indicators. You’ll get efficient buy signals with precise price targets for maximum performance. Start outperforming now!
How do institutions grade them?
Uber Technologies, Inc. Grades
The following table summarizes recent institutional grades for Uber Technologies, Inc.:
| Grading Company | Action | New Grade | Date |
|---|---|---|---|
| Citigroup | maintain | Buy | 2026-02-06 |
| Morgan Stanley | maintain | Overweight | 2026-02-05 |
| Wedbush | maintain | Neutral | 2026-02-05 |
| Benchmark | maintain | Hold | 2026-02-05 |
| JP Morgan | maintain | Overweight | 2026-02-05 |
| Citizens | upgrade | Market Outperform | 2026-02-05 |
| RBC Capital | maintain | Outperform | 2026-02-05 |
| Wells Fargo | maintain | Overweight | 2026-02-05 |
| Mizuho | maintain | Outperform | 2026-02-05 |
| Needham | maintain | Buy | 2026-02-05 |
Strategy Inc Grades
Recent institutional grades for Strategy Inc are shown in the following table:
| Grading Company | Action | New Grade | Date |
|---|---|---|---|
| Cantor Fitzgerald | maintain | Overweight | 2026-02-09 |
| BTIG | maintain | Buy | 2026-02-06 |
| Canaccord Genuity | maintain | Buy | 2026-02-04 |
| Mizuho | maintain | Outperform | 2026-01-16 |
| TD Cowen | maintain | Buy | 2026-01-15 |
| Citigroup | maintain | Buy | 2025-12-22 |
| Bernstein | maintain | Outperform | 2025-12-08 |
| Monness, Crespi, Hardt | upgrade | Neutral | 2025-11-10 |
| Canaccord Genuity | maintain | Buy | 2025-11-03 |
| HC Wainwright & Co. | maintain | Buy | 2025-11-03 |
Which company has the best grades?
Uber Technologies holds consistent “Buy” and “Outperform” grades from top-tier firms, with one notable upgrade. Strategy Inc also displays strong “Buy” and “Outperform” ratings, but includes a recent upgrade from “Sell” to “Neutral.” Uber’s grades appear more uniformly positive, suggesting steadier institutional confidence. Investors may interpret Uber’s grades as reflecting greater consensus support.
Risks specific to each company
The following categories identify the critical pressure points and systemic threats facing both firms in the 2026 market environment:
1. Market & Competition
Uber Technologies, Inc.
- Faces intense competition in ride-sharing and delivery sectors globally, with pressure to innovate and maintain market share.
Strategy Inc
- Competes in niche bitcoin treasury and AI analytics markets, vulnerable to cryptocurrency market swings and tech adoption pace.
2. Capital Structure & Debt
Uber Technologies, Inc.
- Maintains moderate debt (D/E 0.5), with strong interest coverage (14.18), indicating manageable leverage risks.
Strategy Inc
- Lower leverage (D/E 0.16) but weak interest coverage near zero signals risk in servicing debt during downturns.
3. Stock Volatility
Uber Technologies, Inc.
- Moderate beta (1.21) reflects typical tech-sector volatility with some resilience to market swings.
Strategy Inc
- High beta (3.54) implies significant price swings and investor risk, driven by crypto exposure and speculative sentiment.
4. Regulatory & Legal
Uber Technologies, Inc.
- Faces evolving regulations on gig economy labor laws and data privacy globally, which could increase compliance costs.
Strategy Inc
- Regulatory uncertainty around cryptocurrencies and AI data use creates potential legal and compliance risks.
5. Supply Chain & Operations
Uber Technologies, Inc.
- Relies on independent providers and technology infrastructure; operational disruptions could impact service reliability.
Strategy Inc
- Dependent on software platforms and bitcoin market infrastructure; tech failures or crypto market disruptions pose risks.
6. ESG & Climate Transition
Uber Technologies, Inc.
- Under pressure to reduce carbon footprint in mobility services; ESG initiatives influence brand and regulatory standing.
Strategy Inc
- Less direct environmental impact but exposed to governance risks in crypto holdings and AI ethical standards.
7. Geopolitical Exposure
Uber Technologies, Inc.
- Operates worldwide, exposed to geopolitical tensions affecting mobility and delivery markets in key regions.
Strategy Inc
- International crypto regulations and data sovereignty laws increase geopolitical risk for global operations.
Which company shows a better risk-adjusted profile?
Uber’s strongest risk lies in regulatory and operational complexity but benefits from solid financial health and moderate stock volatility. Strategy Inc faces severe financial distress signals and extreme stock volatility, amplified by regulatory uncertainty in crypto markets. Uber presents a clearer, more stable risk-adjusted profile supported by a safe Altman Z-Score (3.55) and strong Piotroski score (7). Strategy’s grey-zone Z-Score (2.08) and very weak Piotroski score (2) underscore its vulnerability. Recent ratio data highlights Uber’s robust interest coverage versus Strategy’s near-zero, justifying greater caution with Strategy Inc.
Final Verdict: Which stock to choose?
Uber Technologies, Inc. showcases unmatched operational efficiency and a robust ability to create shareholder value, driven by a very favorable economic moat and strong profitability metrics. Its main point of vigilance lies in a relatively high price-to-book ratio, which might temper upside potential. Uber suits investors seeking aggressive growth with a focus on durable competitive advantages.
Strategy Inc offers a strategic moat rooted in its tangible asset base and potential turnaround story, with a notably low price-to-book ratio indicating value appeal. However, its financial instability and negative profitability raise caution compared to Uber’s more stable profile. It fits investors willing to embrace higher risk for speculative recovery and value plays.
If you prioritize sustainable value creation and proven profitability, Uber is the compelling choice due to its strong ROIC exceeding WACC and consistent income growth. However, if you seek contrarian opportunities with deep value potential and can tolerate volatility, Strategy Inc offers an analytical scenario for turnaround-focused portfolios. Prudence dictates careful monitoring of financial health for both.
Disclaimer: Investment carries a risk of loss of initial capital. The past performance is not a reliable indicator of future results. Be sure to understand risks before making an investment decision.
Go Further
I encourage you to read the complete analyses of Uber Technologies, Inc. and Strategy Inc to enhance your investment decisions: