Home > Comparison > Technology > MSTR vs TYL
The strategic rivalry between Strategy Inc and Tyler Technologies defines the current trajectory of the technology sector’s software application industry. Strategy Inc blends a bitcoin treasury approach with AI-powered analytics, while Tyler Technologies focuses on integrated public sector software solutions. This analysis pits innovative growth and digital asset exposure against steady government tech demand. I will determine which corporate path offers superior risk-adjusted returns for a diversified portfolio.
Table of contents
Companies Overview
Strategy Inc and Tyler Technologies, Inc. both hold critical roles in the software application niche with distinct market approaches.
Strategy Inc: Bitcoin Treasury and AI Analytics Leader
Strategy Inc defines itself as a bitcoin treasury company while also innovating with AI-powered enterprise analytics software. It generates revenue by offering investors exposure to Bitcoin and selling advanced analytics tools like Strategy One and Strategy Mosaic. In 2025, the company strategically sharpened its focus on expanding its AI software platform alongside its cryptocurrency financial products.
Tyler Technologies, Inc.: Public Sector Software Powerhouse
Tyler Technologies, Inc. specializes in integrated information management solutions tailored for the public sector. The bulk of its revenue comes from modular financial management, judicial, tax, and public safety software suites. In 2025, Tyler emphasized cloud-based services through a strategic partnership with Amazon Web Services to enhance its software as a service (SaaS) offerings.
Strategic Collision: Similarities & Divergences
Both companies innovate in software but diverge sharply in customer focus and ecosystem design. Strategy Inc pursues a niche in financial technology with a strong cryptocurrency and AI analytics bent, while Tyler targets public sector efficiency via expansive, integrated software solutions. Their competitive battleground lies in delivering specialized software services, with Strategy Inc reflecting higher market volatility and Tyler offering steady public sector demand. Each presents a distinct risk and growth profile for investors.
Income Statement Comparison
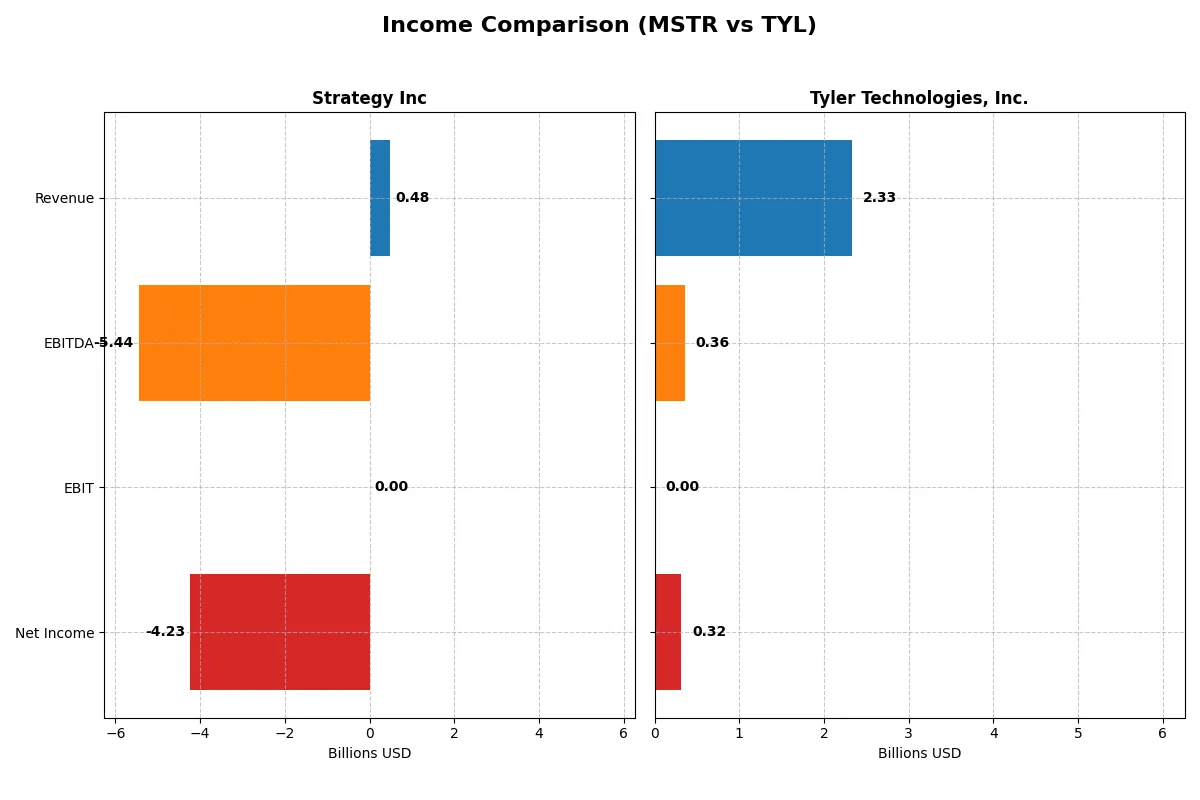
This data dissects the core profitability and scalability of both corporate engines to reveal who dominates the bottom line:
| Metric | Strategy Inc (MSTR) | Tyler Technologies, Inc. (TYL) |
|---|---|---|
| Revenue | 477M | 2.33B |
| Cost of Revenue | 149M | 1.25B |
| Operating Expenses | 5.62B | 670M |
| Gross Profit | 328M | 1.08B |
| EBITDA | -5.44B | 358M |
| EBIT | 0 | 0 |
| Interest Expense | -65M | -5M |
| Net Income | -4.23B | 316M |
| EPS | -15.23 | 7.32 |
| Fiscal Year | 2025 | 2025 |
Income Statement Analysis: The Bottom-Line Duel
This income statement comparison reveals which company drives greater operational efficiency and profitability amid their distinct corporate engines.
Strategy Inc Analysis
Strategy Inc’s revenue edged up slightly to $477M in 2025, but net income plummeted to a massive loss of $4.23B, signaling severe profitability issues. Its gross margin remains strong near 69%, yet the net margin collapses to -886%, reflecting heavy expenses and non-operating charges. The 2025 results show deteriorated momentum despite stable top-line sales.
Tyler Technologies, Inc. Analysis
Tyler Technologies grew revenue 9.1% to $2.33B in 2025, with net income rising to $316M, equating to a 13.5% net margin. Gross margin improved to 46.5%, indicating robust cost control. Despite a flat EBIT margin, net margin and EPS growth demonstrate effective capital allocation and operational scalability in the latest year.
Margin Power vs. Revenue Scale
Tyler Technologies exhibits superior growth and profitability with a sustainable net margin and expanding earnings. Strategy Inc shows high gross margins but catastrophic net losses erode value. For investors prioritizing stable profits and growth, Tyler’s profile stands out as more attractive amid clear fundamental strength and operational efficiency.
Financial Ratios Comparison
These vital ratios act as a diagnostic tool to expose the underlying fiscal health, valuation premiums, and capital efficiency of the companies compared below:
| Ratios | Strategy Inc (MSTR) | Tyler Technologies, Inc. (TYL) |
|---|---|---|
| ROE | -8.29% (2025) | 0% (2025) |
| ROIC | -6.19% (2025) | 0% (2025) |
| P/E | -9.98 (2025) | 61.99 (2025) |
| P/B | 0.83 (2025) | 0 (2025) |
| Current Ratio | 5.62 (2025) | 0 (2025) |
| Quick Ratio | 5.62 (2025) | 0 (2025) |
| D/E | 0.16 (2025) | 0 (2025) |
| Debt-to-Assets | 13.44% (2025) | 0 (2025) |
| Interest Coverage | 83.80 (2025) | -71.61 (2025) |
| Asset Turnover | 0.008 (2025) | 0 (2025) |
| Fixed Asset Turnover | 6.29 (2025) | 0 (2025) |
| Payout ratio | 0% (2025) | 0% (2025) |
| Dividend yield | 0% (2025) | 0% (2025) |
| Fiscal Year | 2025 | 2025 |
Efficiency & Valuation Duel: The Vital Signs
Financial ratios act as the company’s DNA, revealing hidden risks and operational excellence critical to understanding investment potential.
Strategy Inc
Strategy Inc shows negative profitability with an ROE of -8.29% and net margins deeply unfavorable at -886.26%. Its valuation appears reasonable with a P/E of -9.98 and a P/B under 1, suggesting undervaluation despite operational struggles. The firm does not pay dividends, likely reinvesting heavily in R&D at nearly 20% of revenue to fuel future growth.
Tyler Technologies, Inc.
Tyler Technologies posts a positive net margin of 13.53%, reflecting operational strength, but ROE and ROIC stand at zero, signaling limited profitability relative to equity and capital. Its P/E ratio of 62 marks the stock as expensive, indicating high growth expectations. The company offers no dividends, likely prioritizing cash flow reinvestment to sustain innovation and expansion.
Premium Valuation vs. Operational Safety
Tyler Technologies commands a premium valuation backed by solid margin performance but lacks return on equity metrics. Strategy Inc suffers operational losses but trades at a more attractive price-to-book level, with heavy R&D investment. Risk-tolerant investors may prefer Strategy’s growth profile; those favoring stability may lean toward Tyler’s proven margins.
Which one offers the Superior Shareholder Reward?
I observe that neither Strategy Inc (MSTR) nor Tyler Technologies, Inc. (TYL) pays dividends. MSTR’s dividend yield is zero, reflecting no direct cash return. Conversely, TYL also offers no dividend but demonstrates strong free cash flow, with a 2025 free cash flow per share of $14.8 and a 97.5% free cash flow coverage ratio. MSTR lacks free cash flow and suffers persistent net losses, undermining distribution sustainability. Buybacks are crucial here; MSTR shows no buyback activity, while TYL’s robust cash generation likely funds share repurchases. TYL’s capital expenditure coverage ratio of 40.8 in 2025 signals disciplined reinvestment alongside shareholder return. I conclude Tyler Technologies offers a superior total return profile in 2026 due to sustainable cash flows and buyback potential, unlike Strategy Inc’s strained financials and zero distributions.
Comparative Score Analysis: The Strategic Profile
The radar chart reveals the fundamental DNA and trade-offs of Strategy Inc and Tyler Technologies, Inc., highlighting their financial strengths and valuation nuances:
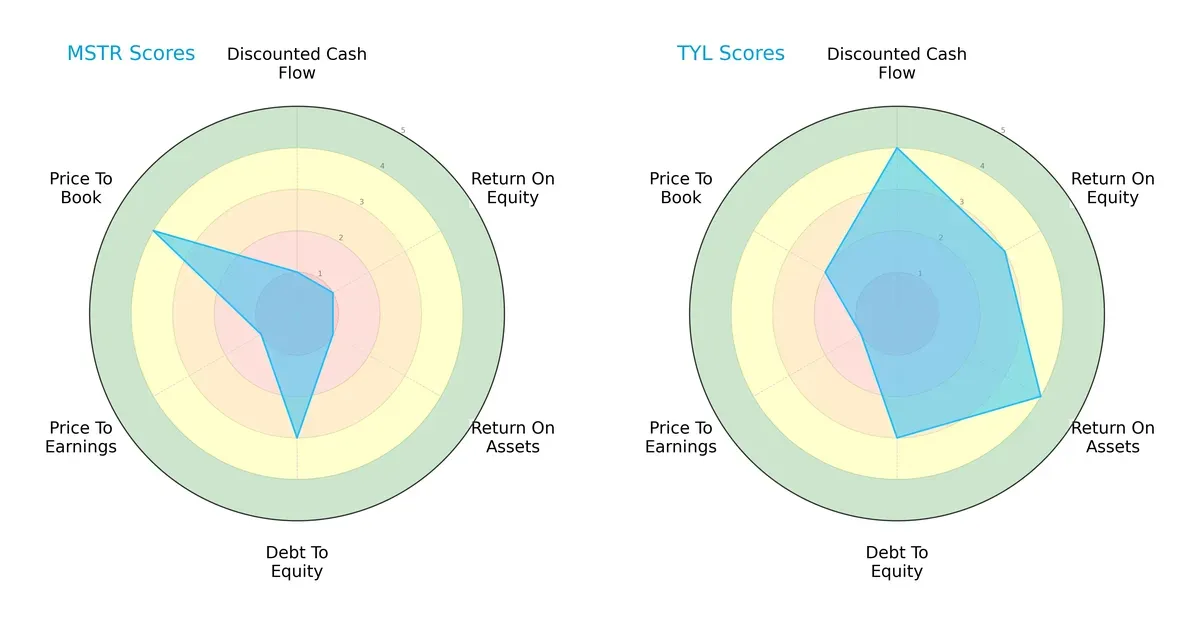
Tyler Technologies, Inc. dominates in DCF, ROE, and ROA, reflecting superior profitability and cash flow generation. Both firms share moderate debt-to-equity scores, but Strategy Inc relies heavily on a favorable price-to-book ratio, masking weak operational metrics. Tyler Tech’s profile is more balanced, while Strategy Inc leans on valuation appeal.
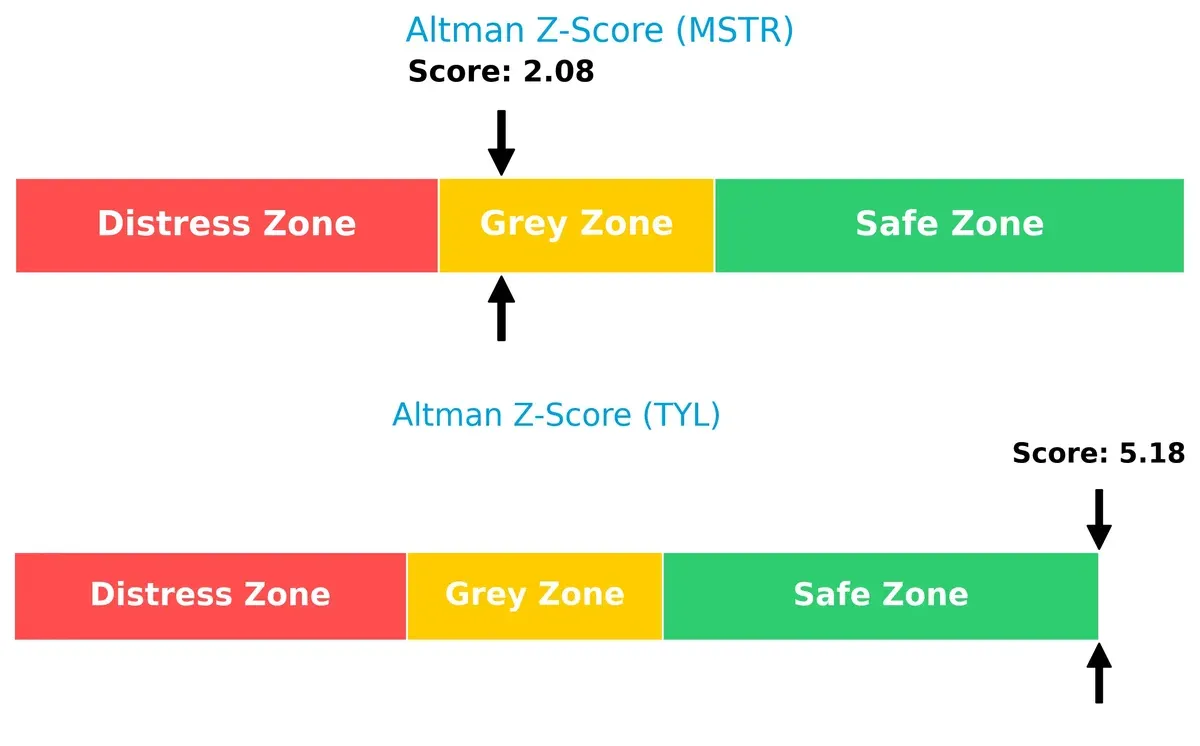
Bankruptcy Risk: Solvency Showdown
Tyler Technologies, Inc. scores 5.18, firmly in the safe zone, while Strategy Inc’s 2.08 sits in the grey zone. This gap signals Tyler’s stronger resilience against bankruptcy risks in the current economic cycle:
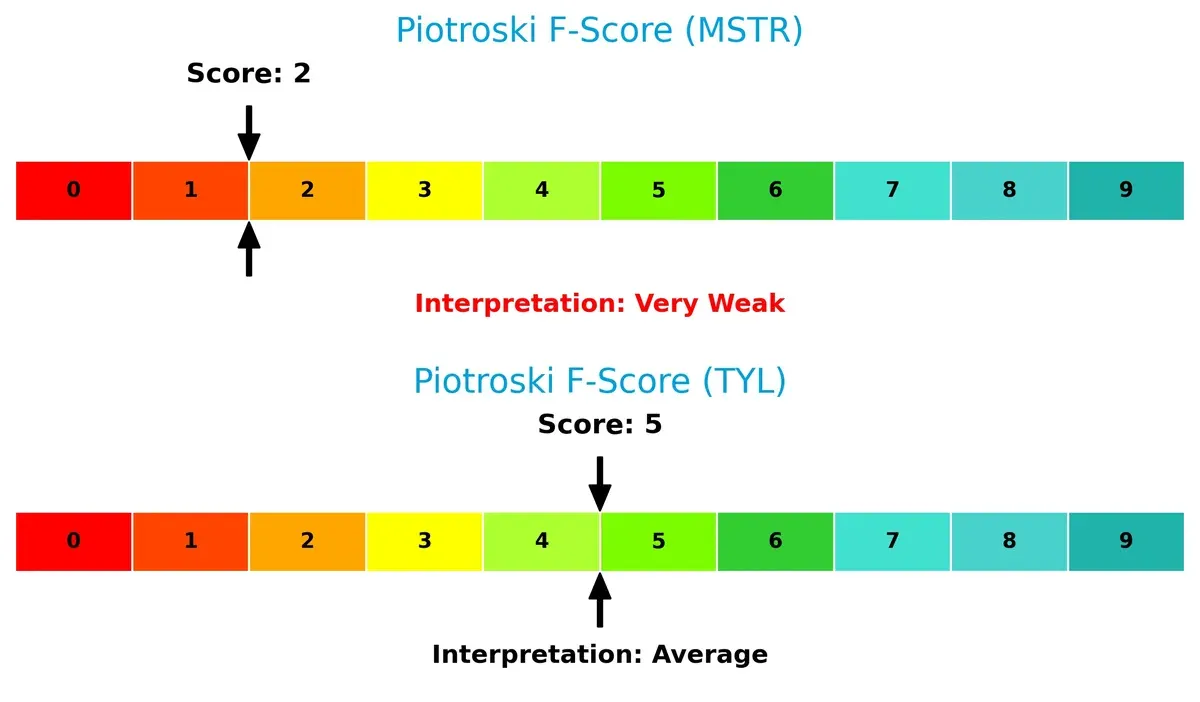
Financial Health: Quality of Operations
Tyler Technologies, Inc. posts a Piotroski F-Score of 5, indicating average but stable financial health. Strategy Inc lags with a weak score of 2, raising red flags on internal financial strength and operational efficiency:
How are the two companies positioned?
This section dissects the operational DNA of Strategy Inc and Tyler Technologies by comparing their revenue distribution by segment alongside their internal strengths and weaknesses. The final objective is to confront their economic moats and determine which business model offers the most resilient and sustainable competitive advantage today.
Revenue Segmentation: The Strategic Mix
This comparison dissects how Strategy Inc and Tyler Technologies diversify their income streams and where their primary sector bets lie:
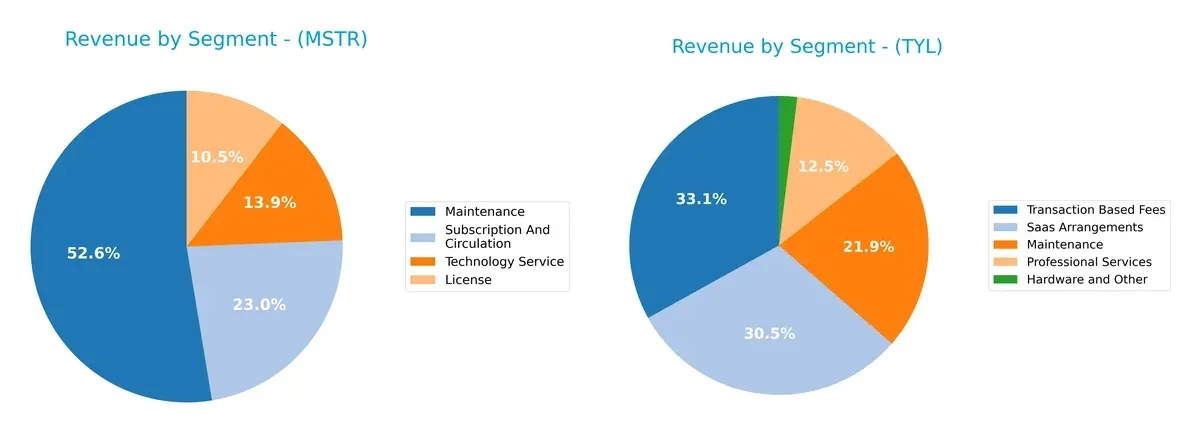
Strategy Inc anchors its revenue in Maintenance at $244M, supplemented by Subscription ($107M) and Technology Service ($64M). In contrast, Tyler Technologies spreads revenue more evenly across five segments, led by Transaction Based Fees at $698M and SaaS Arrangements at $645M. Tyler’s broader diversification reduces concentration risk, while Strategy Inc relies heavily on a maintenance-driven ecosystem, which could limit growth agility.
Strengths and Weaknesses Comparison
This table compares the Strengths and Weaknesses of Strategy Inc and Tyler Technologies, Inc.:
Strategy Inc Strengths
- Diversified revenue streams across License, Maintenance, Subscription, and Technology Services
- Strong global presence with significant North America and EMEA revenues
- Favorable fixed asset turnover and low debt-to-assets ratio
Tyler Technologies, Inc. Strengths
- Diversified revenue with Hardware, Professional Services, SaaS, Maintenance, and Transaction Fees
- Favorable debt-to-equity and debt-to-assets ratios indicating low leverage
- Presence in enterprise software with large contract values
Strategy Inc Weaknesses
- Negative profitability metrics including net margin, ROE, and ROIC
- High weighted average cost of capital (WACC)
- Unfavorable interest coverage and asset turnover
- Zero dividend yield despite strong liquidity ratios
Tyler Technologies, Inc. Weaknesses
- Unfavorable net margin and zero returns on equity and invested capital
- Unavailable WACC data hinders cost of capital assessment
- Unfavorable liquidity ratios and asset turnover
- High P/E ratio suggesting overvaluation concerns
Strategy Inc demonstrates operational diversification and financial conservatism but suffers from poor profitability and capital efficiency. Tyler Technologies shows revenue diversification and low leverage but faces challenges in profitability and liquidity metrics. Both face risks that could impact strategic execution and investor confidence.
The Moat Duel: Analyzing Competitive Defensibility
A structural moat is the only thing protecting long-term profits from the erosion of competition. Let’s examine the key moats of Strategy Inc and Tyler Technologies, Inc.:
Strategy Inc: Intangible Assets and Analytics Innovation
Strategy Inc’s moat relies on proprietary AI analytics and Bitcoin treasury exposure. This drives a unique value proposition but pressure on margins and negative net income challenge sustainability in 2026.
Tyler Technologies, Inc.: Public Sector Integration and Scale
Tyler’s moat stems from deep public sector software integration and a sticky customer base. Its consistent revenue growth and positive net margins demonstrate a wider moat despite recent ROIC declines.
Moat Strength: Niche Innovation vs. Public Sector Scale
Strategy Inc’s moat is narrower and more volatile, tied to emerging tech and crypto exposure. Tyler commands a deeper moat with stable cash flows and entrenched market position, better defending its share.
Which stock offers better returns?
The past year shows clear downward trends for both Strategy Inc (MSTR) and Tyler Technologies, Inc. (TYL), with notable price declines and seller-dominant trading dynamics.
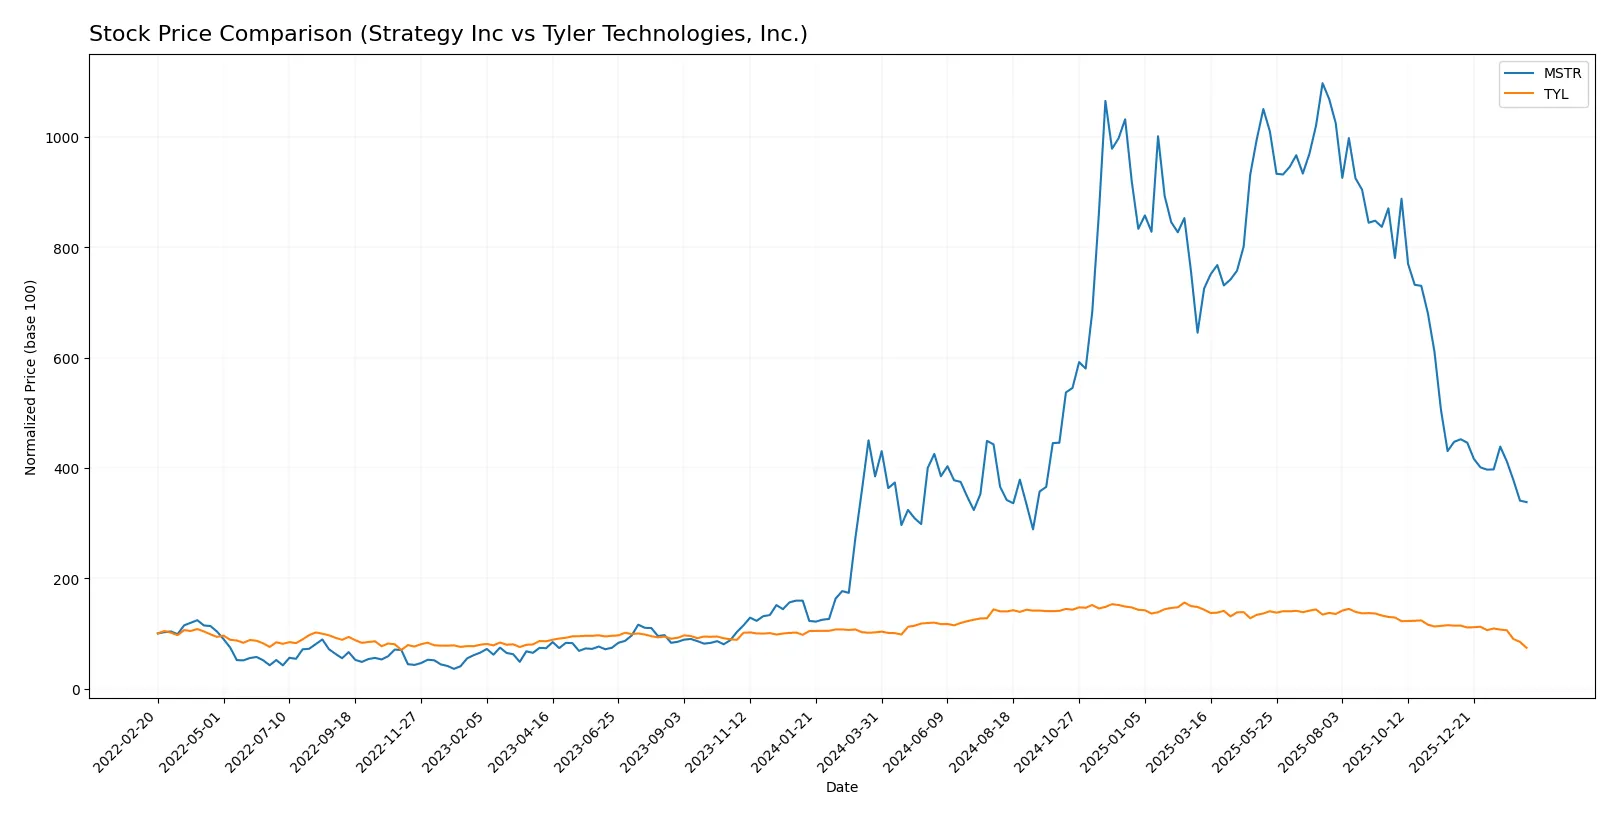
Trend Comparison
Strategy Inc (MSTR) exhibits a bearish trend with a -12.09% price decline over 12 months. The trend decelerates, with a high volatility of 101.79 and a recent sharper drop of -24.44%.
Tyler Technologies, Inc. (TYL) also shows a bearish trend, with a steeper -27.51% price drop over the same period. The trend decelerates, volatility is 68.01, and recent losses accelerate to -35.28%.
Both stocks face seller dominance recently, but MSTR outperforms TYL, delivering a smaller overall loss and less severe recent decline.
Target Prices
Analysts present a broad target price consensus for both Strategy Inc and Tyler Technologies, Inc.
| Company | Target Low | Target High | Consensus |
|---|---|---|---|
| Strategy Inc | 175 | 705 | 374.5 |
| Tyler Technologies, Inc. | 325 | 675 | 473.91 |
The consensus target for Strategy Inc stands nearly three times above its current price of 134, indicating significant upside potential. Tyler Technologies’ target consensus of 474 is over 50% higher than its current 304, reflecting strong analyst confidence.

Don’t Let Luck Decide Your Entry Point
Optimize your entry points with our advanced ProRealTime indicators. You’ll get efficient buy signals with precise price targets for maximum performance. Start outperforming now!
How do institutions grade them?
Strategy Inc Grades
The following table summarizes recent institutional grades for Strategy Inc:
| Grading Company | Action | New Grade | Date |
|---|---|---|---|
| Cantor Fitzgerald | Maintain | Overweight | 2026-02-09 |
| BTIG | Maintain | Buy | 2026-02-06 |
| Canaccord Genuity | Maintain | Buy | 2026-02-04 |
| Mizuho | Maintain | Outperform | 2026-01-16 |
| TD Cowen | Maintain | Buy | 2026-01-15 |
| Citigroup | Maintain | Buy | 2025-12-22 |
| Bernstein | Maintain | Outperform | 2025-12-08 |
| Monness, Crespi, Hardt | Upgrade | Neutral | 2025-11-10 |
| Canaccord Genuity | Maintain | Buy | 2025-11-03 |
| HC Wainwright & Co. | Maintain | Buy | 2025-11-03 |
Tyler Technologies, Inc. Grades
The following table summarizes recent institutional grades for Tyler Technologies, Inc.:
| Grading Company | Action | New Grade | Date |
|---|---|---|---|
| Oppenheimer | Maintain | Outperform | 2026-02-13 |
| Piper Sandler | Maintain | Overweight | 2026-02-13 |
| Needham | Maintain | Buy | 2026-02-13 |
| TD Cowen | Maintain | Buy | 2026-02-13 |
| Evercore ISI Group | Maintain | In Line | 2026-02-13 |
| Wells Fargo | Maintain | Equal Weight | 2026-02-13 |
| Barclays | Maintain | Overweight | 2026-02-13 |
| Stifel | Maintain | Buy | 2026-02-13 |
| DA Davidson | Upgrade | Buy | 2026-02-11 |
| BTIG | Maintain | Buy | 2026-02-09 |
Which company has the best grades?
Tyler Technologies, Inc. holds a broader range of positive grades, including multiple “Buy” and “Outperform” ratings with recent upgrades. Strategy Inc also receives strong “Buy” and “Outperform” grades but includes a Neutral rating upgrade. Tyler’s consistent institutional support may signal stronger market confidence, potentially influencing investor sentiment more favorably.
Risks specific to each company
The following categories identify the critical pressure points and systemic threats facing both firms in the 2026 market environment:
1. Market & Competition
Strategy Inc
- Faces high volatility due to bitcoin treasury exposure and competitive AI analytics market.
Tyler Technologies, Inc.
- Operates in stable public sector software with moderate competition but limited growth scope.
2. Capital Structure & Debt
Strategy Inc
- Low debt-to-equity (0.16) supports moderate financial risk but poor interest coverage signals distress.
Tyler Technologies, Inc.
- No debt reported, indicating strong balance sheet and low financial risk.
3. Stock Volatility
Strategy Inc
- High beta (3.535) indicates extreme price swings and investor risk.
Tyler Technologies, Inc.
- Low beta (0.897) reflects stable stock behavior relative to the market.
4. Regulatory & Legal
Strategy Inc
- Cryptocurrency regulations create systemic uncertainty and compliance risks.
Tyler Technologies, Inc.
- Public sector software faces consistent but manageable regulatory scrutiny.
5. Supply Chain & Operations
Strategy Inc
- Relies on complex data integration and global operations, vulnerable to tech disruptions.
Tyler Technologies, Inc.
- Benefits from cloud partnership with AWS, enhancing operational resilience.
6. ESG & Climate Transition
Strategy Inc
- Bitcoin treasury strategy faces ESG criticism and sustainability concerns.
Tyler Technologies, Inc.
- Public sector focus aligns better with ESG standards and climate transition initiatives.
7. Geopolitical Exposure
Strategy Inc
- Operates internationally exposing it to geopolitical risks affecting crypto markets.
Tyler Technologies, Inc.
- Primarily US-focused, reducing exposure to global geopolitical volatility.
Which company shows a better risk-adjusted profile?
Strategy Inc’s highest risk lies in its volatile bitcoin treasury business and extreme stock price swings. Tyler Technologies faces valuation concerns and moderate operational risks but benefits from stable revenue and a strong balance sheet. Tyler shows a better risk-adjusted profile, supported by its safe zone Altman Z-score (5.18) and average Piotroski score (5), versus Strategy’s grey zone Z-score (2.08) and very weak Piotroski (2). This contrast highlights Tyler’s superior financial stability and lower systemic risk in 2026.
Final Verdict: Which stock to choose?
Strategy Inc’s superpower lies in its strong liquidity buffer, signaling resilience in turbulent times. However, its value destruction and weak profitability remain points of vigilance. It fits an aggressive growth portfolio willing to tolerate volatility for potential turnaround gains.
Tyler Technologies, Inc. boasts a strategic moat with steady recurring revenues and operational discipline. It offers better financial stability than Strategy Inc, though at a premium valuation. This stock suits a GARP investor seeking balanced growth with moderate risk.
If you prioritize high-risk, high-reward opportunities, Strategy Inc could appeal due to its improving ROIC trend despite current losses. However, if you seek stability and consistent cash flow, Tyler Technologies outshines with a safer profile and proven growth, albeit at a stretched price.
Disclaimer: Investment carries a risk of loss of initial capital. The past performance is not a reliable indicator of future results. Be sure to understand risks before making an investment decision.
Go Further
I encourage you to read the complete analyses of Strategy Inc and Tyler Technologies, Inc. to enhance your investment decisions: