In today’s fast-evolving software landscape, Strategy Inc (MSTR) and monday.com Ltd. (MNDY) stand out as innovative players in the application software industry. Strategy Inc combines bitcoin treasury management with AI-driven enterprise analytics, while monday.com offers a versatile cloud-based work operating system designed to streamline business processes. This comparison will help investors understand which company presents a more compelling opportunity in terms of growth, innovation, and market positioning. Let’s explore which stock deserves a place in your portfolio.

Table of contents
Companies Overview
I will begin the comparison between Strategy Inc and monday.com Ltd. by providing an overview of these two companies and their main differences.
Strategy Inc Overview
Strategy Inc, formerly MicroStrategy Incorporated, operates as a bitcoin treasury company and AI-powered enterprise analytics software provider. It offers investors exposure to Bitcoin through various securities and delivers analytics tools like Strategy One and Strategy Mosaic. Headquartered in Tysons Corner, Virginia, the company holds a significant market presence in the software application industry since its incorporation in 1989.
monday.com Ltd. Overview
monday.com Ltd. develops cloud-based Work OS software applications that allow users to build customized work management tools. Serving organizations globally, it provides solutions for marketing, CRM, project management, and more. Founded in 2012 and based in Tel Aviv-Yafo, Israel, monday.com has established itself as a versatile player in the software application market, focusing on modular and visual work operating systems.
Key similarities and differences
Both firms operate in the software application industry and serve international markets with technology-driven solutions. Strategy Inc focuses on Bitcoin treasury and enterprise analytics software, while monday.com emphasizes cloud-based modular work management platforms. Strategy Inc is US-based with fewer employees and a higher market cap, whereas monday.com is Israel-based with a larger workforce but smaller market capitalization.
Income Statement Comparison
Below is a side-by-side comparison of the latest full fiscal year income statement metrics for Strategy Inc and monday.com Ltd., highlighting key financial performance indicators.
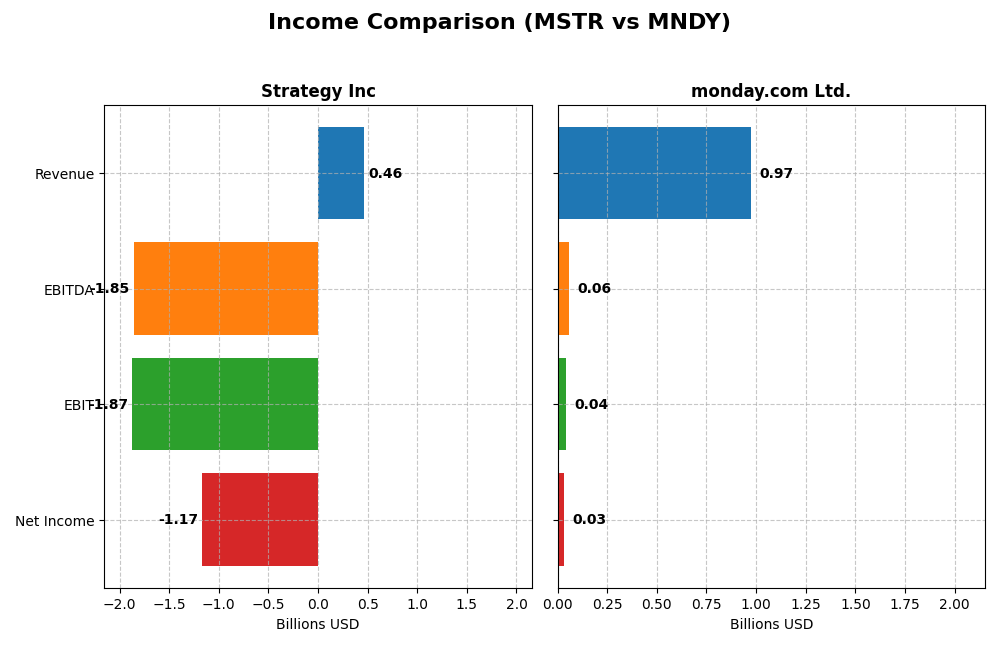
| Metric | Strategy Inc (MSTR) | monday.com Ltd. (MNDY) |
|---|---|---|
| Market Cap | 50B | 6.5B |
| Revenue | 463M | 972M |
| EBITDA | -1.85B | 58M |
| EBIT | -1.87B | 40M |
| Net Income | -1.17B | 32M |
| EPS | -6.06 | 0.65 |
| Fiscal Year | 2024 | 2024 |
Income Statement Interpretations
Strategy Inc
Strategy Inc’s revenue declined modestly by 3.6% over 2020-2024, with a sharper 6.6% drop in 2024 alone. Net income deteriorated significantly, posting a large loss of -$1.17B in 2024. While gross margins remained strong at 72.1%, operating and net margins worsened considerably, reflecting elevated expenses and interest costs that eroded profitability in the latest year.
monday.com Ltd.
monday.com Ltd. showed robust revenue growth of over 500% from 2020 to 2024, with a 33.2% increase in 2024. Net income turned positive in 2024, reaching $32.4M after previous losses. The company maintained high gross margins above 89%, and improvements in operating and net margins helped push profitability into positive territory in the most recent fiscal year.
Which one has the stronger fundamentals?
monday.com Ltd. demonstrates stronger fundamentals with consistent revenue and net income growth, favorable margin trends, and improved profitability in 2024. In contrast, Strategy Inc struggles with declining revenues, significant net losses, and unfavorable margin dynamics. Overall, monday.com’s income statement reflects a healthier financial trajectory compared to Strategy Inc’s ongoing challenges.
Financial Ratios Comparison
The table below presents a side-by-side comparison of key financial ratios for Strategy Inc (MSTR) and monday.com Ltd. (MNDY) based on their most recent fiscal year data from 2024.
| Ratios | Strategy Inc (MSTR) | monday.com Ltd. (MNDY) |
|---|---|---|
| ROE | -6.40% | 3.14% |
| ROIC | -4.38% | -1.73% |
| P/E | -47.80 | 363.0 |
| P/B | 3.06 | 11.41 |
| Current Ratio | 0.71 | 2.66 |
| Quick Ratio | 0.71 | 2.66 |
| D/E (Debt-to-Equity) | 0.40 | 0.10 |
| Debt-to-Assets | 28.09% | 6.29% |
| Interest Coverage | -29.92 | 0 |
| Asset Turnover | 0.018 | 0.577 |
| Fixed Asset Turnover | 5.73 | 7.13 |
| Payout Ratio | 0 | 0 |
| Dividend Yield | 0 | 0 |
Interpretation of the Ratios
Strategy Inc
Strategy Inc shows mostly unfavorable financial ratios in 2024, with negative returns on equity (-6.4%) and invested capital (-4.38%), a low current ratio of 0.71, and negative interest coverage, indicating potential liquidity and profitability concerns. The company does not pay dividends, likely reflecting its focus on reinvestment or growth, with no shareholder returns via dividends.
monday.com Ltd.
monday.com Ltd. presents a mixed 2024 ratio profile, with favorable liquidity ratios (current and quick ratios at 2.66) and low leverage (debt to equity at 0.1), but profitability remains weak with a net margin of 3.33% and ROIC at -1.73%. The company does not distribute dividends, possibly prioritizing growth and reinvestment over shareholder payouts.
Which one has the best ratios?
monday.com Ltd. holds a more balanced and neutral ratio profile with stronger liquidity and lower leverage compared to Strategy Inc’s predominantly unfavorable ratios marked by weak profitability and liquidity. However, both companies exhibit challenges, especially in profitability and dividend yield, suggesting cautious analysis is warranted.
Strategic Positioning
This section compares the strategic positioning of Strategy Inc and monday.com Ltd., including market position, key segments, and exposure to technological disruption:
Strategy Inc
- Operates as a bitcoin treasury company with AI-powered enterprise analytics software internationally; faces high competitive pressure in tech sector.
- Key segments include bitcoin treasury securities, enterprise analytics software licenses, maintenance, subscriptions, and technology services.
- Exposure to disruption from blockchain and AI technologies inherent in bitcoin treasury and enterprise analytics offerings.
monday.com Ltd.
- Develops cloud-based Work OS with modular applications serving diverse sectors globally; operates in a competitive software market.
- Focuses on cloud work management solutions, including marketing, CRM, project management, and customer success services.
- Faces disruption risks related to cloud computing innovations and evolving work management software demands.
Strategy Inc vs monday.com Ltd. Positioning
Strategy Inc combines bitcoin treasury and AI analytics, offering diversified revenue streams but with high volatility; monday.com Ltd. concentrates on cloud-based work management software, enabling focused growth but facing intense market competition.
Which has the best competitive advantage?
Both companies currently shed value as ROIC is below WACC; monday.com Ltd. shows improving profitability with growing ROIC, while Strategy Inc experiences declining returns, indicating a slightly stronger competitive advantage for monday.com Ltd.
Stock Comparison
The stock prices of Strategy Inc (MSTR) and monday.com Ltd. (MNDY) show contrasting trends over the past 12 months, with significant price movements and shifts in trading volumes reflecting diverging market sentiment.
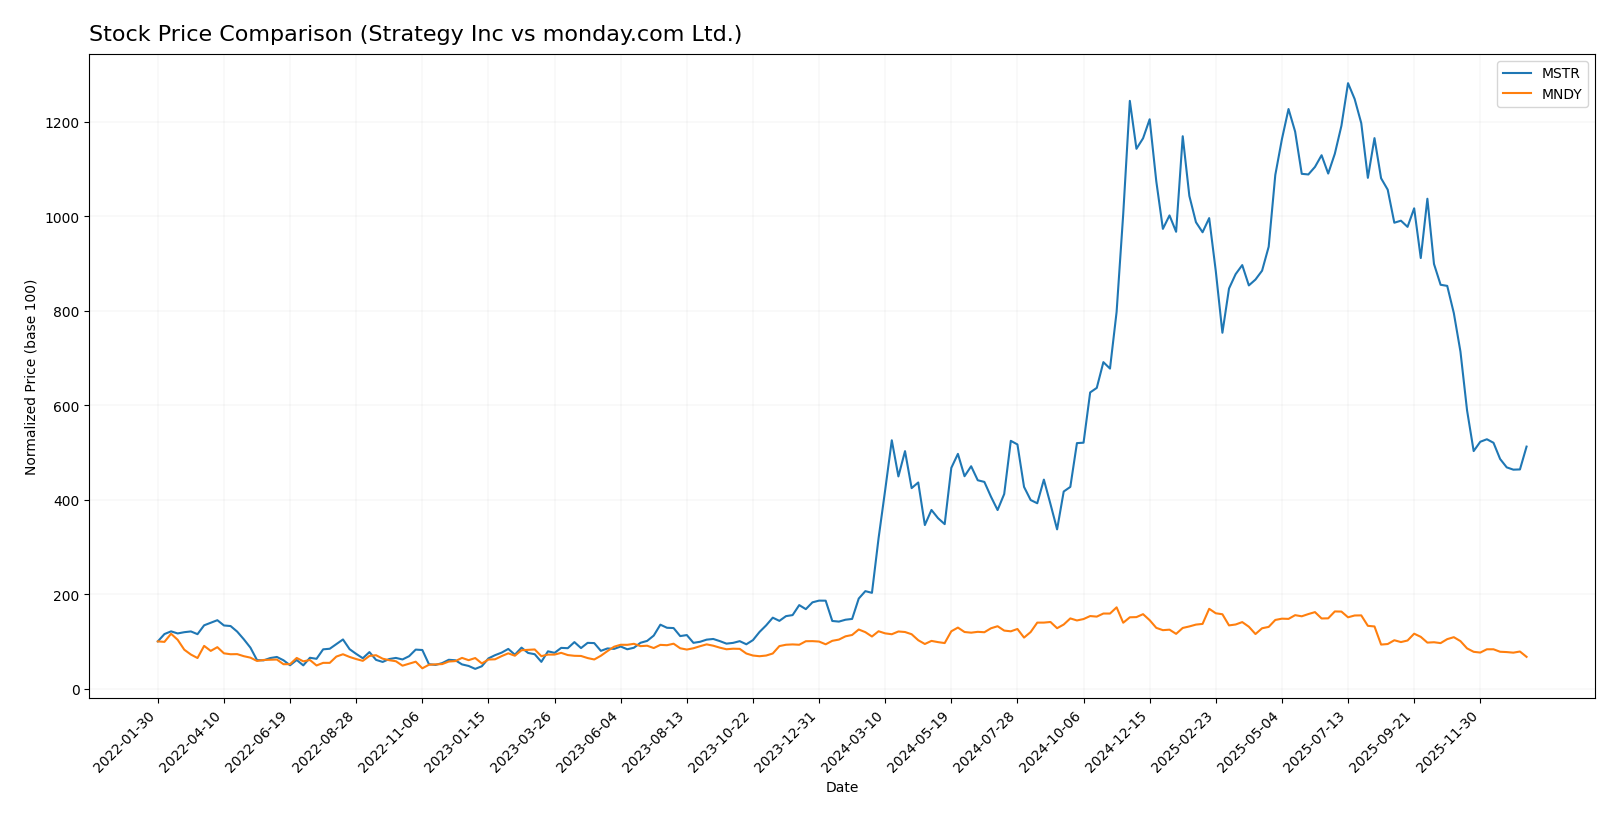
Trend Analysis
Strategy Inc’s stock exhibited a strong bullish trend over the past year with a price increase of 152.71%, albeit with decelerating momentum and high volatility, peaking at 434.58 and bottoming at 68.74.
monday.com Ltd.’s stock followed a bearish trend with a 39.06% decline over the same period, also showing deceleration and lower but notable volatility, reaching a high of 324.31 and a low of 126.7.
Comparing both, Strategy Inc delivered the highest market performance with a substantial positive price change, contrasting with monday.com Ltd.’s notable decline in stock value.
Target Prices
The current analyst consensus presents a wide target range with a moderate upside potential for both Strategy Inc and monday.com Ltd.
| Company | Target High | Target Low | Consensus |
|---|---|---|---|
| Strategy Inc | 705 | 175 | 433.57 |
| monday.com Ltd. | 330 | 194 | 264.42 |
Analysts expect Strategy Inc’s stock to rise significantly from the current price of 173.71 USD towards an average target of 433.57 USD, while monday.com Ltd. shows potential upside from 126.7 USD to a consensus target of 264.42 USD. Both stocks imply attractive growth but with substantial price variability.
Analyst Opinions Comparison
This section compares analysts’ ratings and grades for Strategy Inc and monday.com Ltd.:
Rating Comparison
Strategy Inc Rating
- Rating: A- indicating a very favorable overall rating.
- Discounted Cash Flow Score: 1, very unfavorable, suggests potential overvaluation.
- ROE Score: 4, favorable, showing efficient profit generation from equity.
- ROA Score: 5, very favorable, excellent asset utilization.
- Debt To Equity Score: 3, moderate, reflecting moderate financial risk.
- Overall Score: 4, favorable, indicating strong financial standing.
monday.com Ltd. Rating
- Rating: B- with a very favorable overall rating.
- Discounted Cash Flow Score: 4, favorable, indicating better valuation prospects.
- ROE Score: 3, moderate, indicating average efficiency in profit generation.
- ROA Score: 3, moderate, average asset efficiency.
- Debt To Equity Score: 3, moderate, similar financial risk profile.
- Overall Score: 3, moderate, reflecting average financial health.
Which one is the best rated?
Based strictly on provided data, Strategy Inc holds a higher overall score (4 vs. 3) and stronger returns on equity and assets, despite a weak discounted cash flow score. monday.com Ltd. has a better DCF score but lower overall ratings, making Strategy Inc better rated overall.
Scores Comparison
The following table compares the Altman Z-Score and Piotroski Score for Strategy Inc and monday.com Ltd.:
Strategy Inc Scores
- Altman Z-Score: 2.78, in the grey zone, moderate bankruptcy risk.
- Piotroski Score: 4, average financial strength.
monday.com Ltd. Scores
- Altman Z-Score: 6.33, in the safe zone, low bankruptcy risk.
- Piotroski Score: 5, average financial strength.
Which company has the best scores?
Based on the provided data, monday.com Ltd. has a significantly higher Altman Z-Score indicating lower bankruptcy risk, and a slightly better Piotroski Score than Strategy Inc. Thus, monday.com Ltd. shows stronger scores overall.
Grades Comparison
The following presents a detailed comparison of recent grades assigned to both companies by reputable grading firms:
Strategy Inc Grades
This table summarizes the latest grades and actions from recognized financial institutions for Strategy Inc:
| Grading Company | Action | New Grade | Date |
|---|---|---|---|
| Mizuho | Maintain | Outperform | 2026-01-16 |
| TD Cowen | Maintain | Buy | 2026-01-15 |
| Citigroup | Maintain | Buy | 2025-12-22 |
| Bernstein | Maintain | Outperform | 2025-12-08 |
| Monness, Crespi, Hardt | Upgrade | Neutral | 2025-11-10 |
| HC Wainwright & Co. | Maintain | Buy | 2025-11-03 |
| Canaccord Genuity | Maintain | Buy | 2025-11-03 |
| BTIG | Maintain | Buy | 2025-10-31 |
| Cantor Fitzgerald | Maintain | Overweight | 2025-10-31 |
| TD Cowen | Maintain | Buy | 2025-10-31 |
Strategy Inc exhibits a consistent pattern of buy and outperform ratings, with only a single recent upgrade from sell to neutral.
monday.com Ltd. Grades
The following table details recent grades and actions for monday.com Ltd. from established grading companies:
| Grading Company | Action | New Grade | Date |
|---|---|---|---|
| BTIG | Maintain | Buy | 2026-01-15 |
| Barclays | Maintain | Overweight | 2026-01-12 |
| Jefferies | Maintain | Buy | 2026-01-05 |
| Citigroup | Maintain | Buy | 2025-12-23 |
| Tigress Financial | Maintain | Buy | 2025-12-11 |
| Baird | Maintain | Outperform | 2025-11-11 |
| Wells Fargo | Maintain | Overweight | 2025-11-11 |
| DA Davidson | Maintain | Buy | 2025-11-11 |
| Morgan Stanley | Maintain | Overweight | 2025-11-11 |
| Piper Sandler | Maintain | Overweight | 2025-11-11 |
monday.com Ltd. shows a strong consensus with mostly buy and overweight ratings, including an outperform grade, all maintained recently.
Which company has the best grades?
Both Strategy Inc and monday.com Ltd. maintain predominantly positive grades, with buy and outperform ratings. monday.com Ltd. has a slightly higher count of buy and overweight grades, indicating marginally stronger analyst confidence, which may affect investor perception and portfolio decisions.
Strengths and Weaknesses
Below is a comparison of key strengths and weaknesses for Strategy Inc (MSTR) and monday.com Ltd. (MNDY) based on recent financial data and competitive positioning.
| Criterion | Strategy Inc (MSTR) | monday.com Ltd. (MNDY) |
|---|---|---|
| Diversification | Moderate product mix: licenses, maintenance, subscriptions, and technology services generating diversified revenue streams | Focused on project management software; less diversified product offering |
| Profitability | Negative net margin (-252%) and ROIC (-4.38%), indicating value destruction and declining profitability | Slightly positive net margin (3.33%) but negative ROIC (-1.73%); growing profitability trend |
| Innovation | Moderate – steady technology service revenue but declining overall returns suggests innovation challenges | High innovation potential reflected in growing ROIC trend despite current losses |
| Global presence | Established global footprint with consistent maintenance revenue around 240M-290M USD | Growing international presence; financial ratios indicate solid liquidity and low debt |
| Market Share | Stable but shrinking due to declining ROIC and profitability | Expanding market share in SaaS project management; improving operational metrics |
Key takeaways: Strategy Inc shows signs of financial distress and value destruction despite diversified revenue streams, while monday.com Ltd. demonstrates improving profitability and operational efficiency, supported by innovation and strong liquidity. Investors should weigh the risks of Strategy Inc’s declining returns against monday.com’s growth potential.
Risk Analysis
Below is a comparative table highlighting key risks for Strategy Inc (MSTR) and monday.com Ltd. (MNDY) based on their latest 2024 data.
| Metric | Strategy Inc (MSTR) | monday.com Ltd. (MNDY) |
|---|---|---|
| Market Risk | High beta (3.43) indicates high volatility and sensitivity to market swings | Moderate beta (1.26) suggests moderate market exposure |
| Debt Level | Moderate debt-to-equity (0.4) with 28% debt to assets, manageable but notable | Low debt-to-equity (0.1) and only 6.3% debt to assets, low financial leverage |
| Regulatory Risk | Moderate, due to international bitcoin treasury operations and evolving crypto regulations | Moderate, as a global SaaS provider subject to data and privacy regulations |
| Operational Risk | Exposure to cryptocurrency market fluctuations and software product reliability | Reliance on cloud infrastructure and SaaS adoption pace |
| Environmental Risk | Low, typical of software and digital asset management companies | Low, primarily software with limited environmental footprint |
| Geopolitical Risk | Elevated, given US and international crypto regulatory uncertainties | Moderate, headquartered in Israel with global operations |
Strategy Inc faces the most impactful risks from its high market volatility and exposure to the unpredictable cryptocurrency sector, alongside a moderate debt load that demands cautious management. monday.com exhibits lower financial risk and volatility but is challenged by high valuation multiples and moderate operational risks related to the cloud software market. Investors should weigh Strategy Inc’s higher risk-return profile against monday.com’s steadier, though still cautious, outlook.
Which Stock to Choose?
Strategy Inc (MSTR) has shown a declining income trajectory with a negative net margin of -251.73% and unfavorable profitability ratios including ROE at -6.4%. Despite a very favorable A- rating, its debt levels remain moderate and financial ratios suggest an overall unfavorable outlook.
monday.com Ltd. (MNDY) presents a favorable income evolution with a positive net margin of 3.33% and improving profitability metrics. The company holds a slightly lower B- rating but benefits from strong liquidity ratios, low debt, and a neutral overall financial ratio evaluation.
Investors with a tolerance for risk and seeking growth potential might view monday.com Ltd.’s improving income and profitability as appealing, while those prioritizing higher-rated stability could see Strategy Inc’s rating as a positive, despite its current financial challenges. The choice could depend on the investor’s preference for growth versus stability.
Disclaimer: Investment carries a risk of loss of initial capital. The past performance is not a reliable indicator of future results. Be sure to understand risks before making an investment decision.
Go Further
I encourage you to read the complete analyses of Strategy Inc and monday.com Ltd. to enhance your investment decisions: