Home > Comparison > Technology > MSTR vs DOMO
The strategic rivalry between Strategy Inc and Domo, Inc. shapes the technology sector’s software-application landscape. Strategy Inc operates as a bitcoin treasury company with AI-driven analytics, blending asset exposure with enterprise software. Domo, Inc. delivers a cloud-based business intelligence platform connecting organizations in real time. This analysis examines their contrasting models—asset-heavy versus SaaS-focused—to identify which offers superior risk-adjusted returns for a diversified portfolio.

Table of contents
Companies Overview
Strategy Inc and Domo, Inc. stand as pivotal players in the evolving software application market, each shaping distinct niches.
Strategy Inc: Bitcoin Treasury and AI Analytics Leader
Strategy Inc dominates as a bitcoin treasury company with a robust presence across multiple continents. It generates revenue through securities that offer investors economic exposure to Bitcoin alongside AI-powered enterprise analytics software. In 2026, its strategic focus emphasizes expanding its AI-driven intelligence platforms, Strategy One and Strategy Mosaic, to enhance data governance and actionable insights.
Domo, Inc.: Cloud-Based Business Intelligence Innovator
Domo, Inc. operates a cloud-based business intelligence platform connecting all organizational levels with real-time data. It earns revenue by enabling businesses to manage operations via smartphones and cloud infrastructure. Its 2026 strategy centers on deepening digital connectivity and expanding global reach, notably in the US and Japan, to empower businesses with instant, accessible analytics.
Strategic Collision: Similarities & Divergences
Both companies innovate in software applications but diverge sharply in approach—Strategy Inc blends closed bitcoin exposure and AI analytics, while Domo embraces an open cloud ecosystem for data accessibility. Their primary battleground is real-time enterprise decision intelligence, where Strategy’s AI tools and Domo’s connectivity solutions compete. This contrast defines their distinct investment profiles—one anchored in crypto-asset exposure and AI, the other in cloud-based operational agility.
Income Statement Comparison
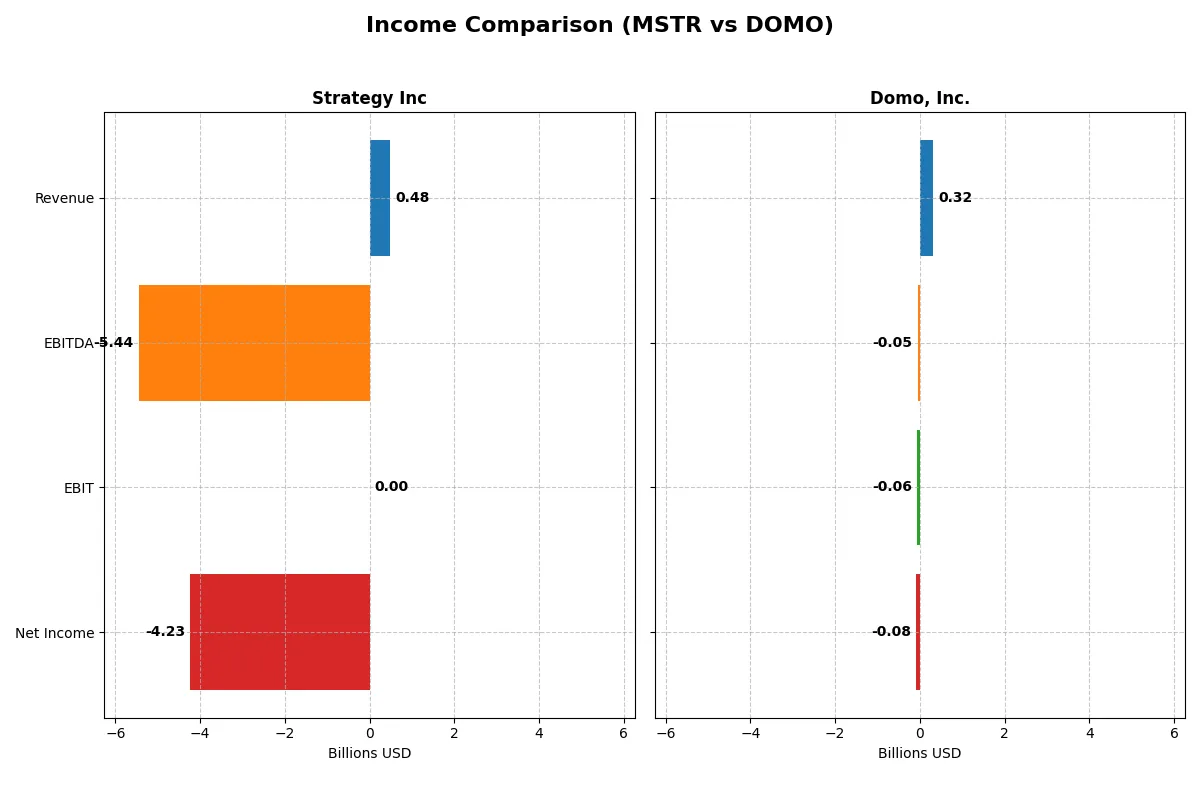
This data dissects the core profitability and scalability of both corporate engines to reveal who dominates the bottom line:
| Metric | Strategy Inc (MSTR) | Domo, Inc. (DOMO) |
|---|---|---|
| Revenue | 477M | 317M |
| Cost of Revenue | 149M | 81M |
| Operating Expenses | 5.62B | 295M |
| Gross Profit | 328M | 236M |
| EBITDA | -5.44B | -50M |
| EBIT | 0 | -59M |
| Interest Expense | 65M | 20M |
| Net Income | -4.23B | -82M |
| EPS | -15.23 | -2.13 |
| Fiscal Year | 2025 | 2025 |
Income Statement Analysis: The Bottom-Line Duel
The forthcoming income statement comparison reveals which company drives profitability and efficiency more effectively in challenging market conditions.
Strategy Inc Analysis
Strategy Inc’s revenue slightly declined by 6.56% over 2021-2025, ending at $477M in 2025. Net income deteriorated sharply, posting a -$4.23B loss in 2025, reflecting a collapsing net margin of -886%. Despite a strong gross margin near 69%, operating expenses and other costs overwhelmed earnings, eroding efficiency and momentum.
Domo, Inc. Analysis
Domo, Inc. grew revenue 50.8% over the five-year span, reaching $317M in 2025, with a gross margin of 74.5%. However, it sustained net losses around -$82M in 2025, driving a net margin of -25.8%. Operating expenses remain high, and recent yearly declines in EBIT and net margin signal waning momentum despite revenue scale.
Margin Resilience vs. Revenue Expansion
Strategy Inc exhibits superior gross margin resilience but suffers from catastrophic net losses due to extreme operating expenses. Domo, Inc. delivers solid revenue growth and better net margin stability but still struggles to achieve profitability. For investors, Strategy’s profile signals deep operational distress, whereas Domo’s gradual scaling offers a cautiously more sustainable growth trajectory.
Financial Ratios Comparison
These vital ratios act as a diagnostic tool to expose the underlying fiscal health, valuation premiums, and capital efficiency of the companies compared below:
| Ratios | Strategy Inc (MSTR) | Domo, Inc. (DOMO) |
|---|---|---|
| ROE | -6.4% (2024) | 46.2% (2025) |
| ROIC | -4.4% (2024) | 194.7% (2025) |
| P/E | -47.8 (2024) | -3.98 (2025) |
| P/B | 3.06 (2024) | -1.84 (2025) |
| Current Ratio | 0.71 (2024) | 0.56 (2025) |
| Quick Ratio | 0.71 (2024) | 0.56 (2025) |
| D/E | 0.40 (2024) | -0.76 (2025) |
| Debt-to-Assets | 28.1% (2024) | 63.2% (2025) |
| Interest Coverage | -29.9 (2024) | -3.0 (2025) |
| Asset Turnover | 0.018 (2024) | 1.48 (2025) |
| Fixed Asset Turnover | 5.73 (2024) | 8.17 (2025) |
| Payout ratio | 0% (2024) | 0% (2025) |
| Dividend yield | 0% (2024) | 0% (2025) |
| Fiscal Year | 2024 | 2025 |
Efficiency & Valuation Duel: The Vital Signs
Financial ratios serve as a company’s DNA, exposing hidden risks and operational excellence that shape investor decisions.
Strategy Inc
Strategy Inc struggles with profitability, showing a negative ROE of -6.4% and a deeply unfavorable net margin of -251.73%. Despite a favorable P/E ratio of -47.8, its valuation appears stretched given a high P/B of 3.06. The company returns no dividends, focusing capital allocation on R&D, but its weak current ratio of 0.71 signals liquidity risks.
Domo, Inc.
Domo shines with a robust ROE of 46.23% and an exceptional ROIC of 194.73%, signaling operational efficiency. Its P/E ratio is favorable at -3.98, while a negative P/B of -1.84 suggests undervaluation. Despite a low current ratio of 0.56 indicating liquidity pressure, Domo reinvests heavily in growth, eschewing dividends to fuel innovation.
Premium Valuation vs. Operational Safety
Domo offers a stronger balance of profitability and valuation efficiency, despite liquidity concerns. Strategy Inc’s stretched valuation and weak profitability present higher risk. Domo suits investors seeking growth with operational leverage, while Strategy Inc fits those wary of valuation extremes but facing profitability challenges.
Which one offers the Superior Shareholder Reward?
I see that neither Strategy Inc nor Domo, Inc. pays dividends, eliminating yield as a direct shareholder reward. Strategy Inc shows no dividend payout and negative free cash flow per share of -115 in 2024, reflecting heavy reinvestment or capital expenditures. Domo, Inc. also pays no dividend but maintains a smaller negative free cash flow per share around -0.48 in 2025, signaling more modest reinvestment. Buyback activity is absent for both, meaning total returns rely on capital growth. Strategy Inc’s payout model is non-existent and unsustainable with a current ratio below 1 and negative margins. Domo, Inc.’s distribution model is leaner, with negative margins but better asset turnover (1.48 vs. 0.02), suggesting more efficient capital use. Given Strategy Inc’s deep free cash flow deficits and solvency concerns, I conclude Domo, Inc. offers a more attractive total return profile for 2026 investors due to its relatively sustainable reinvestment and operational efficiency.
Comparative Score Analysis: The Strategic Profile
The radar chart reveals the fundamental DNA and trade-offs of Strategy Inc and Domo, Inc., highlighting their distinct financial strengths and weaknesses:
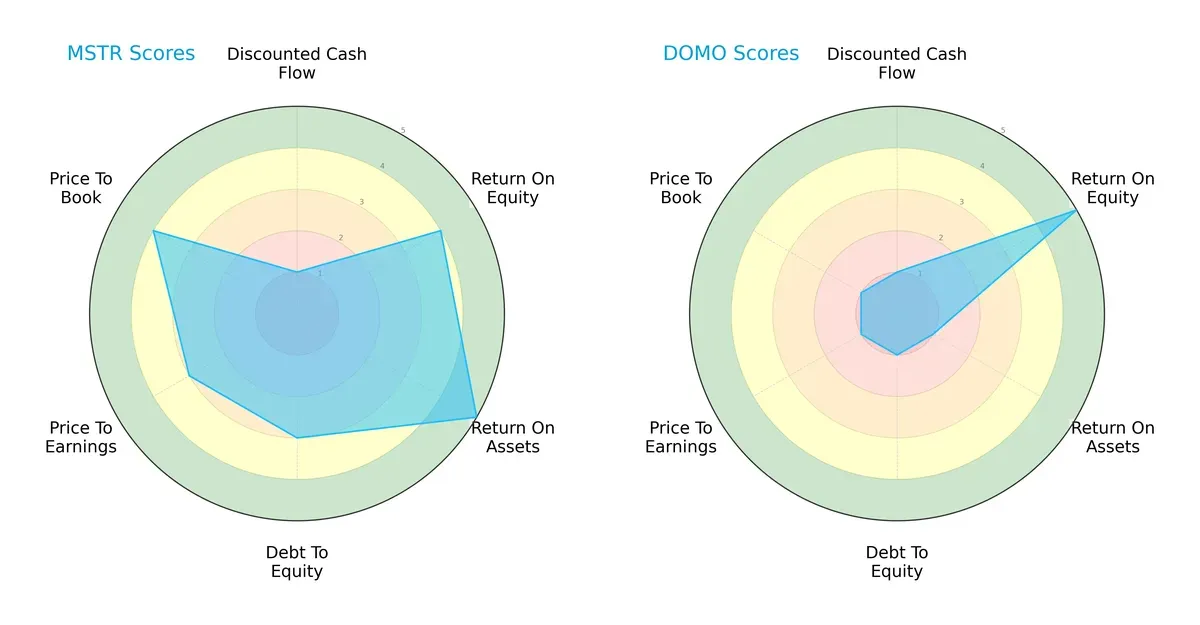
Strategy Inc shows a more balanced profile with strong ROA (5) and solid ROE (4), while maintaining moderate debt levels (3) and reasonable valuation scores (PE at 3, PB at 4). Domo, Inc. relies heavily on a high ROE (5) but scores poorly on asset utilization (ROA 1), leverage (debt-to-equity 1), and valuation metrics (PE and PB both 1), indicating riskier financial stability and overvaluation concerns.
Bankruptcy Risk: Solvency Showdown
The Altman Z-Score gap signals a stark contrast in bankruptcy risk:
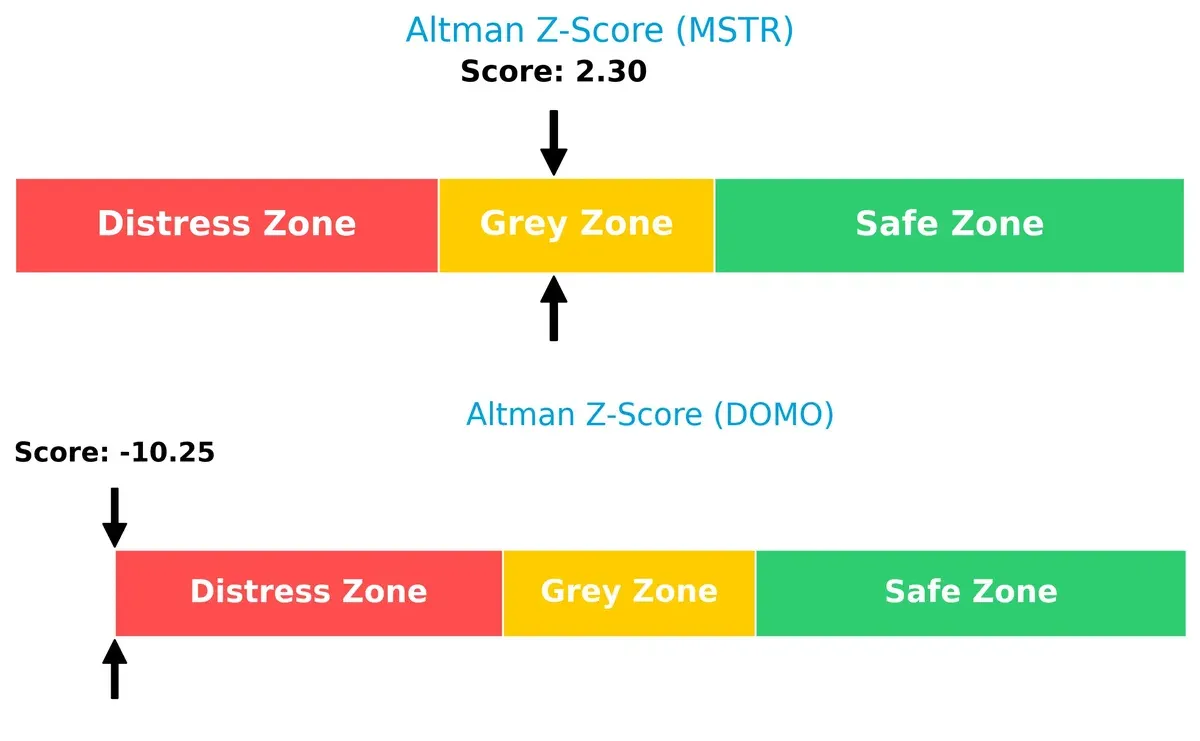
Strategy Inc’s score of 2.3 places it in the grey zone, implying moderate risk but relative solvency. Domo, Inc.’s deeply negative score (-10.3) lands it in the distress zone, highlighting severe financial distress and a high bankruptcy risk in this economic cycle.
Financial Health: Quality of Operations
Piotroski F-Scores reveal operational robustness differences:
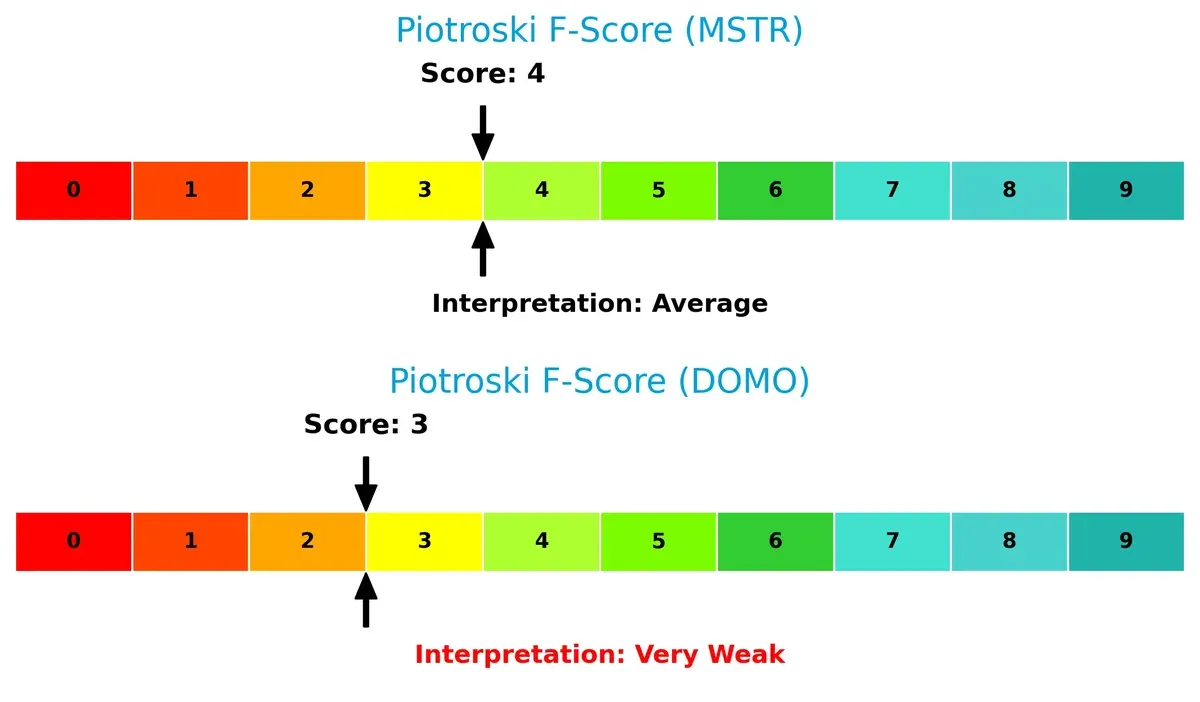
Strategy Inc’s score of 4 signals average financial health with some red flags. Domo, Inc.’s score of 3 is classified as very weak, confirming operational challenges and weaker internal financial controls compared to its peer. Investors should approach Domo with heightened caution.
How are the two companies positioned?
This section dissects the operational DNA of Strategy Inc and Domo, Inc. by comparing revenue distribution by segment and internal strengths and weaknesses. The final goal is to confront their economic moats to identify the more resilient and sustainable competitive edge in today’s market.
Revenue Segmentation: The Strategic Mix
This comparison dissects how Strategy Inc and Domo, Inc. diversify their income streams and reveals where their primary sector bets lie:
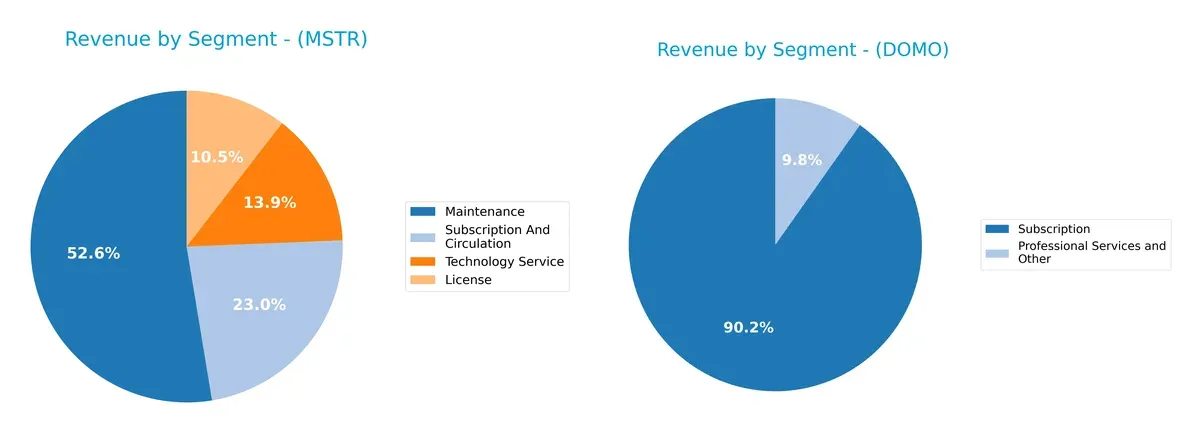
Strategy Inc anchors revenue in Maintenance at $244M, supplemented by Subscription ($107M), Technology Service ($64M), and License ($49M). Domo, Inc. pivots heavily on Subscription at $286M, with a smaller $31M from Professional Services. Strategy Inc shows a more diversified mix, reducing concentration risk. Domo leans on subscription dominance, betting on recurring revenue stability but raising exposure to market shifts in that segment.
Strengths and Weaknesses Comparison
This table compares the strengths and weaknesses of Strategy Inc and Domo, Inc. based on diversification, profitability, financials, innovation, global presence, and market share:
Strategy Inc Strengths
- Diversified revenue streams with License, Maintenance, Subscription, Technology Services
- Favorable debt-to-equity ratio at 0.4 and debt-to-assets at 28%
- High fixed asset turnover of 5.73 indicating efficient asset use
Domo, Inc. Strengths
- Strong profitability metrics with ROE of 46% and ROIC of 195%
- Favorable price-to-earnings and price-to-book ratios
- High asset turnover at 1.48 and fixed asset turnover at 8.17
Strategy Inc Weaknesses
- Negative net margin of -252% and negative returns on equity and invested capital
- Low current and quick ratios at 0.71 signal liquidity concerns
- Unfavorable interest coverage and low asset turnover of 0.02
- No dividend yield
Domo, Inc. Weaknesses
- Negative net margin of -26% despite strong ROE and ROIC
- High debt-to-assets ratio at 63% and negative debt-to-equity ratio
- Low liquidity with current and quick ratios of 0.56
- Negative interest coverage and no dividend yield
Both companies show mixed profiles: Strategy Inc struggles with profitability and liquidity despite solid asset efficiency and moderate debt levels. Domo, Inc. delivers strong returns on equity and capital but carries high leverage and liquidity risks. These factors highlight different strategic challenges in balancing growth, profitability, and financial stability.
The Moat Duel: Analyzing Competitive Defensibility
A structural moat is the single shield protecting long-term profits from relentless competition erosion. Let’s dissect these firms’ moats:
Strategy Inc: Intangible Assets Powerhouse
Strategy Inc leverages intangible assets, notably AI-powered analytics and Bitcoin exposure, driving high gross margins near 69%. Yet, its declining ROIC signals looming pressure on capital efficiency in 2026.
Domo, Inc.: Growing Network Effects and Value Creation
Domo thrives on network effects through its cloud BI platform, connecting all organizational levels. Its ROIC exceeds WACC by 182%, showing expanding capital efficiency and a widening moat.
Verdict: Intangible Assets vs. Network Effects
Domo’s rapidly growing ROIC and value creation demonstrate a deeper, more sustainable moat than Strategy Inc’s eroding capital efficiency. Domo stands better poised to defend and expand market share in 2026.
Which stock offers better returns?
Over the past year, both Strategy Inc and Domo, Inc. experienced significant price declines, with decelerating bearish trends and persistent seller dominance impacting trading dynamics.
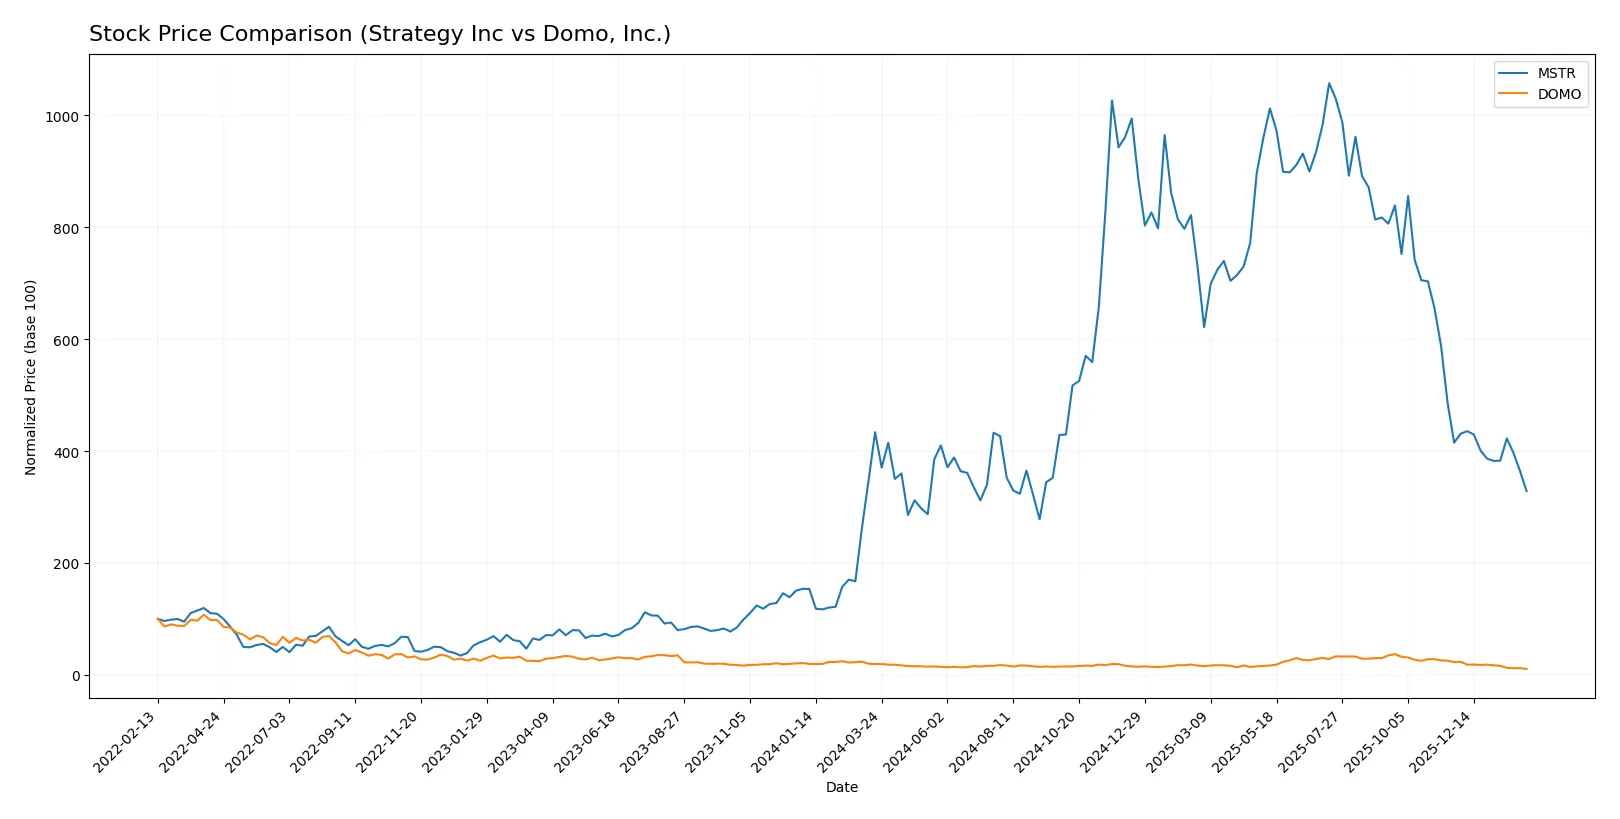
Trend Comparison
Strategy Inc’s stock fell 24.3% over 12 months, marking a bearish trend with deceleration. It reached a high of 434.58 and a low of 114.3, exhibiting high volatility (std dev 101.34).
Domo, Inc.’s price dropped 44.48% over the same period, also bearish and decelerating. It showed lower volatility (std dev 3.08) with a high of 18.06 and a low of 5.23.
Strategy Inc outperformed Domo, Inc. in market performance, showing a smaller percentage decline and higher volatility over the past year.
Target Prices
Analysts present a wide range of target prices, reflecting divergent views on growth and risk.
| Company | Target Low | Target High | Consensus |
|---|---|---|---|
| Strategy Inc | 175 | 705 | 374.5 |
| Domo, Inc. | 10 | 13 | 11.5 |
Strategy Inc’s consensus target of 374.5 vastly exceeds its current price near 135, signaling strong upside potential. Domo’s target consensus of 11.5 also suggests considerable room for appreciation from its 5.23 price level.

Don’t Let Luck Decide Your Entry Point
Optimize your entry points with our advanced ProRealTime indicators. You’ll get efficient buy signals with precise price targets for maximum performance. Start outperforming now!
How do institutions grade them?
The following tables summarize recent institutional grades for Strategy Inc and Domo, Inc.:
Strategy Inc Grades
This table shows recent grades issued by major grading companies for Strategy Inc.
| Grading Company | Action | New Grade | Date |
|---|---|---|---|
| BTIG | Maintain | Buy | 2026-02-06 |
| Canaccord Genuity | Maintain | Buy | 2026-02-04 |
| Mizuho | Maintain | Outperform | 2026-01-16 |
| TD Cowen | Maintain | Buy | 2026-01-15 |
| Citigroup | Maintain | Buy | 2025-12-22 |
| Bernstein | Maintain | Outperform | 2025-12-08 |
| Monness, Crespi, Hardt | Upgrade | Neutral | 2025-11-10 |
| Canaccord Genuity | Maintain | Buy | 2025-11-03 |
| HC Wainwright & Co. | Maintain | Buy | 2025-11-03 |
| TD Cowen | Maintain | Buy | 2025-10-31 |
Domo, Inc. Grades
This table presents institutional grades given to Domo, Inc. over the past year.
| Grading Company | Action | New Grade | Date |
|---|---|---|---|
| DA Davidson | Maintain | Neutral | 2025-12-05 |
| Lake Street | Maintain | Hold | 2025-12-05 |
| TD Cowen | Maintain | Buy | 2025-12-05 |
| DA Davidson | Maintain | Neutral | 2025-12-01 |
| JMP Securities | Maintain | Market Outperform | 2025-09-10 |
| DA Davidson | Maintain | Neutral | 2025-08-28 |
| Cantor Fitzgerald | Maintain | Overweight | 2025-08-28 |
| TD Cowen | Upgrade | Buy | 2025-08-26 |
| JMP Securities | Maintain | Market Outperform | 2025-06-25 |
| Cantor Fitzgerald | Maintain | Overweight | 2025-06-25 |
Which company has the best grades?
Strategy Inc consistently earns strong Buy and Outperform grades from multiple reputable firms. Domo, Inc. shows more mixed ratings, with several Neutral and Hold grades alongside some Buy and Outperform. Investors may view Strategy Inc’s more uniform positive outlook as a sign of stronger institutional confidence.
Risks specific to each company
The following categories identify the critical pressure points and systemic threats facing both firms in the 2026 market environment:
1. Market & Competition
Strategy Inc
- Relies heavily on Bitcoin exposure, increasing vulnerability to cryptocurrency market swings.
Domo, Inc.
- Operates in a crowded cloud BI market with intense competition from larger players.
2. Capital Structure & Debt
Strategy Inc
- Moderate debt levels with a debt-to-assets ratio of 28%, manageable but watch interest coverage.
Domo, Inc.
- High debt burden with 63% debt-to-assets ratio and negative interest coverage, signaling financial strain.
3. Stock Volatility
Strategy Inc
- Extremely volatile with beta of 3.53 and wide price range, reflecting market sensitivity.
Domo, Inc.
- Lower beta at 1.65 but still volatile; narrower price range indicates less extreme swings.
4. Regulatory & Legal
Strategy Inc
- Exposure to evolving cryptocurrency regulations in multiple jurisdictions.
Domo, Inc.
- Faces standard tech industry regulatory risks, including data privacy and compliance.
5. Supply Chain & Operations
Strategy Inc
- Operations span several regions, but dependency on tech infrastructure and AI development is critical.
Domo, Inc.
- Cloud-based platform reliant on continuous software innovation and stable internet infrastructure.
6. ESG & Climate Transition
Strategy Inc
- Limited public ESG disclosures; Bitcoin mining and treasury activity raise climate impact concerns.
Domo, Inc.
- Cloud platform with potential energy efficiency advantages, but ESG track record is unclear.
7. Geopolitical Exposure
Strategy Inc
- Global Bitcoin activity exposes firm to geopolitical risks and regulatory uncertainty worldwide.
Domo, Inc.
- Primarily US-based operations with some international presence, less exposed to geopolitical instability.
Which company shows a better risk-adjusted profile?
Strategy Inc’s greatest risk lies in its Bitcoin treasury exposure, amplifying market and regulatory volatility. Domo’s critical risk is its heavy debt load and weak liquidity, threatening solvency. Despite Strategy’s market swings, its moderate debt and stronger financial scores suggest a better overall risk-adjusted profile. Notably, Domo’s Altman Z-score in the distress zone signals heightened bankruptcy risk, underscoring caution.
Final Verdict: Which stock to choose?
Strategy Inc’s superpower lies in its strong asset utilization, driving efficiency even amid profitability challenges. Its weak liquidity profile signals a point of vigilance. This stock might appeal to investors with an appetite for aggressive growth willing to weather operational headwinds.
Domo, Inc. boasts a robust and growing moat, reflected in its exceptional return on invested capital. Its competitive advantage stems from efficient capital use and a solid strategic position. Compared to Strategy Inc, it offers better long-term stability, suiting GARP investors seeking growth tempered by reasonable valuation.
If you prioritize aggressive growth and operational leverage, Strategy Inc could be the compelling choice despite its liquidity risks. However, if you seek sustainable competitive advantage and superior capital efficiency, Domo, Inc. outshines as the safer option with a clearer path to value creation.
Disclaimer: Investment carries a risk of loss of initial capital. The past performance is not a reliable indicator of future results. Be sure to understand risks before making an investment decision.
Go Further
I encourage you to read the complete analyses of Strategy Inc and Domo, Inc. to enhance your investment decisions: