In the dynamic world of technology, Zscaler, Inc. (ZS) and StoneCo Ltd. (STNE) stand out as innovative leaders in the software infrastructure sector. Zscaler focuses on cloud security solutions, while StoneCo excels in financial technology for electronic commerce, primarily in Brazil. Their overlapping market segments and commitment to innovation make them compelling candidates for investors seeking growth in tech-driven industries. This article will help you determine which company offers the most promising investment opportunity.
Table of contents
Companies Overview
I will begin the comparison between Zscaler and StoneCo by providing an overview of these two companies and their main differences.
Zscaler Overview
Zscaler, Inc. is a cloud security company headquartered in San Jose, CA, focused on providing secure access solutions for users, servers, and IoT devices. Its platform includes Zscaler Internet Access and Private Access, designed to secure external and internal applications. The company serves diverse industries such as healthcare, finance, and telecommunications, emphasizing cloud workload segmentation and digital experience monitoring.
StoneCo Overview
StoneCo Ltd., based in George Town, Cayman Islands, delivers financial technology solutions to merchants across Brazil for in-store, online, and mobile commerce. It operates primarily through proprietary Stone Hubs and a sales force targeting small and medium-sized businesses. StoneCo serves over 1.7M clients including marketplaces and e-commerce platforms, positioning itself as a key payments infrastructure provider in the Brazilian market.
Key similarities and differences
Both Zscaler and StoneCo operate in the technology sector with a focus on software infrastructure, yet their business models significantly differ. Zscaler specializes in cloud security services globally, emphasizing application and workload protection. StoneCo concentrates on fintech solutions within Brazil, facilitating electronic commerce for merchants. While both leverage technology to enable secure transactions, Zscaler’s scope is broader across industries, and StoneCo targets regional commerce ecosystems.
Income Statement Comparison
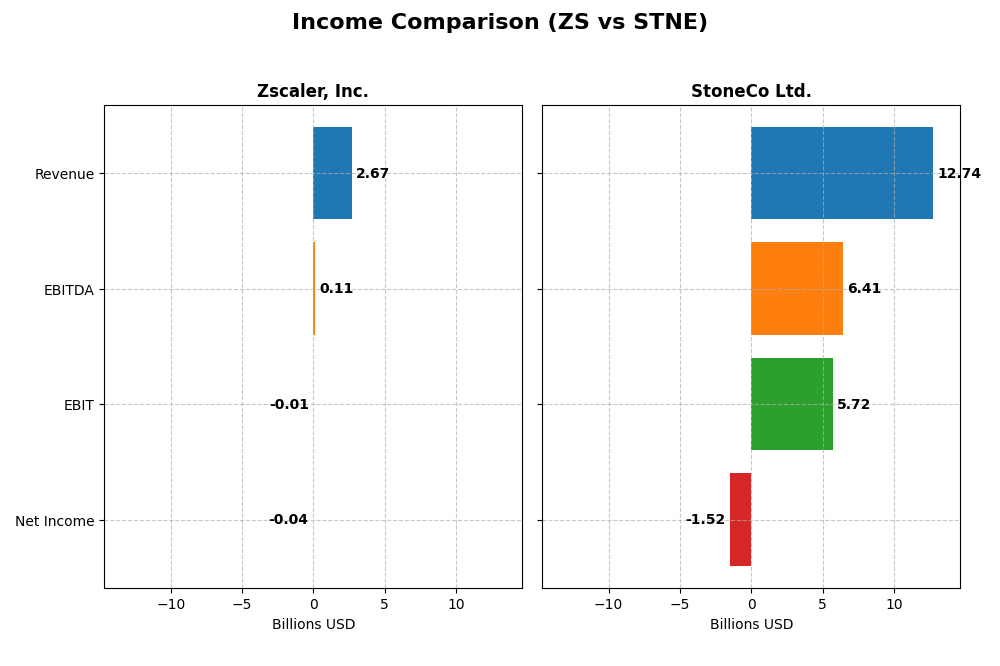
This table summarizes the latest fiscal year income statement metrics for Zscaler, Inc. and StoneCo Ltd., facilitating a clear financial comparison between these two technology infrastructure companies.
| Metric | Zscaler, Inc. (ZS) | StoneCo Ltd. (STNE) |
|---|---|---|
| Market Cap | 34.1B USD | 3.9B BRL |
| Revenue | 2.67B USD | 12.7B BRL |
| EBITDA | 112M USD | 6.41B BRL |
| EBIT | -8.8M USD | 5.72B BRL |
| Net Income | -41.5M USD | -1.52B BRL |
| EPS | -0.27 USD | -5.02 BRL |
| Fiscal Year | 2025 | 2024 |
Income Statement Interpretations
Zscaler, Inc.
Zscaler’s revenue has grown significantly from $673M in 2021 to $2.67B in 2025, with net losses narrowing from -$262M to -$41M over the same period. Gross margins remained strong around 77%, while operating and net margins stayed negative but improved notably in 2025. The latest year showed favorable revenue growth of 23.3%, margin improvement, and a 30.8% rise in EPS, indicating better operational efficiency.
StoneCo Ltd.
StoneCo’s revenue expanded from BRL 3.17B in 2020 to BRL 12.74B in 2024, yet net income declined sharply, turning negative at -BRL 1.52B in 2024 from a positive BRL 854M in 2020. Gross margins held steady around 73%, with a strong EBIT margin of 44.9%, but net margins deteriorated significantly. The recent year showed slower revenue growth (12.1%) and worsening net margin and EPS figures, signaling challenges in profitability.
Which one has the stronger fundamentals?
Zscaler demonstrates stronger fundamentals with consistent revenue and net income growth, improving margins, and a high proportion of favorable income statement metrics. StoneCo, despite solid revenue and EBIT margins, faces deteriorating net margins and earnings, with significant net losses affecting overall profitability. Zscaler’s trend towards profitability and margin improvement provides a more positive fundamental outlook.
Financial Ratios Comparison
The table below presents a side-by-side comparison of key financial ratios for Zscaler, Inc. (ZS) and StoneCo Ltd. (STNE) based on their most recent fiscal year data, facilitating an objective evaluation.
| Ratios | Zscaler, Inc. (ZS) 2025 | StoneCo Ltd. (STNE) 2024 |
|---|---|---|
| ROE | -2.31% | -12.87% |
| ROIC | -3.18% | 22.41% |
| P/E | -1063 | -9.84 |
| P/B | 24.51 | 1.27 |
| Current Ratio | 2.01 | 1.37 |
| Quick Ratio | 2.01 | 1.37 |
| D/E (Debt-to-Equity) | 1.00 | 1.10 |
| Debt-to-Assets | 28.0% | 23.5% |
| Interest Coverage | -13.49 | 5.57 |
| Asset Turnover | 0.42 | 0.23 |
| Fixed Asset Turnover | 4.22 | 6.95 |
| Payout ratio | 0 | 0 |
| Dividend yield | 0 | 0 |
Interpretation of the Ratios
Zscaler, Inc.
Zscaler shows a mixed ratio profile with a slightly unfavorable overall view. Key weaknesses include negative net margin (-1.55%) and return on equity (-2.31%), alongside unfavorable asset turnover (0.42). However, liquidity ratios such as current and quick ratios at 2.01 are favorable, indicating solid short-term financial health. Zscaler does not pay dividends, likely due to ongoing reinvestment in growth and R&D, with no share buybacks reported.
StoneCo Ltd.
StoneCo presents a slightly favorable ratio profile with strengths in return on invested capital (22.41%) and interest coverage (5.41). Despite negative net margin (-11.89%) and return on equity (-12.87%), it maintains a manageable debt-to-assets ratio (23.53%) and a low price-to-book ratio (1.27). The company does not pay dividends, reflecting a focus on reinvestment and growth, with no dividend yield or buyback activity.
Which one has the best ratios?
StoneCo’s ratios lean more favorably overall, supported by higher return on invested capital and interest coverage, despite profitability challenges. Zscaler’s liquidity is stronger, but it suffers from more unfavorable profitability and valuation ratios. Both companies currently do not distribute dividends, emphasizing growth reinvestment, making StoneCo marginally better positioned on ratio analysis.
Strategic Positioning
This section compares the strategic positioning of Zscaler and StoneCo, including their market position, key segments, and exposure to technological disruption:
Zscaler, Inc.
- Leading cloud security provider facing moderate competitive pressure in technology infrastructure.
- Key segments include cloud security services for diverse industries globally; driven by SaaS and cloud demand.
- High exposure to cloud security advancements and evolving cyber threats requiring continuous innovation.
StoneCo Ltd.
- Focused fintech provider in Brazil with intense local competition in electronic commerce solutions.
- Serves primarily small-to-medium merchants and digital platforms in Brazil; growth driven by payment solutions.
- Exposure linked to fintech innovation and digital payment technology evolution within Brazilian market.
Zscaler vs StoneCo Positioning
Zscaler offers a diversified global cloud security platform across multiple industries, while StoneCo concentrates on Brazilian fintech solutions for merchants. Zscaler’s broad industry presence balances competitive pressure; StoneCo’s local focus targets niche market growth with regional risks.
Which has the best competitive advantage?
StoneCo demonstrates a very favorable moat with ROIC above WACC and rapidly growing profitability, indicating a durable competitive advantage. Zscaler shows slightly unfavorable moat status with value destruction despite improving ROIC trends.
Stock Comparison
The stock price movements of Zscaler, Inc. and StoneCo Ltd. over the past year reveal notable bearish trends with differing volatility and volume dynamics, reflecting distinct trading pressures and market responses.
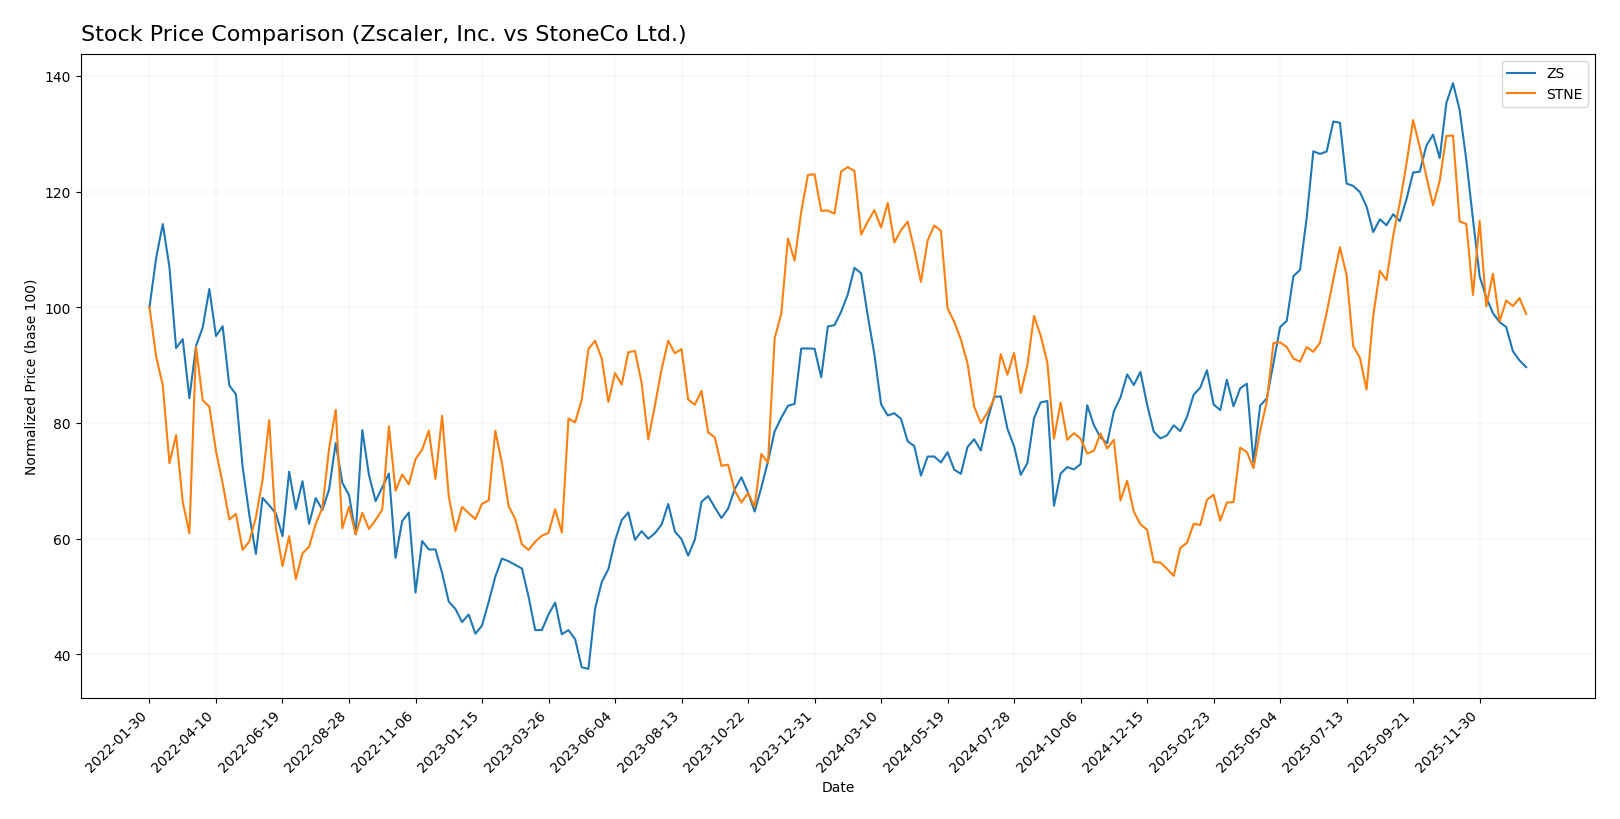
Trend Analysis
Zscaler, Inc. experienced a bearish trend with a -9.03% price change over the past 12 months, accompanied by high volatility (std deviation 47.11) and deceleration in trend momentum. The recent period showed an accelerated decline of -35.38%.
StoneCo Ltd. also displayed a bearish trend with a -13.9% price change over the same period, lower volatility (std deviation 2.92), and deceleration. Recent trading reflected a continued downward slope of -23.78%.
Comparing both, StoneCo Ltd. had a larger overall price decline than Zscaler, indicating weaker market performance over the past year.
Target Prices
The consensus target prices for Zscaler, Inc. and StoneCo Ltd. indicate distinct analyst expectations.
| Company | Target High | Target Low | Consensus |
|---|---|---|---|
| Zscaler, Inc. | 360 | 260 | 311.41 |
| StoneCo Ltd. | 20 | 20 | 20 |
Analysts expect Zscaler’s stock to rise significantly from its current price of $213.98, while StoneCo’s target price of $20 suggests moderate upside potential compared to its current $14.49.
Analyst Opinions Comparison
This section compares the analysts’ ratings and grades for Zscaler, Inc. (ZS) and StoneCo Ltd. (STNE):
Rating Comparison
ZS Rating
- Rating: C-, classified as Very Favorable by analysts.
- Discounted Cash Flow Score: 4, indicating a Favorable valuation based on cash flow projections.
- ROE Score: 1, considered Very Unfavorable, showing weak profit generation from equity.
- ROA Score: 1, Very Unfavorable, suggesting inefficient asset utilization.
- Debt To Equity Score: 1, Very Unfavorable, signaling higher financial risk.
- Overall Score: 1, rated Very Unfavorable overall.
STNE Rating
- Rating: C, also classified as Very Favorable by analysts.
- Discounted Cash Flow Score: 3, reflecting a Moderate valuation assessment.
- ROE Score: 1, also Very Unfavorable, indicating poor equity profit generation.
- ROA Score: 1, Very Unfavorable, also indicating poor asset utilization.
- Debt To Equity Score: 1, Very Unfavorable, similarly indicating elevated risk.
- Overall Score: 2, rated Moderate overall.
Which one is the best rated?
Based strictly on the provided data, STNE holds a slightly better overall score (2 Moderate) compared to ZS’s overall score (1 Very Unfavorable), despite both sharing very unfavorable scores in ROE, ROA, and Debt to Equity.
Scores Comparison
Here is a comparison of the Altman Z-Score and Piotroski Score for both companies:
Zscaler Scores
- Altman Z-Score: 4.89 indicating a safe zone, low bankruptcy risk.
- Piotroski Score: 3, classified as very weak financial health.
StoneCo Scores
- Altman Z-Score: 1.02 indicating distress zone, high bankruptcy risk.
- Piotroski Score: 5, classified as average financial health.
Which company has the best scores?
Zscaler has a much stronger Altman Z-Score, placing it in the safe zone, while StoneCo is in distress. StoneCo’s Piotroski score is higher but still average, exceeding Zscaler’s very weak score.
Grades Comparison
Here is a detailed comparison of the latest grades assigned to Zscaler, Inc. and StoneCo Ltd. by reputable grading companies:
Zscaler, Inc. Grades
The table below shows recent grades from established financial institutions for Zscaler, Inc.:
| Grading Company | Action | New Grade | Date |
|---|---|---|---|
| Citigroup | Maintain | Buy | 2026-01-13 |
| Keybanc | Maintain | Overweight | 2026-01-12 |
| Piper Sandler | Maintain | Neutral | 2026-01-05 |
| RBC Capital | Maintain | Outperform | 2026-01-05 |
| Mizuho | Upgrade | Outperform | 2025-12-16 |
| Bernstein | Downgrade | Market Perform | 2025-12-01 |
| Citigroup | Maintain | Buy | 2025-12-01 |
| JP Morgan | Maintain | Overweight | 2025-11-26 |
| Baird | Maintain | Outperform | 2025-11-26 |
| BTIG | Maintain | Buy | 2025-11-26 |
Zscaler, Inc.’s grades show a generally positive trend, with multiple “Buy,” “Overweight,” and “Outperform” ratings and only one recent downgrade to “Market Perform.”
StoneCo Ltd. Grades
The table below displays recent grades from recognized financial firms for StoneCo Ltd.:
| Grading Company | Action | New Grade | Date |
|---|---|---|---|
| Goldman Sachs | Maintain | Buy | 2025-10-14 |
| B of A Securities | Maintain | Buy | 2025-09-09 |
| UBS | Maintain | Buy | 2025-08-29 |
| JP Morgan | Maintain | Overweight | 2025-07-16 |
| Barclays | Maintain | Equal Weight | 2025-05-12 |
| Barclays | Maintain | Equal Weight | 2025-04-23 |
| Citigroup | Upgrade | Buy | 2025-04-22 |
| Barclays | Maintain | Equal Weight | 2025-03-21 |
| Morgan Stanley | Maintain | Underweight | 2025-03-21 |
| Goldman Sachs | Maintain | Buy | 2025-02-06 |
StoneCo Ltd. maintains mostly “Buy” and “Overweight” ratings but has several “Equal Weight” and one “Underweight,” reflecting a mixed but still generally positive outlook.
Which company has the best grades?
Zscaler, Inc. has received a higher concentration of positive grades, including multiple “Buy,” “Overweight,” and “Outperform” ratings, compared to StoneCo Ltd.’s more mixed ratings with several “Equal Weight” and one “Underweight.” This difference suggests Zscaler may currently have stronger analyst confidence, which could influence investor sentiment and portfolio decisions.
Strengths and Weaknesses
Below is a comparison of key strengths and weaknesses for Zscaler, Inc. (ZS) and StoneCo Ltd. (STNE) based on their latest financial and strategic metrics.
| Criterion | Zscaler, Inc. (ZS) | StoneCo Ltd. (STNE) |
|---|---|---|
| Diversification | Primarily focused on cloud security solutions; moderate product range | Focused on fintech and payment processing; limited diversification |
| Profitability | Negative net margin (-1.55%), ROIC -3.18%, shedding value | Negative net margin (-11.89%) but strong ROIC (22.41%), creating value |
| Innovation | Growing ROIC trend (+76%), indicating improving operational efficiency | Very strong ROIC growth (+371%), signaling robust innovation and scalability |
| Global presence | Global cloud security footprint with growing adoption | Mainly Brazil and Latin America market focus, regional leader |
| Market Share | Leading cloud security market player, but faces intense competition | Strong position in Brazilian fintech, fast-growing market share |
Key takeaways: Zscaler shows improving operational efficiency but still struggles with profitability and value creation. StoneCo demonstrates a durable competitive advantage with strong ROIC growth and value creation despite current margin pressures. Investors should weigh Zscaler’s growth potential against StoneCo’s regional fintech leadership and financial metrics.
Risk Analysis
The following table compares key risks for Zscaler, Inc. (ZS) and StoneCo Ltd. (STNE) based on the most recent available data:
| Metric | Zscaler, Inc. (ZS) | StoneCo Ltd. (STNE) |
|---|---|---|
| Market Risk | Beta 1.02, moderate volatility | Beta 1.84, higher volatility |
| Debt level | Debt-to-assets 28%, moderate | Debt-to-assets 24%, moderate |
| Regulatory Risk | Cloud security regulations risk | Fintech regulations in Brazil |
| Operational Risk | Cloud infrastructure reliance | Exposure to Brazilian SME market |
| Environmental Risk | Low to moderate, tech sector | Low, fintech sector |
| Geopolitical Risk | US-based, stable environment | Exposure to Brazil and Cayman Islands |
Zscaler faces moderate market and operational risks linked to cloud security and infrastructure, with a stable US regulatory environment. StoneCo carries higher market and geopolitical risks due to Brazil’s economic volatility and fintech regulatory changes. Debt levels are manageable for both, but StoneCo’s higher beta indicates greater price swings. The most impactful risk for StoneCo is geopolitical instability, while for Zscaler it is operational reliance on cloud infrastructure. Investors should weigh these factors carefully.
Which Stock to Choose?
Zscaler, Inc. (ZS) has shown strong revenue growth of 23.31% in 2025 with a favorable gross margin of 76.87%, but profitability ratios remain negative, including a net margin of -1.55% and ROE of -2.31%. Its debt level is moderate with a favorable debt-to-assets ratio of 27.98%. Despite a slightly unfavorable overall financial ratio evaluation, ZS displays a growing ROIC though it is below WACC, indicating value destruction.
StoneCo Ltd. (STNE) posted a positive EBIT margin of 44.86% and a favorable ROIC above WACC by 11.7%, signaling value creation. However, it suffers from a negative net margin of -11.89% and ROE of -12.87%. Its financial ratios appear slightly favorable overall, supported by a moderate debt-to-assets ratio of 23.53%. The company’s financial health is challenged by a distress-level Altman Z-Score.
Which stock is the most favorable for an investor could depend on the risk profile and investment strategy. Investors prioritizing growth and improving profitability might find ZS’s strong income growth and improving ROIC attractive despite current losses. Conversely, those seeking firms with demonstrated value creation and stable profitability metrics may view STNE’s favorable moat and ratio profile as more appealing, though with caution given its financial distress signals.
Disclaimer: Investment carries a risk of loss of initial capital. The past performance is not a reliable indicator of future results. Be sure to understand risks before making an investment decision.
Go Further
I encourage you to read the complete analyses of Zscaler, Inc. and StoneCo Ltd. to enhance your investment decisions: