Wix.com Ltd. and StoneCo Ltd. stand out in the technology sector, both operating within software infrastructure but targeting different facets of digital commerce. Wix empowers users globally to build and manage websites with innovative cloud-based tools, while StoneCo focuses on financial technology solutions for merchants in Brazil’s growing e-commerce market. This comparison explores their market positioning and innovation strategies to help you identify which company holds greater potential for your investment portfolio.
Table of contents
Companies Overview
I will begin the comparison between Wix.com Ltd. and StoneCo Ltd. by providing an overview of these two companies and their main differences.
Wix.com Ltd. Overview
Wix.com Ltd. develops and markets a cloud-based platform that enables users worldwide to create websites and web applications. Its offerings include visual development tools, AI-driven website creation, payment solutions, and various business management applications. With approximately 222M registered users and 6M premium subscriptions, Wix holds a significant position in the software infrastructure industry, focusing on empowering businesses and individuals to establish an online presence.
StoneCo Ltd. Overview
StoneCo Ltd. provides financial technology solutions to merchants and partners in Brazil, facilitating electronic commerce across multiple sales channels. The company supports around 1.77M clients, mainly small and medium businesses, through proprietary Stone Hubs and a dedicated sales force. Operating as a subsidiary of HR Holdings, StoneCo is a key player in Brazil’s fintech sector, delivering hardware, software, and payment services to digital and physical merchants.
Key similarities and differences
Both companies operate in the technology sector, specifically within software infrastructure, and serve business clients by enabling digital commerce and operations. Wix focuses on cloud-based website and application development with global reach, while StoneCo specializes in fintech solutions tailored to the Brazilian market. Wix offers a broader suite of digital tools beyond payments, whereas StoneCo emphasizes integrated payment processing and merchant services. Their business models reflect these geographic and product-market distinctions.
Income Statement Comparison
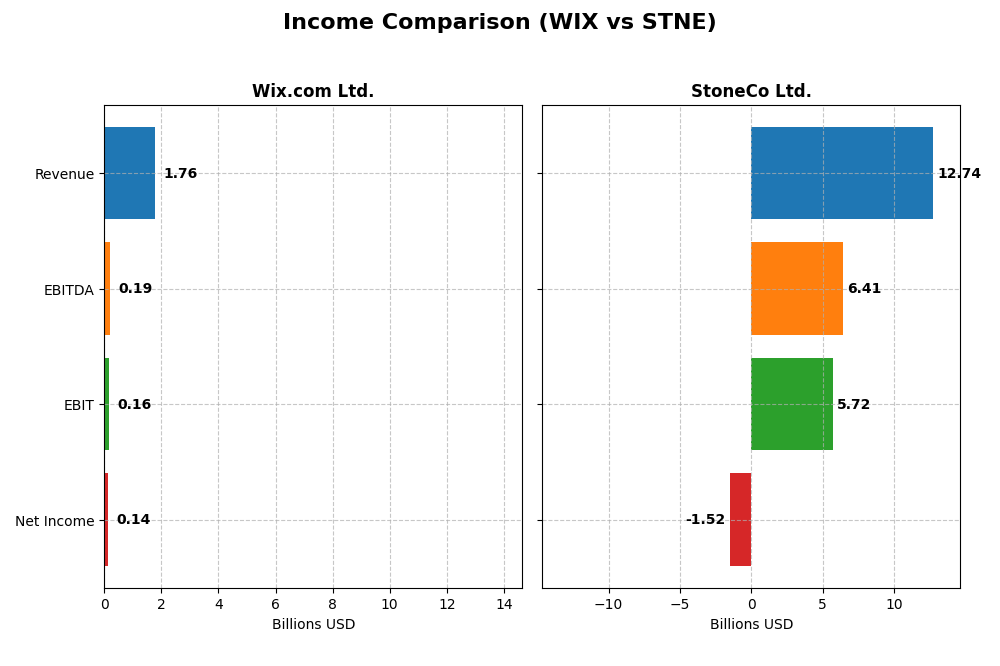
The following table compares the key income statement metrics for Wix.com Ltd. and StoneCo Ltd. for the fiscal year 2024, reflecting their financial performance in their respective reporting currencies.
| Metric | Wix.com Ltd. (USD) | StoneCo Ltd. (BRL) |
|---|---|---|
| Market Cap | 4.46B | 3.88B |
| Revenue | 1.76B | 12.74B |
| EBITDA | 186M | 6.41B |
| EBIT | 155M | 5.72B |
| Net Income | 138M | -1.52B |
| EPS | 2.49 | -5.02 |
| Fiscal Year | 2024 | 2024 |
Income Statement Interpretations
Wix.com Ltd.
Wix.com Ltd. demonstrated consistent revenue growth from 2020 to 2024, reaching $1.76B in 2024 with a 12.74% increase from the previous year. Net income improved significantly, turning positive in recent years with a 270.25% net margin growth in 2024, standing at 7.86%. Gross margins remained favorable at 67.93%, while operating expenses grew proportionally with revenue, supporting margin stability.
StoneCo Ltd.
StoneCo Ltd. showed strong revenue growth over the period, rising to BRL 12.74B in 2024 with a 12.1% increase year-over-year. Gross and EBIT margins were favorable at 73.4% and 44.86%, respectively. However, net income trends were negative, with a net margin of -11.89% and a decline in net income and EPS over the period, reflecting challenges in translating operational profitability into bottom-line results.
Which one has the stronger fundamentals?
Wix.com Ltd. exhibits stronger fundamentals with favorable trends in revenue, net income growth, and margin improvements, including a positive net margin and EPS growth. StoneCo Ltd. has favorable revenue and operational margins but faces unfavorable net income and EPS trends. Thus, Wix.com’s income statement performance appears more robust based on these financial indicators.
Financial Ratios Comparison
The table below presents a comparison of key financial ratios for Wix.com Ltd. (WIX) and StoneCo Ltd. (STNE) based on their most recent fiscal year data, helping to analyze their financial health and operational efficiency.
| Ratios | Wix.com Ltd. (WIX) 2024 | StoneCo Ltd. (STNE) 2024 |
|---|---|---|
| ROE | -1.76 | -12.87 |
| ROIC | 9.13% | 22.41% |
| P/E | 86.2 | -9.84 |
| P/B | -151.4 | 1.27 |
| Current Ratio | 0.84 | 1.37 |
| Quick Ratio | 0.84 | 1.37 |
| D/E (Debt-to-Equity) | -12.31 | 1.10 |
| Debt-to-Assets | 50.7% | 23.5% |
| Interest Coverage | 25.9 | 5.57 |
| Asset Turnover | 0.92 | 0.23 |
| Fixed Asset Turnover | 3.33 | 6.95 |
| Payout ratio | 0 | 0 |
| Dividend yield | 0 | 0 |
Interpretation of the Ratios
Wix.com Ltd.
Wix.com Ltd. shows a mixed financial profile with some favorable ratios like a strong interest coverage of 40.14 and fixed asset turnover at 3.33, but concerns arise from a low current ratio of 0.84 and a highly negative return on equity of -175.57%. The price-to-earnings ratio is elevated at 86.21, indicating potential overvaluation. Wix does not pay dividends, reflecting a reinvestment strategy likely focused on growth and R&D, with no dividend yield or payout risks.
StoneCo Ltd.
StoneCo Ltd. displays a more favorable ratio balance, including a solid return on invested capital of 22.41%, a moderate debt-to-assets ratio of 23.53%, and an interest coverage of 5.41. However, it struggles with a negative net margin of -11.89% and return on equity at -12.87%. StoneCo also does not pay dividends, which may be due to ongoing investments or a growth phase, with no dividend yield or distribution concerns.
Which one has the best ratios?
StoneCo Ltd. holds a slightly favorable overall ratios opinion, supported by better leverage, coverage ratios, and return on invested capital. Wix.com Ltd. has a slightly unfavorable stance, hindered by liquidity issues and a severely negative return on equity despite some operational strengths. Therefore, StoneCo’s ratios appear comparatively stronger based on the latest evaluations.
Strategic Positioning
This section compares the strategic positioning of Wix.com Ltd. and StoneCo Ltd., including their market position, key segments, and exposure to technological disruption:
Wix.com Ltd.
- Market position and competitive pressure: Operates globally with a cloud website platform, facing tech sector competition.
- Key segments and business drivers: Creative subscription and business solutions drive revenue, with diverse SaaS offerings.
- Exposure to technological disruption: Offers AI-based tools and payment platforms, adapting with evolving web tech.
StoneCo Ltd.
- Focused on Brazilian fintech market, serving 1.7M clients, with competitive pressure in local payments.
- Provides fintech solutions to merchants, emphasizing in-store, online, and mobile electronic commerce.
- Relies on proprietary Stone Hubs and digital sales, vulnerable to fintech innovation and regulation.
Wix.com Ltd. vs StoneCo Ltd. Positioning
Wix.com adopts a diversified global SaaS approach with multiple product lines, whereas StoneCo focuses on a concentrated fintech market in Brazil. Wix benefits from broad digital tools, while StoneCo leverages local merchant services but faces concentrated market risks.
Which has the best competitive advantage?
StoneCo shows a very favorable moat with value creation and strong ROIC growth, indicating a durable competitive advantage. Wix is slightly unfavorable, shedding value despite growing profitability, reflecting weaker competitive strength.
Stock Comparison
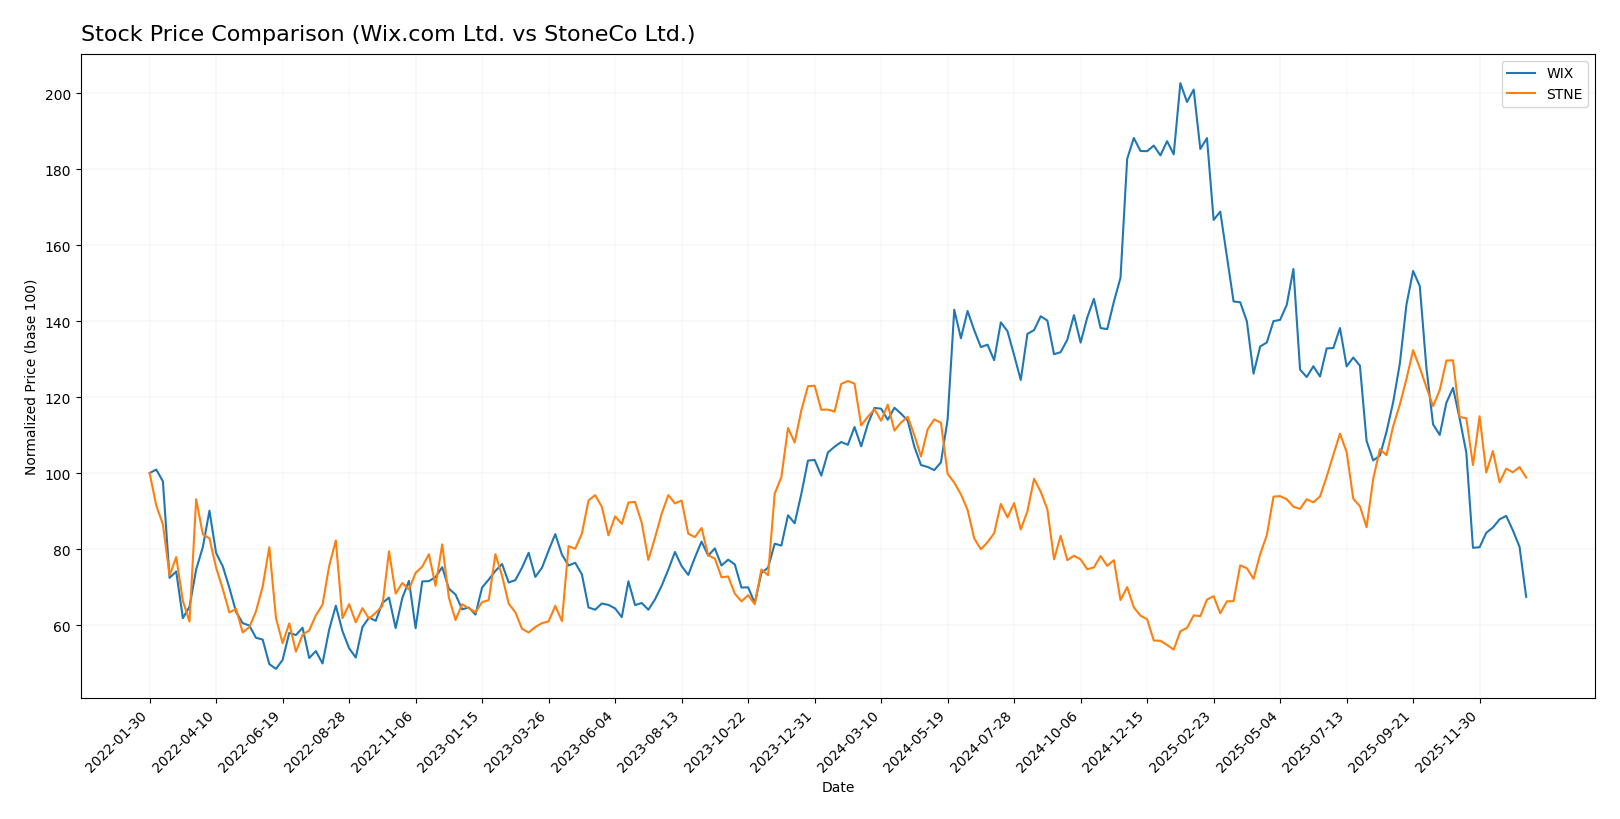
The stock price movements of Wix.com Ltd. and StoneCo Ltd. over the past year reveal pronounced bearish trends with notable declines and decelerating momentum in their trading dynamics.
Trend Analysis
Wix.com Ltd. experienced a bearish trend with a 40.28% price decline over the past 12 months, showing deceleration and high volatility with a standard deviation of 34.39. The stock’s price ranged between 240.89 and 80.16.
StoneCo Ltd. also exhibited a bearish trend, declining 13.9% over the last year with decelerating momentum. Its price volatility was significantly lower, with a standard deviation of 2.92 and a range from 19.4 to 7.85.
Comparing both stocks, Wix.com Ltd. showed the larger percentage loss and greater volatility, while StoneCo Ltd. delivered the higher relative market performance despite its negative trend.
Target Prices
Here is the current consensus on target prices from verified analysts for Wix.com Ltd. and StoneCo Ltd.
| Company | Target High | Target Low | Consensus |
|---|---|---|---|
| Wix.com Ltd. | 210 | 70 | 160.27 |
| StoneCo Ltd. | 20 | 20 | 20 |
Analysts expect Wix.com Ltd. shares to appreciate significantly from the current price of $80.16 toward the consensus target of $160.27. StoneCo Ltd., trading at $14.49, has a stable target consensus of $20, indicating moderate upside potential.
Analyst Opinions Comparison
This section compares analysts’ ratings and grades for Wix.com Ltd. and StoneCo Ltd.:
Rating Comparison
WIX Rating
- Rating: C with a “Very Favorable” status.
- Discounted Cash Flow Score: 3, considered Moderate.
- ROE Score: 1, rated Very Unfavorable.
- ROA Score: 4, rated Favorable.
- Debt To Equity Score: 1, rated Very Unfavorable.
- Overall Score: 2, rated Moderate.
STNE Rating
- Rating: C with a “Very Favorable” status.
- Discounted Cash Flow Score: 3, considered Moderate.
- ROE Score: 1, rated Very Unfavorable.
- ROA Score: 1, rated Very Unfavorable.
- Debt To Equity Score: 1, rated Very Unfavorable.
- Overall Score: 2, rated Moderate.
Which one is the best rated?
Both companies share the same overall rating of C and identical scores in discounted cash flow, ROE, debt to equity, and overall score. However, Wix shows a more favorable return on assets score, making it slightly better rated in asset efficiency.
Scores Comparison
Here is a comparison of the Altman Z-Score and Piotroski Score for Wix.com Ltd. and StoneCo Ltd.:
WIX Scores
- Altman Z-Score: 1.83, in the grey zone indicating moderate bankruptcy risk.
- Piotroski Score: 6, rated average for financial strength.
STNE Scores
- Altman Z-Score: 1.02, in the distress zone indicating high bankruptcy risk.
- Piotroski Score: 5, rated average for financial strength.
Which company has the best scores?
Wix.com Ltd. shows a higher Altman Z-Score in the grey zone compared to StoneCo’s distress zone, and a slightly better Piotroski Score. Based strictly on these scores, Wix.com Ltd. exhibits relatively stronger financial health.
Grades Comparison
This section compares the latest grades assigned to Wix.com Ltd. and StoneCo Ltd. by reputable grading companies:
Wix.com Ltd. Grades
The table below summarizes recent grades from leading financial institutions for Wix.com Ltd.:
| Grading Company | Action | New Grade | Date |
|---|---|---|---|
| Morgan Stanley | Maintain | Overweight | 2026-01-15 |
| Wells Fargo | Maintain | Overweight | 2025-12-19 |
| Cantor Fitzgerald | Maintain | Overweight | 2025-12-11 |
| Wells Fargo | Maintain | Overweight | 2025-11-20 |
| Barclays | Maintain | Overweight | 2025-11-20 |
| Citizens | Maintain | Market Outperform | 2025-11-20 |
| Citigroup | Maintain | Buy | 2025-11-20 |
| Scotiabank | Maintain | Sector Outperform | 2025-11-20 |
| Needham | Maintain | Buy | 2025-11-20 |
| Evercore ISI Group | Maintain | Outperform | 2025-11-20 |
Wix.com Ltd. consistently receives positive grades with strong buy-side and outperform recommendations, reflecting a generally bullish outlook.
StoneCo Ltd. Grades
The table below shows the most recent grades from recognized financial firms for StoneCo Ltd.:
| Grading Company | Action | New Grade | Date |
|---|---|---|---|
| Goldman Sachs | Maintain | Buy | 2025-10-14 |
| B of A Securities | Maintain | Buy | 2025-09-09 |
| UBS | Maintain | Buy | 2025-08-29 |
| JP Morgan | Maintain | Overweight | 2025-07-16 |
| Barclays | Maintain | Equal Weight | 2025-05-12 |
| Barclays | Maintain | Equal Weight | 2025-04-23 |
| Citigroup | Upgrade | Buy | 2025-04-22 |
| Barclays | Maintain | Equal Weight | 2025-03-21 |
| Morgan Stanley | Maintain | Underweight | 2025-03-21 |
| Goldman Sachs | Maintain | Buy | 2025-02-06 |
StoneCo Ltd. presents a mixed grading profile with several buy ratings alongside equal weight and one underweight, indicating more varied analyst views.
Which company has the best grades?
Wix.com Ltd. holds the stronger consensus with predominantly “Overweight,” “Buy,” and “Outperform” grades, signaling confidence from multiple analysts. StoneCo Ltd. shows more divergent ratings, including “Equal Weight” and “Underweight,” suggesting greater uncertainty. This variance could affect investor perception of relative risk and growth potential between the two companies.
Strengths and Weaknesses
Below is a comparison table outlining the key strengths and weaknesses of Wix.com Ltd. (WIX) and StoneCo Ltd. (STNE) based on the most recent financial and operational data available.
| Criterion | Wix.com Ltd. (WIX) | StoneCo Ltd. (STNE) |
|---|---|---|
| Diversification | Moderate: Revenue split between Business Solutions (≈496M USD) and Creative Subscription (≈1.26B USD) | Limited: Primarily focused on payment processing and financial technology services |
| Profitability | Neutral to slightly unfavorable: ROIC 9.13% close to WACC 9.35%, net margin 7.86%, but negative ROE (-175.57%) | Favorable: Strong ROIC 22.41% above WACC 10.68%, but net margin negative (-11.89%) and negative ROE (-12.87%) |
| Innovation | Growing ROIC trend (+159%) indicates improving operational efficiency and innovation | Very strong ROIC growth (+371%), signaling rapid innovation and scaling |
| Global presence | Strong global presence through cloud-based platform accessible worldwide | Mainly regional with focus on Brazil and Latin America markets |
| Market Share | Established in website creation and online business tools | Growing market share in Latin American fintech but still developing |
Key takeaways: StoneCo shows a very favorable moat with high and growing ROIC, reflecting strong value creation despite current profitability challenges. Wix demonstrates moderate diversification and a growing profitability trend, but value destruction persists, signaling caution for investors. Both companies present growth potential, with StoneCo leading in operational efficiency and innovation.
Risk Analysis
Below is a comparative overview of key risks faced by Wix.com Ltd. (WIX) and StoneCo Ltd. (STNE) based on the most recent 2024 data:
| Metric | Wix.com Ltd. (WIX) | StoneCo Ltd. (STNE) |
|---|---|---|
| Market Risk | Beta 1.42, high volatility risk due to tech sector exposure | Beta 1.84, higher volatility, sensitive to Brazil’s market fluctuations |
| Debt level | Debt to assets 50.7% (unfavorable), but strong interest coverage (40.1x) | Debt to assets 23.5% (favorable), moderate interest coverage (5.4x) |
| Regulatory Risk | Moderate, global cloud platform compliance challenges | Elevated, due to Brazil’s evolving fintech regulations and currency risks |
| Operational Risk | Platform complexity and user growth scaling | Reliance on local infrastructure and payment ecosystem stability |
| Environmental Risk | Low direct impact, technology sector | Low direct impact, fintech sector |
| Geopolitical Risk | Exposure to Israel and global markets | Exposure to Brazil and Caribbean regulatory environment |
Wix faces significant market and debt-related risks, with a high debt ratio but strong interest coverage providing some cushion. StoneCo, while better positioned on debt, carries higher geopolitical and regulatory risks linked to Brazil’s environment. The most impactful risks are Wix’s debt burden and market volatility, and StoneCo’s regulatory challenges and geopolitical exposure. Investors should weigh these carefully alongside growth prospects.
Which Stock to Choose?
Wix.com Ltd. (WIX) shows favorable income growth with a 12.74% revenue increase in 2024 and strong net margin improvement. Financial ratios are slightly unfavorable overall, with high EV/EBITDA and negative ROE, but good interest coverage and fixed asset turnover. The company carries moderate debt and holds a very favorable rating.
StoneCo Ltd. (STNE) displays solid revenue growth of 12.1% and a favorable EBIT margin, but a negative net margin and declining EPS. Its financial ratios are slightly favorable, supported by a strong ROIC exceeding WACC, moderate debt levels, and a very favorable rating despite some profitability challenges.
Investors focused on value creation might find StoneCo’s very favorable moat status and improving ROIC appealing, while those prioritizing income growth and improving margins could see Wix as more aligned with their goals. Risk-averse investors may prefer StoneCo’s stronger balance sheet and favorable financial ratios, whereas risk-tolerant profiles might consider Wix’s income momentum despite mixed ratios.
Disclaimer: Investment carries a risk of loss of initial capital. The past performance is not a reliable indicator of future results. Be sure to understand risks before making an investment decision.
Go Further
I encourage you to read the complete analyses of Wix.com Ltd. and StoneCo Ltd. to enhance your investment decisions: