In the evolving world of financial technology and artificial intelligence, StoneCo Ltd. (STNE) and Veritone, Inc. (VERI) stand out as innovative players within the software infrastructure industry. StoneCo drives electronic commerce solutions primarily in Brazil, while Veritone leverages AI to extract insights from complex data across multiple sectors. This comparison explores their market strategies and growth potential to help you decide which company deserves a place in your investment portfolio.
Table of contents
Companies Overview
I will begin the comparison between StoneCo Ltd. and Veritone, Inc. by providing an overview of these two companies and their main differences.
StoneCo Ltd. Overview
StoneCo Ltd. provides financial technology solutions enabling merchants and integrated partners to conduct electronic commerce across in-store, online, and mobile channels in Brazil. The company primarily serves small and medium-sized businesses, marketplaces, and e-commerce platforms through proprietary Stone Hubs and direct sales efforts. Founded in 2000 and headquartered in the Cayman Islands, StoneCo operates as a subsidiary of HR Holdings, LLC.
Veritone, Inc. Overview
Veritone, Inc. offers artificial intelligence computing solutions through its aiWARE platform, which applies machine learning and cognitive processes to extract insights from structured and unstructured data. The company serves multiple verticals including media, government, legal, and energy markets, providing both AI technology and media advertising agency services. Veritone was incorporated in 2014 and is based in Denver, Colorado.
Key similarities and differences
Both StoneCo and Veritone operate within the technology sector focusing on software infrastructure, but their business models diverge significantly. StoneCo’s core is financial technology for commerce in Brazil, targeting merchants and platforms, while Veritone specializes in AI-driven data analytics and media services across diverse industries in the US and UK. They differ in scale, with StoneCo having a larger market cap and employee base compared to Veritone.
Income Statement Comparison
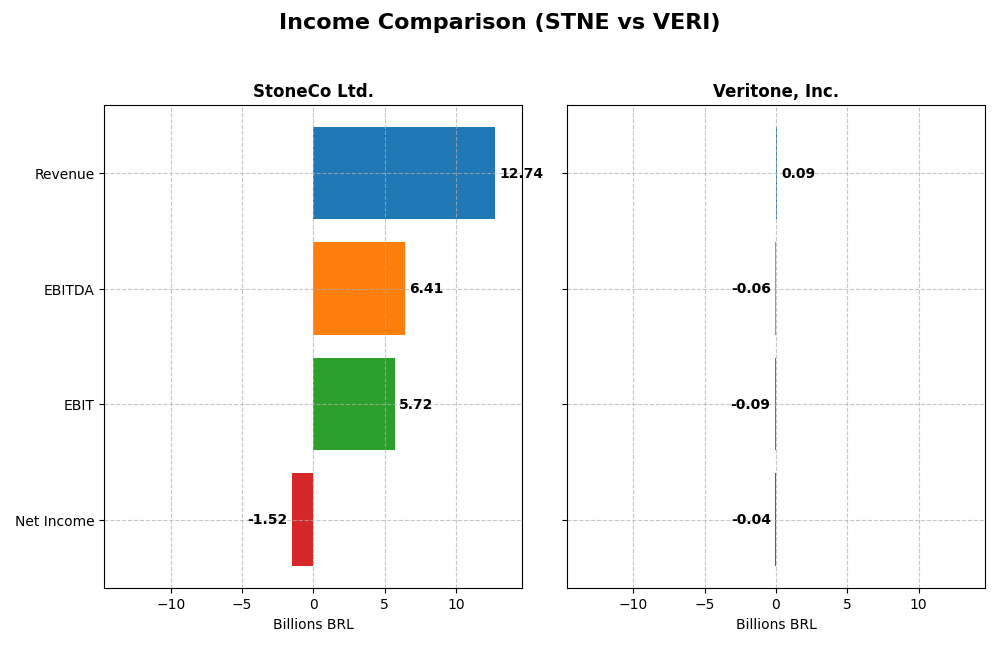
The table below compares key income statement metrics for StoneCo Ltd. and Veritone, Inc. for the fiscal year 2024, providing a clear snapshot of their financial performance.
| Metric | StoneCo Ltd. (STNE) | Veritone, Inc. (VERI) |
|---|---|---|
| Market Cap | 3.9B BRL | 225M USD |
| Revenue | 12.7B BRL | 92.6M USD |
| EBITDA | 6.4B BRL | -58.8M USD |
| EBIT | 5.7B BRL | -88.1M USD |
| Net Income | -1.5B BRL | -37.4M USD |
| EPS | -5.02 BRL | -0.98 USD |
| Fiscal Year | 2024 | 2024 |
Income Statement Interpretations
StoneCo Ltd.
StoneCo Ltd. experienced strong revenue growth of 302% from 2020 to 2024, reaching BRL 12.7B in 2024. Despite favorable gross and EBIT margins at 73.4% and 44.86% respectively, the net margin turned negative to -11.89%, driven by significant other expenses and interest costs. In 2024, revenue grew 12.1% year-over-year, but net income declined sharply, reflecting margin pressure.
Veritone, Inc.
Veritone’s revenue grew 60.5% over 2020-2024 but declined 7.35% in 2024 to USD 92.6M. Gross margin remained favorable at 70.6%, though EBIT margin was deeply negative at -95.13%. Net margin improved to -40.36%, supported by better net income growth overall. Despite recent revenue contraction, Veritone demonstrated positive earnings per share growth and margin improvement last year.
Which one has the stronger fundamentals?
StoneCo shows robust top-line expansion and strong gross and operating profitability but suffers from negative net margins and net income losses recently. Veritone, while smaller and less profitable at the operating level, has shown improving net margin trends and positive EPS growth despite revenue decline. Both have mixed strengths, with StoneCo excelling in scale and Veritone showing margin recovery.
Financial Ratios Comparison
The table below presents key financial ratios for StoneCo Ltd. (STNE) and Veritone, Inc. (VERI) based on their most recent fiscal year 2024 data, facilitating a side-by-side analysis.
| Ratios | StoneCo Ltd. (STNE) | Veritone, Inc. (VERI) |
|---|---|---|
| ROE | -12.87% | -277.91% |
| ROIC | 22.41% | -58.27% |
| P/E | -9.84 | -3.34 |
| P/B | 1.27 | 9.27 |
| Current Ratio | 1.37 | 0.97 |
| Quick Ratio | 1.37 | 0.97 |
| D/E (Debt-to-Equity) | 1.10 | 8.91 |
| Debt-to-Assets | 23.53% | 60.54% |
| Interest Coverage | 5.57 | -7.31 |
| Asset Turnover | 0.23 | 0.47 |
| Fixed Asset Turnover | 6.95 | 8.51 |
| Payout Ratio | 0 | 0 |
| Dividend Yield | 0 | 0 |
Interpretation of the Ratios
StoneCo Ltd.
StoneCo Ltd. shows a mixed financial profile with half of its ratios favorable, including a strong return on invested capital (22.41%) and good interest coverage (5.41), but faces challenges such as negative net margin (-11.89%) and return on equity (-12.87%). Its quick ratio is solid at 1.37, indicating adequate liquidity. The company does not pay dividends, likely reinvesting earnings to support growth and operations.
Veritone, Inc.
Veritone exhibits predominantly weak ratios with a very unfavorable overall evaluation. Key concerns include a deeply negative net margin (-40.36%), return on equity (-277.91%), and return on invested capital (-58.27%). Liquidity is tight, with a current ratio below 1 (0.97), and debt levels are high (debt-to-equity 8.91). Veritone also does not pay dividends, possibly prioritizing R&D and expansion efforts amid losses.
Which one has the best ratios?
StoneCo Ltd. presents a more balanced and slightly favorable ratio profile compared to Veritone, Inc., which struggles with many unfavorable metrics. StoneCo’s stronger capital returns and liquidity contrast with Veritone’s high leverage and negative profitability, suggesting StoneCo currently maintains a more stable financial footing.
Strategic Positioning
This section compares the strategic positioning of StoneCo Ltd. and Veritone, Inc., focusing on market position, key segments, and exposure to technological disruption:
StoneCo Ltd.
- Leading fintech provider in Brazil with 1.77M clients, facing competitive pressure in local payments market.
- Focused on financial technology solutions for merchants, e-commerce, and digital platforms in Brazil.
- Operates in fintech with limited direct exposure to AI-driven disruption but reliant on technology adoption.
Veritone, Inc.
- Small AI software infrastructure firm serving diverse verticals amid high competition and volatility.
- Generates revenue from AI platform licenses, managed services, software products, and advertising.
- AI-centric business exposed directly to technological disruption and innovation in machine learning.
StoneCo Ltd. vs Veritone, Inc. Positioning
StoneCo presents a concentrated fintech strategy targeting Brazilian merchants, benefiting from large client base and local market expertise. Veritone pursues a diversified AI platform approach across multiple sectors, which adds complexity but broadens potential revenue streams.
Which has the best competitive advantage?
StoneCo demonstrates a strong and durable competitive advantage with growing profitability and efficient capital use. Veritone shows declining returns and value destruction, indicating a weaker competitive moat over the evaluated period.
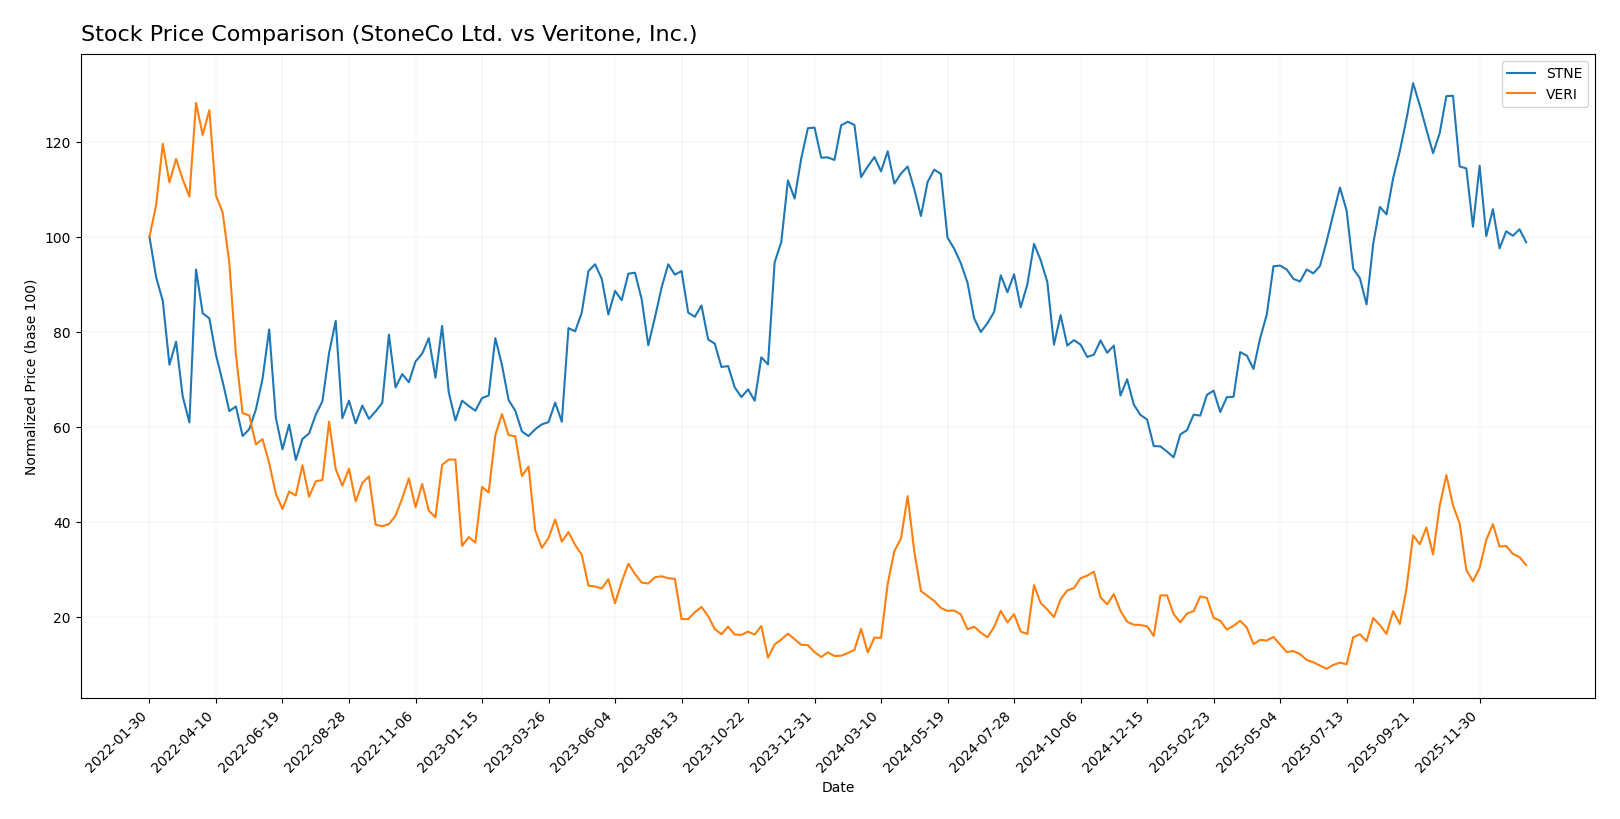
Stock Comparison
The stock price movements of StoneCo Ltd. and Veritone, Inc. over the past 12 months reveal contrasting trends, with StoneCo experiencing a notable decline and Veritone showing strong gains before a recent slowdown in momentum.
Trend Analysis
StoneCo Ltd. recorded a bearish trend over the past year with a -13.9% price change, exhibiting deceleration and a high volatility level with a standard deviation of 2.92. The stock ranged between 7.85 and 19.4 during this period.
Veritone, Inc. showed a bullish trend with a 147.22% increase over the same 12 months but with deceleration and lower volatility (std deviation 1.26). The stock’s price fluctuated between 1.3 and 7.18.
Comparing both, Veritone delivered the highest market performance over the past year, outperforming StoneCo despite recent short-term declines for both stocks.
Target Prices
The current analyst consensus provides clear target price expectations for both StoneCo Ltd. and Veritone, Inc.
| Company | Target High | Target Low | Consensus |
|---|---|---|---|
| StoneCo Ltd. | 20 | 20 | 20 |
| Veritone, Inc. | 10 | 9 | 9.5 |
Analysts expect StoneCo Ltd.’s stock to appreciate from its current price of 14.49 USD to 20 USD, indicating significant upside potential. Veritone, Inc.’s consensus target of 9.5 USD also suggests a notable increase from its current 4.45 USD price, reflecting optimistic market sentiment.
Analyst Opinions Comparison
This section compares the analysts’ ratings and grades for StoneCo Ltd. and Veritone, Inc.:
Rating Comparison
StoneCo Ltd. Rating
- Rating: C, classified as Very Favorable overall.
- Discounted Cash Flow Score: 3, indicating Moderate value based on future cash flows.
- ROE Score: 1, considered Very Unfavorable for profit generation efficiency.
- ROA Score: 1, very unfavorable in asset utilization effectiveness.
- Debt To Equity Score: 1, signifying Very Unfavorable financial risk profile.
- Overall Score: 2, rated Moderate overall financial standing.
Veritone, Inc. Rating
- Rating: C, also classified as Very Favorable overall.
- Discounted Cash Flow Score: 5, indicating a Very Favorable valuation based on future cash flows.
- ROE Score: 1, also Very Unfavorable for profit generation efficiency.
- ROA Score: 1, similarly Very Unfavorable in asset utilization effectiveness.
- Debt To Equity Score: 1, also reflecting Very Unfavorable financial risk profile.
- Overall Score: 2, also rated Moderate in overall financial standing.
Which one is the best rated?
Both StoneCo Ltd. and Veritone, Inc. share the same letter rating (C) and overall score (2), categorized as Moderate. Veritone has a notably higher Discounted Cash Flow Score, but all other key financial scores are identical and Very Unfavorable, making their ratings effectively comparable.
Scores Comparison
The following table compares the Altman Z-Score and Piotroski Score for StoneCo Ltd. and Veritone, Inc.:
STNE Scores
- Altman Z-Score: 1.02, in distress zone, indicating high bankruptcy risk.
- Piotroski Score: 5, average financial strength.
VERI Scores
- Altman Z-Score: -0.07, in distress zone, indicating high bankruptcy risk.
- Piotroski Score: 3, very weak financial strength.
Which company has the best scores?
Based strictly on the provided data, STNE has a higher Piotroski Score (5 vs. 3) indicating stronger financial health, though both are in the distress zone for Altman Z-Score.
Grades Comparison
Here is the comparison of the most recent grades assigned to StoneCo Ltd. and Veritone, Inc.:
StoneCo Ltd. Grades
This table shows recent grades for StoneCo Ltd. from reputable financial institutions.
| Grading Company | Action | New Grade | Date |
|---|---|---|---|
| Goldman Sachs | Maintain | Buy | 2025-10-14 |
| B of A Securities | Maintain | Buy | 2025-09-09 |
| UBS | Maintain | Buy | 2025-08-29 |
| JP Morgan | Maintain | Overweight | 2025-07-16 |
| Barclays | Maintain | Equal Weight | 2025-05-12 |
| Barclays | Maintain | Equal Weight | 2025-04-23 |
| Citigroup | Upgrade | Buy | 2025-04-22 |
| Barclays | Maintain | Equal Weight | 2025-03-21 |
| Morgan Stanley | Maintain | Underweight | 2025-03-21 |
| Goldman Sachs | Maintain | Buy | 2025-02-06 |
StoneCo Ltd. shows a generally positive trend with a majority of buy ratings and some equal weight and underweight assessments.
Veritone, Inc. Grades
Below are the recent grades for Veritone, Inc. by recognized grading companies.
| Grading Company | Action | New Grade | Date |
|---|---|---|---|
| D. Boral Capital | Maintain | Buy | 2025-12-09 |
| D. Boral Capital | Maintain | Buy | 2025-12-04 |
| Needham | Maintain | Buy | 2025-12-02 |
| D. Boral Capital | Maintain | Buy | 2025-12-02 |
| D. Boral Capital | Maintain | Buy | 2025-11-07 |
| D. Boral Capital | Maintain | Buy | 2025-10-28 |
| HC Wainwright & Co. | Maintain | Buy | 2025-10-20 |
| D. Boral Capital | Maintain | Buy | 2025-10-15 |
| D. Boral Capital | Maintain | Buy | 2025-09-24 |
| D. Boral Capital | Maintain | Buy | 2025-09-09 |
Veritone, Inc. has a consistent pattern of buy ratings with no downgrades reported.
Which company has the best grades?
Both StoneCo Ltd. and Veritone, Inc. hold a consensus “Buy” rating, but Veritone’s grades demonstrate a stronger uniformity in buy recommendations. This consistent positive outlook could suggest steadier analyst confidence compared to StoneCo, which shows more mixed ratings including hold and underweight. Investors might interpret this as Veritone having a clearer bullish consensus.
Strengths and Weaknesses
Below is a comparison of StoneCo Ltd. (STNE) and Veritone, Inc. (VERI) based on key investment criteria derived from the latest financial and operational data.
| Criterion | StoneCo Ltd. (STNE) | Veritone, Inc. (VERI) |
|---|---|---|
| Diversification | Moderate; focused on fintech services in Latin America | High; diverse AI-driven software, licensing, and services |
| Profitability | Mixed; unfavorable net margin (-11.89%), but favorable ROIC (22.41%) | Weak; highly negative net margin (-40.36%) and ROIC (-58.27%) |
| Innovation | Strong; demonstrated by growing ROIC and competitive advantage | Moderate; broad AI product portfolio but declining profitability |
| Global presence | Concentrated in Latin America | Broader U.S. and international AI market exposure |
| Market Share | Significant in Brazilian fintech segment | Niche player in AI software and services |
Key takeaways: StoneCo shows a durable competitive advantage with efficient capital use and growing profitability despite some margin pressures. Veritone faces significant profitability challenges and declining returns, signaling high risk despite diversification and innovation efforts. Investors should weigh StoneCo’s value creation against Veritone’s ongoing financial difficulties.
Risk Analysis
The table below summarizes key risks for StoneCo Ltd. (STNE) and Veritone, Inc. (VERI) based on their 2024 financial and operational data:
| Metric | StoneCo Ltd. (STNE) | Veritone, Inc. (VERI) |
|---|---|---|
| Market Risk | High beta (1.835) indicates elevated sensitivity to market fluctuations. | Very high beta (2.052) increases exposure to market volatility. |
| Debt Level | Moderate debt-to-equity ratio (1.1) with manageable interest coverage (5.41). | Very high debt-to-equity ratio (8.91) and negative interest coverage (-7.3) signal financial distress. |
| Regulatory Risk | Operating in Brazil with potential exposure to local fintech regulations. | US and UK operations subject to AI and data privacy regulations, which can evolve rapidly. |
| Operational Risk | Large client base (~1.77M) but challenged by negative net margin (-11.89%) and ROE (-12.87%). | Smaller scale with negative profitability margins (-40.36%) and weak operational efficiency. |
| Environmental Risk | Moderate, with no specific disclosures; fintech sector typically has low direct environmental impact. | Low direct environmental risk, but AI sector faces scrutiny on energy use and sustainability. |
| Geopolitical Risk | Based in Cayman Islands but primary market Brazil may face political and economic instability. | US-based, exposed to geopolitical tensions impacting tech and AI sectors. |
StoneCo’s key risks involve market volatility and moderate leverage, though its operational scale offers some resilience. Veritone faces more severe financial distress with high debt and poor profitability, increasing bankruptcy risk. Regulatory and geopolitical uncertainties remain notable for both, especially in evolving fintech and AI landscapes.
Which Stock to Choose?
StoneCo Ltd. (STNE) shows favorable income growth, with revenue up 12.1% in 2024 and strong gross and EBIT margins, despite negative net margin and ROE. Its financial ratios are slightly favorable, demonstrating solid ROIC above WACC and manageable debt levels. The company holds a very favorable moat status and a moderate overall rating.
Veritone, Inc. (VERI) exhibits a favorable long-term income growth but recent declines in revenue and gross profit. Its financial ratios are very unfavorable, with significant negative profitability metrics and high debt burden. VERI’s economic moat is very unfavorable, reflecting value destruction, although it maintains a moderate overall rating with a very favorable DCF score.
Investors focused on durable competitive advantages and value creation might find StoneCo Ltd. more aligned with stability and profitability metrics. Conversely, those with a higher risk tolerance seeking potential turnaround opportunities despite financial challenges could interpret Veritone’s profile differently. Each company’s income statement trends and financial ratios suggest distinct risk and growth profiles that may appeal variably depending on investment strategy.
Disclaimer: Investment carries a risk of loss of initial capital. The past performance is not a reliable indicator of future results. Be sure to understand risks before making an investment decision.
Go Further
I encourage you to read the complete analyses of StoneCo Ltd. and Veritone, Inc. to enhance your investment decisions: