In today’s fast-evolving tech landscape, VeriSign, Inc. (VRSN) and StoneCo Ltd. (STNE) stand out as key players in the software infrastructure sector. VeriSign secures internet navigation through domain registry services, while StoneCo drives fintech innovation in Brazil’s digital commerce space. Comparing these industry leaders reveals contrasting growth trajectories and innovation strategies. Join me as we analyze which company offers the most compelling investment opportunity for your portfolio.
Table of contents
Companies Overview
I will begin the comparison between VeriSign and StoneCo by providing an overview of these two companies and their main differences.
VeriSign Overview
VeriSign, Inc. provides domain name registry services and internet infrastructure supporting global internet navigation. It operates critical root zone servers and manages the .com and .net domains, enabling security and stability for e-commerce worldwide. Founded in 1995, VeriSign is headquartered in Reston, Virginia, and employs 929 people, positioning itself as a key player in internet infrastructure.
StoneCo Overview
StoneCo Ltd. offers fintech solutions to merchants and partners in Brazil, facilitating electronic commerce across in-store, online, and mobile channels. Founded in 2000 and based in George Town, Cayman Islands, StoneCo serves over 1.7M clients, mainly small and medium businesses. It distributes solutions through Stone Hubs and a sales force, focusing on localized service and technology integration.
Key similarities and differences
Both VeriSign and StoneCo operate in the technology sector with focuses on infrastructure, but their markets differ significantly. VeriSign specializes in internet domain and security infrastructure globally, while StoneCo targets fintech services within Brazil’s commerce ecosystem. VeriSign’s business centers on domain registry and internet stability, whereas StoneCo provides payment and commerce solutions tailored to merchants’ needs.
Income Statement Comparison
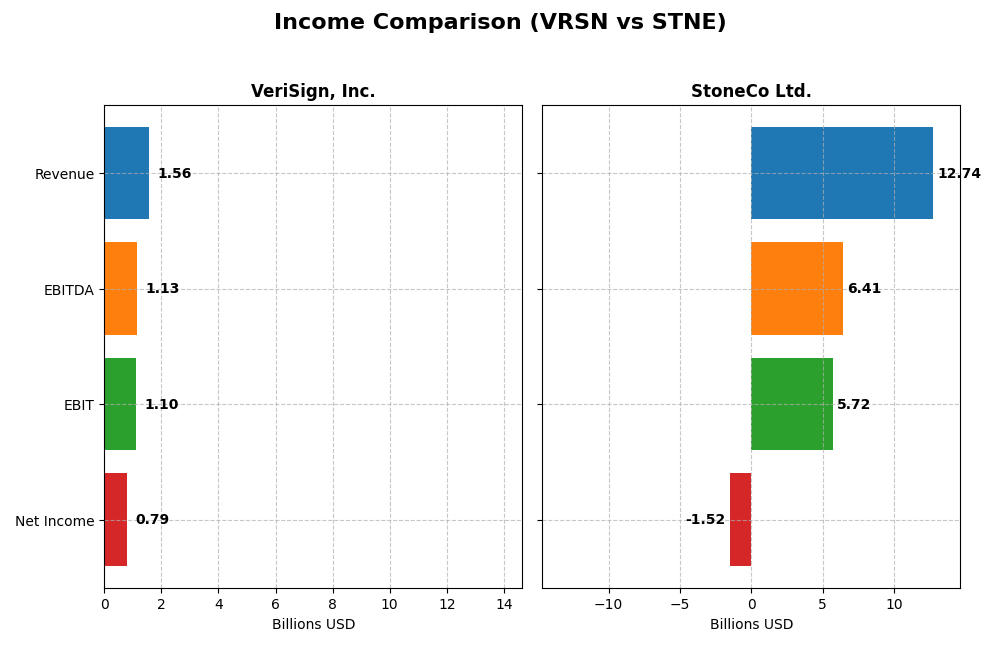
The table below presents a side-by-side comparison of the most recent annual income statement figures for VeriSign, Inc. and StoneCo Ltd., highlighting key financial metrics for fiscal year 2024.
| Metric | VeriSign, Inc. (VRSN) | StoneCo Ltd. (STNE) |
|---|---|---|
| Market Cap | 23.1B USD | 3.9B BRL |
| Revenue | 1.56B USD | 12.7B BRL |
| EBITDA | 1.13B USD | 6.41B BRL |
| EBIT | 1.10B USD | 5.72B BRL |
| Net Income | 786M USD | -1.52B BRL |
| EPS | 8.01 USD | -5.02 BRL |
| Fiscal Year | 2024 | 2024 |
Income Statement Interpretations
VeriSign, Inc.
VeriSign’s revenue steadily increased from $1.27B in 2020 to $1.56B in 2024, reflecting a favorable 23.11% growth over five years. Net income showed some volatility, declining overall by 3.58%. Margins remain strong, with a gross margin of 87.7% and a net margin of 50.5%, though the latter slightly contracted recently. The 2024 performance saw moderate revenue growth of 4.3% but a 7.9% net margin decline, suggesting margin pressure despite stable operating efficiency.
StoneCo Ltd.
StoneCo’s revenue expanded rapidly, rising from BRL 3.17B in 2020 to BRL 12.74B in 2024, an impressive 302.3% overall growth. However, net income deteriorated sharply, with losses deepening to BRL -1.52B in 2024 from a positive BRL 854M in 2020. While gross and EBIT margins remain favorable at 73.4% and 44.9%, respectively, the net margin was negative at -11.9%, worsening notably in the latest year. The 2024 results showed continued revenue growth of 12.1% but a severe net margin contraction, highlighting rising costs or financial burdens.
Which one has the stronger fundamentals?
VeriSign demonstrates stronger fundamentals with consistently high margins, stable operating income, and positive net income despite recent margin headwinds. StoneCo, though growing revenues rapidly, struggles with persistent net losses and deteriorating bottom-line profitability, reflecting higher risk. Both companies have favorable gross and EBIT margins, but VeriSign’s profitability metrics and controlled expenses indicate a more resilient income statement profile.
Financial Ratios Comparison
The table below presents a side-by-side comparison of key financial ratios for VeriSign, Inc. (VRSN) and StoneCo Ltd. (STNE) based on their most recent fiscal year data for 2024.
| Ratios | VeriSign, Inc. (VRSN) | StoneCo Ltd. (STNE) |
|---|---|---|
| ROE | -40.1% | -12.9% |
| ROIC | 4.5% | 22.4% |
| P/E | 25.8 | -9.8 |
| P/B | -10.4 | 1.27 |
| Current Ratio | 0.43 | 1.37 |
| Quick Ratio | 0.43 | 1.37 |
| D/E | -0.92 | 1.10 |
| Debt-to-Assets | 128.1% | 23.5% |
| Interest Coverage | 14.1 | 5.57 |
| Asset Turnover | 1.11 | 0.23 |
| Fixed Asset Turnover | 6.66 | 6.95 |
| Payout Ratio | 0 | 0 |
| Dividend Yield | 0 | 0 |
Interpretation of the Ratios
VeriSign, Inc.
VeriSign shows a mixed ratio profile with strong net margin (50.45%) and return on invested capital (451.0%), indicating operational efficiency and capital utilization. However, negative return on equity (-40.13%) and low current and quick ratios (0.43) raise liquidity and profitability concerns. The company pays dividends with no dividend yield reported, suggesting no recent payouts or a focus on other shareholder returns.
StoneCo Ltd.
StoneCo exhibits weaker profitability with negative net margin (-11.89%) and return on equity (-12.87%), despite a positive return on invested capital (22.41%). Liquidity ratios are healthier, with a current ratio of 1.37 and favorable quick ratio. The absence of dividends reflects a reinvestment strategy amid ongoing losses, prioritizing growth and operational expansion over immediate shareholder returns.
Which one has the best ratios?
VeriSign presents more favorable profitability and capital efficiency ratios but struggles with liquidity and equity returns. StoneCo offers better liquidity and modest capital returns but faces profitability challenges. Overall, VeriSign’s ratios lean toward favorable, while StoneCo’s are slightly favorable, reflecting differing financial strengths and weaknesses.
Strategic Positioning
This section compares the strategic positioning of VeriSign and StoneCo, including market position, key segments, and exposure to technological disruption:
VeriSign, Inc.
- Leading provider in domain registry and internet infrastructure with moderate competitive pressure
- Focused on domain name registry and internet security services supporting global e-commerce
- Operates critical internet root servers, indicating stable exposure to technological changes
StoneCo Ltd.
- Financial technology provider in Brazil targeting small and medium businesses facing high competition
- Offers fintech solutions through proprietary Stone Hubs and sales teams to merchants and digital platforms
- Exposure to evolving digital commerce technologies in a dynamic and competitive fintech environment
VeriSign vs StoneCo Positioning
VeriSign has a concentrated focus on internet infrastructure and domain registry, ensuring stability and critical service provision. StoneCo shows a diversified fintech approach targeting merchants with localized and digital solutions, involving broader market risks and opportunities.
Which has the best competitive advantage?
Both companies demonstrate very favorable moats with growing ROIC trends, but VeriSign’s extreme excess returns and critical internet infrastructure position indicate a stronger and more durable competitive advantage.
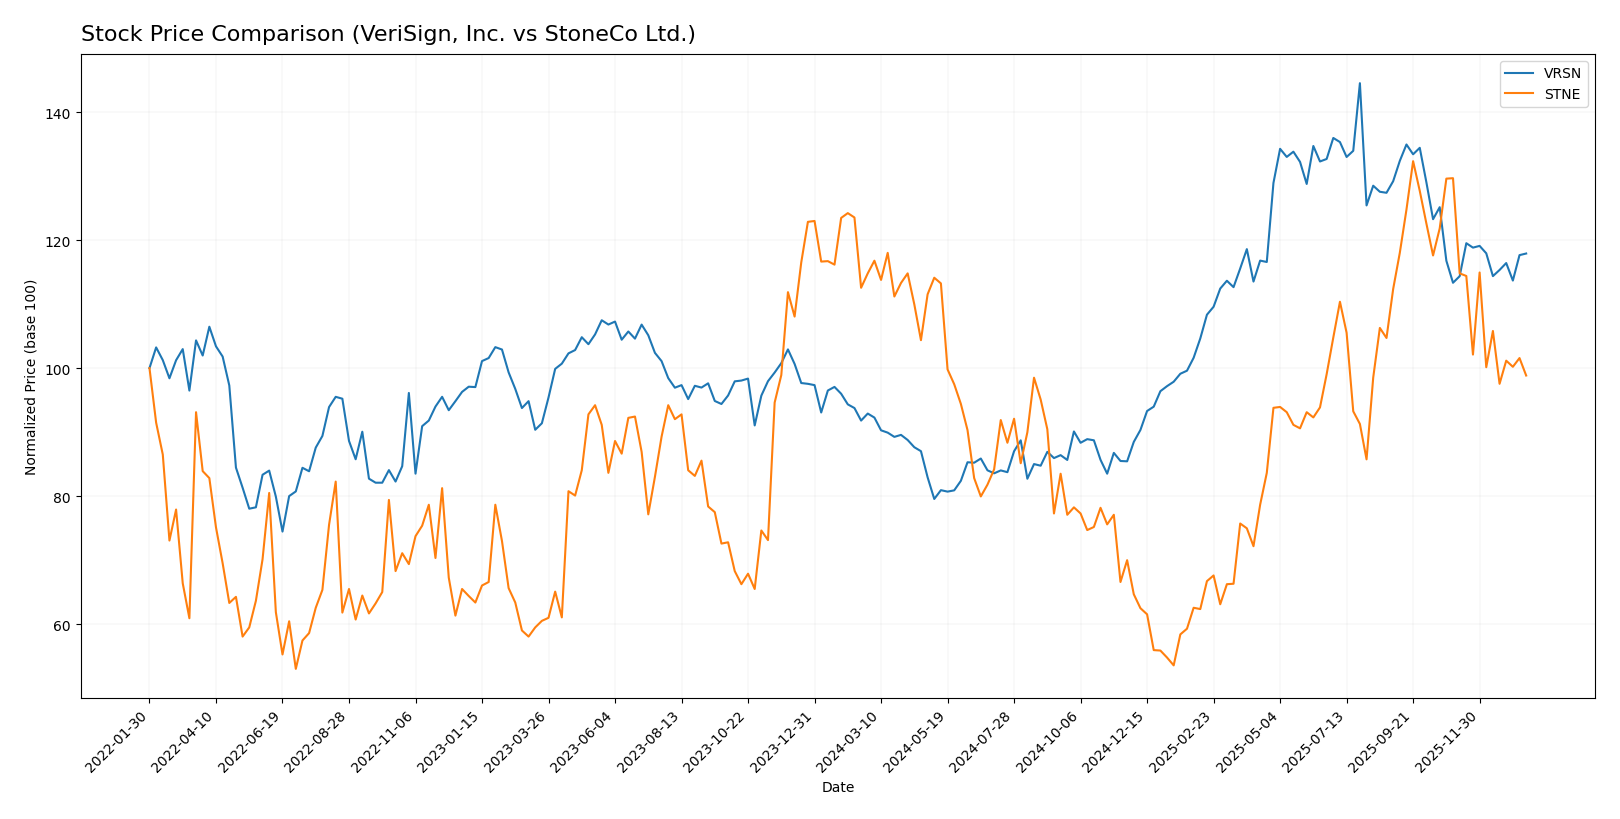
Stock Comparison
The stock prices of VeriSign, Inc. and StoneCo Ltd. over the past 12 months reveal contrasting trends: VeriSign experienced a strong bullish trend with notable price growth and volatility, while StoneCo faced a sustained bearish trend marked by steady decline.
Trend Analysis
VeriSign, Inc. recorded a 26.92% price increase over the past year, indicating a bullish trend with decelerating momentum. The stock traded between $168.32 and $305.79, exhibiting high volatility with a standard deviation of 40.88.
StoneCo Ltd. showed a 13.9% decline over the same period, reflecting a bearish trend with decelerating pace. Its price fluctuated from $7.85 to $19.40, with lower volatility measured by a 2.92 standard deviation.
Comparing the two, VeriSign delivered the highest market performance with a clear bullish trend, while StoneCo’s stock experienced a notable bearish trajectory during the period.
Target Prices
Analysts show a clear consensus on target prices for VeriSign, Inc. and StoneCo Ltd.
| Company | Target High | Target Low | Consensus |
|---|---|---|---|
| VeriSign, Inc. | 325 | 325 | 325 |
| StoneCo Ltd. | 20 | 20 | 20 |
The consensus target for VeriSign at 325 indicates a significant upside from its current price of 249.47 USD. StoneCo’s target of 20 suggests moderate growth potential compared to its current 14.49 USD price.
Analyst Opinions Comparison
This section compares analysts’ ratings and grades for VeriSign, Inc. and StoneCo Ltd.:
Rating Comparison
VeriSign, Inc. Rating
- Rating: B- indicating a very favorable overall rating
- Discounted Cash Flow Score: 4, favorable valuation
- Return on Equity Score: 1, very unfavorable efficiency
- Return on Assets Score: 5, very favorable utilization
- Debt To Equity Score: 1, very unfavorable balance sheet risk
- Overall Score: 2, moderate overall financial standing
StoneCo Ltd. Rating
- Rating: C indicating a very favorable overall rating
- Discounted Cash Flow Score: 3, moderate valuation
- Return on Equity Score: 1, very unfavorable efficiency
- Return on Assets Score: 1, very unfavorable utilization
- Debt To Equity Score: 1, very unfavorable balance sheet risk
- Overall Score: 2, moderate overall financial standing
Which one is the best rated?
VeriSign and StoneCo share the same moderate overall score of 2, but VeriSign’s discounted cash flow and return on assets scores are stronger, while StoneCo’s scores are generally lower. Overall, VeriSign is better rated based on the provided data.
Scores Comparison
Here is a comparison of the Altman Z-Score and Piotroski Score for VeriSign, Inc. and StoneCo Ltd.:
VRSN Scores
- Altman Z-Score: -4.67, in distress zone, high bankruptcy risk.
- Piotroski Score: 8, very strong financial health rating.
STNE Scores
- Altman Z-Score: 1.02, in distress zone, moderate bankruptcy risk.
- Piotroski Score: 5, average financial health rating.
Which company has the best scores?
VeriSign shows a much stronger Piotroski Score indicating better financial health, despite both companies being in the distress zone by Altman Z-Score. StoneCo’s scores suggest moderate financial risk and average strength.
Grades Comparison
The following presents the latest reliable grading data for VeriSign, Inc. and StoneCo Ltd.:
VeriSign, Inc. Grades
This table summarizes recent analyst grades on VeriSign, Inc. from established financial institutions.
| Grading Company | Action | New Grade | Date |
|---|---|---|---|
| JP Morgan | Maintain | Neutral | 2026-01-06 |
| Baird | Maintain | Outperform | 2025-07-01 |
| Baird | Maintain | Outperform | 2025-04-25 |
| Baird | Maintain | Outperform | 2025-04-01 |
| Citigroup | Maintain | Buy | 2025-02-04 |
| Citigroup | Maintain | Buy | 2025-01-03 |
| Baird | Upgrade | Outperform | 2024-12-09 |
| Baird | Maintain | Neutral | 2024-06-27 |
| Baird | Maintain | Neutral | 2024-04-26 |
| Citigroup | Maintain | Buy | 2024-04-02 |
Overall, VeriSign shows a consistent pattern of Buy and Outperform ratings, with some Neutral grades, indicating a generally positive analyst sentiment.
StoneCo Ltd. Grades
Below is a summary table of recent analyst ratings for StoneCo Ltd. from reputable grading companies.
| Grading Company | Action | New Grade | Date |
|---|---|---|---|
| Goldman Sachs | Maintain | Buy | 2025-10-14 |
| B of A Securities | Maintain | Buy | 2025-09-09 |
| UBS | Maintain | Buy | 2025-08-29 |
| JP Morgan | Maintain | Overweight | 2025-07-16 |
| Barclays | Maintain | Equal Weight | 2025-05-12 |
| Barclays | Maintain | Equal Weight | 2025-04-23 |
| Citigroup | Upgrade | Buy | 2025-04-22 |
| Barclays | Maintain | Equal Weight | 2025-03-21 |
| Morgan Stanley | Maintain | Underweight | 2025-03-21 |
| Goldman Sachs | Maintain | Buy | 2025-02-06 |
StoneCo’s grades show a larger variation, with several Buy ratings alongside Equal Weight and Underweight assessments, reflecting a more mixed analyst view.
Which company has the best grades?
VeriSign has received more consistent Buy and Outperform ratings, whereas StoneCo’s ratings are more mixed, including Equal Weight and Underweight grades. This consistency in VeriSign’s grades may indicate clearer analyst confidence, potentially affecting investor sentiment towards stability. StoneCo’s varied ratings suggest higher uncertainty in outlook.
Strengths and Weaknesses
Below is a comparison of key strengths and weaknesses for VeriSign, Inc. (VRSN) and StoneCo Ltd. (STNE) based on their latest financial and strategic data.
| Criterion | VeriSign, Inc. (VRSN) | StoneCo Ltd. (STNE) |
|---|---|---|
| Diversification | Limited product diversification, focused on domain name services | Limited diversification, primarily fintech and payments |
| Profitability | Very high net margin (50.45%), strong ROIC (451%), but negative ROE (-40.13%) | Negative net margin (-11.89%) and ROE (-12.87%), but positive ROIC (22.41%) |
| Innovation | Strong durable moat with growing ROIC indicating innovation in services | Durable competitive advantage with growing ROIC, but innovation impact moderate |
| Global presence | Strong global footprint in internet infrastructure | Growing presence primarily in Latin America |
| Market Share | Leading position in domain registry market | Significant market share in Brazilian fintech sector |
Key takeaways: VeriSign demonstrates a robust profitability profile and a very favorable economic moat, though it faces challenges in return on equity and liquidity ratios. StoneCo shows a slightly favorable financial stance with strong ROIC growth but struggles with profitability and leverage. Investors should weigh VeriSign’s stable value creation against StoneCo’s growth potential and higher risk.
Risk Analysis
The table below summarizes key risk metrics for VeriSign, Inc. (VRSN) and StoneCo Ltd. (STNE) as of 2024, highlighting their financial and operational risk exposures.
| Metric | VeriSign, Inc. (VRSN) | StoneCo Ltd. (STNE) |
|---|---|---|
| Market Risk | Beta 0.77 (lower volatility) | Beta 1.835 (higher volatility) |
| Debt level | Debt-to-assets 128% (high) | Debt-to-assets 23.53% (moderate) |
| Regulatory Risk | Moderate (US tech sector) | Elevated (Brazil fintech, complex regulations) |
| Operational Risk | Low (stable core infrastructure) | Moderate (large SMB client base, tech integration) |
| Environmental Risk | Low (mainly digital services) | Low (digital financial services) |
| Geopolitical Risk | Low (US-based, global domain service) | High (exposure to Latin America, currency risk) |
VeriSign’s most impactful risk is its high debt-to-assets ratio (128%), posing financial leverage concerns despite a stable market position. StoneCo faces significant market and geopolitical risks due to its exposure to the volatile Brazilian fintech market and higher beta. Regulatory complexity also challenges StoneCo more than VeriSign. Both companies show resilience operationally, but investors should weigh VeriSign’s leverage risk against StoneCo’s emerging market uncertainties.
Which Stock to Choose?
VeriSign, Inc. (VRSN) shows steady income growth with a 23.11% revenue increase over five years, strong profitability including a 50.45% net margin, and a favorable global financial ratio profile at 57.14%. Despite a negative return on equity and weak liquidity ratios, its very favorable moat rating indicates durable competitive advantage and value creation.
StoneCo Ltd. (STNE) experienced significant revenue growth of 302.29% over five years but suffers from net losses and a negative net margin of -11.89%. Its financial ratios are slightly favorable at 50%, with moderate debt levels and a very favorable moat rating reflecting growing profitability, though its Altman Z-score suggests financial distress risk.
Investors seeking stable profitability and a durable moat might find VeriSign’s profile more aligned with quality or value investing, while those with tolerance for volatility and focused on rapid growth could interpret StoneCo’s metrics as indicating potential opportunities despite financial challenges.
Disclaimer: Investment carries a risk of loss of initial capital. The past performance is not a reliable indicator of future results. Be sure to understand risks before making an investment decision.
Go Further
I encourage you to read the complete analyses of VeriSign, Inc. and StoneCo Ltd. to enhance your investment decisions: