In today’s fast-evolving tech landscape, UiPath Inc. and StoneCo Ltd. stand out as innovative players in the software infrastructure sector. UiPath leads in robotic process automation, while StoneCo focuses on fintech solutions for merchants in Brazil. Their shared industry and commitment to digital transformation make this comparison intriguing. Join me as we analyze which company presents the most compelling opportunity for your investment portfolio.
Table of contents
Companies Overview
I will begin the comparison between UiPath Inc. and StoneCo Ltd. by providing an overview of these two companies and their main differences.
UiPath Inc. Overview
UiPath Inc. is a technology company specializing in robotic process automation (RPA) software. Founded in 2005 and headquartered in New York City, it offers an end-to-end automation platform that integrates AI and low-code development environments for process automation. UiPath primarily serves industries such as banking, healthcare, financial services, and government, focusing on delivering solutions that enhance operational efficiency.
StoneCo Ltd. Overview
StoneCo Ltd. is a financial technology firm based in George Town, Cayman Islands, founded in 2000. It provides electronic commerce solutions to merchants and partners in Brazil, mainly targeting small and medium-sized businesses. StoneCo distributes its services through proprietary Stone Hubs and a network of sales and technical personnel, serving over 1.7M clients across in-store, online, and mobile channels.
Key similarities and differences
Both companies operate in the software infrastructure sector, emphasizing technology-driven solutions to improve business processes. UiPath focuses on automation software with a global presence, while StoneCo concentrates on fintech services within the Brazilian market. UiPath’s platform integrates AI and automation across various industries, whereas StoneCo primarily supports electronic commerce and payment processing for merchants. Their business models reflect distinct market focuses and client bases.
Income Statement Comparison
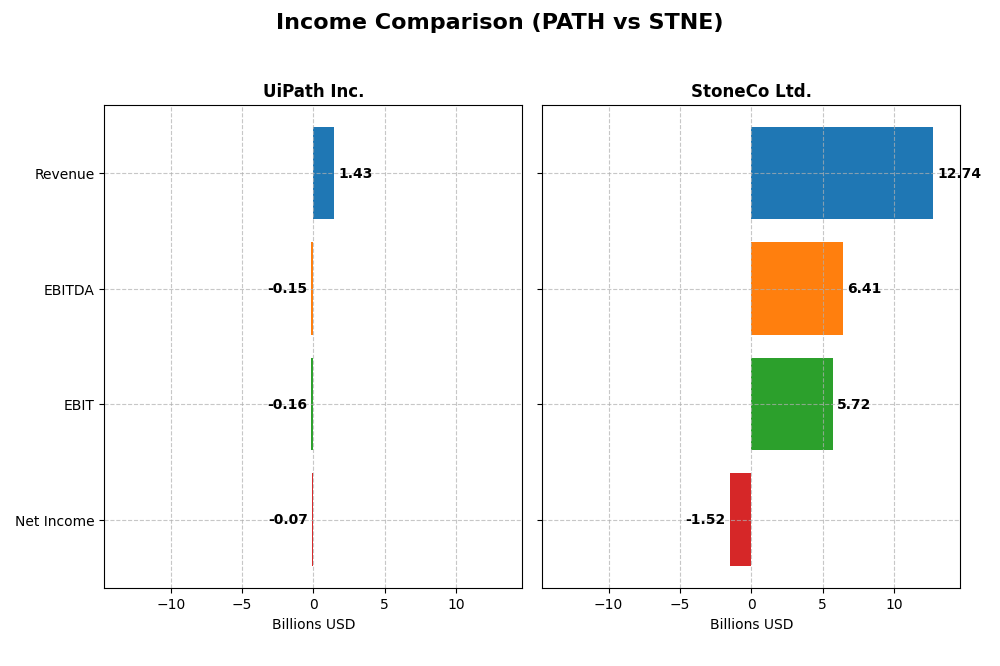
The following table presents a side-by-side comparison of key income statement metrics for UiPath Inc. and StoneCo Ltd., based on their most recent fiscal year data.
| Metric | UiPath Inc. (PATH) | StoneCo Ltd. (STNE) |
|---|---|---|
| Market Cap | 7.7B USD | 3.9B BRL |
| Revenue | 1.43B USD | 12.74B BRL |
| EBITDA | -145M USD | 6.41B BRL |
| EBIT | -163M USD | 5.72B BRL |
| Net Income | -74M USD | -1.52B BRL |
| EPS | -0.13 USD | -5.02 BRL |
| Fiscal Year | 2025 | 2024 |
Income Statement Interpretations
UiPath Inc.
UiPath demonstrated strong revenue growth from 2021 to 2025, increasing from $608M to $1.43B, with a gross margin consistently above 80%. Despite sustained negative EBIT and net income, the company showed improvement in net margin and EPS in 2025, with revenue growth at 9.3% and a net margin increase of 25%. Operating expenses grew in line with revenue, supporting margin stability.
StoneCo Ltd.
StoneCo’s revenue expanded robustly over 2020–2024, from BRL 3.17B to BRL 12.74B, maintaining a solid gross margin around 73%. EBIT margin remained favorable at nearly 45%, but net income deteriorated sharply, turning negative in 2024. Despite positive revenue and EBIT growth, net margin and EPS declined significantly, reflecting challenges in profitability and cost management.
Which one has the stronger fundamentals?
UiPath displays a more balanced improvement trajectory, with favorable growth in revenue, net income, and margins overall, despite ongoing losses. StoneCo boasts higher revenue and EBIT margins but faces severe net income declines and negative net margin trends. UiPath’s consistent margin management and positive net margin growth suggest relatively stronger fundamentals in income statement performance.
Financial Ratios Comparison
The table below presents a side-by-side comparison of key financial ratios for UiPath Inc. and StoneCo Ltd. based on their most recent fiscal year data.
| Ratios | UiPath Inc. (PATH) FY 2025 | StoneCo Ltd. (STNE) FY 2024 |
|---|---|---|
| ROE | -3.99% | -12.87% |
| ROIC | -7.41% | 22.41% |
| P/E | -108.0 | -9.84 |
| P/B | 4.31 | 1.27 |
| Current Ratio | 2.93 | 1.37 |
| Quick Ratio | 2.93 | 1.37 |
| D/E | 0.04 | 1.10 |
| Debt-to-Assets | 2.72% | 23.53% |
| Interest Coverage | 0 | 5.57 |
| Asset Turnover | 0.50 | 0.23 |
| Fixed Asset Turnover | 14.41 | 6.95 |
| Payout ratio | 0 | 0 |
| Dividend yield | 0 | 0 |
Interpretation of the Ratios
UiPath Inc.
UiPath shows a mixed ratio profile with roughly 43% favorable and 50% unfavorable ratings, resulting in a slightly unfavorable overall assessment. Strengths include a strong current and quick ratio of 2.93, low debt-to-equity at 0.04, and a favorable price-to-earnings ratio despite negative net margin (-5.15%) and return on equity (-3.99%). The company pays no dividends, likely due to negative earnings and reinvestment priorities.
StoneCo Ltd.
StoneCo presents a slightly favorable ratio assessment, with 50% favorable and 43% unfavorable ratios. The company’s strong points include a robust return on invested capital at 22.41%, a favorable price-to-book ratio of 1.27, and solid interest coverage of 5.41. However, it faces challenges with a negative net margin (-11.89%) and elevated debt-to-equity of 1.1. StoneCo also does not pay dividends, probably reflecting reinvestment or growth strategies.
Which one has the best ratios?
StoneCo’s ratios are evaluated as slightly favorable, supported by superior profitability measures and interest coverage compared to UiPath’s slightly unfavorable rating. Despite some weaknesses, StoneCo’s balance of favorable metrics outweighs UiPath’s mixed profile, which is hindered by negative returns and coverage concerns. Overall, StoneCo appears to have the more robust ratio set as of the latest fiscal years.
Strategic Positioning
This section compares the strategic positioning of UiPath Inc. and StoneCo Ltd., focusing on Market position, Key segments, and Exposure to technological disruption:
UiPath Inc.
- Strong presence in automation software with 7.7B market cap; moderate competitive pressure in technology sector.
- Key segments include License, Subscription Services, and Professional Services, driven by RPA platform adoption globally.
- Combines AI and automation tools to innovate RPA; potential disruption from evolving AI technologies in software infrastructure.
StoneCo Ltd.
- Focused fintech provider in Brazil with 3.9B market cap; faces high competition in local electronic commerce solutions.
- Primarily serves small and medium merchants via proprietary hubs, targeting in-store, online, and mobile commerce.
- Technology-driven fintech with proprietary hubs; exposed to fintech innovation risks but benefits from localized solutions.
UiPath Inc. vs StoneCo Ltd. Positioning
UiPath pursues a diversified approach with multiple revenue streams in automation software, while StoneCo concentrates on fintech solutions for Brazilian merchants. UiPath’s global footprint contrasts with StoneCo’s regional focus, each with distinct market and technological challenges.
Which has the best competitive advantage?
StoneCo holds a very favorable moat with strong ROIC above WACC and growing profitability, indicating durable competitive advantage. UiPath shows a slightly unfavorable moat, shedding value despite improving ROIC trends.
Stock Comparison
The stock price movements over the past year reveal distinct bearish trends for both UiPath Inc. and StoneCo Ltd., with varying degrees of price decline and trading volume dynamics impacting investor sentiment.
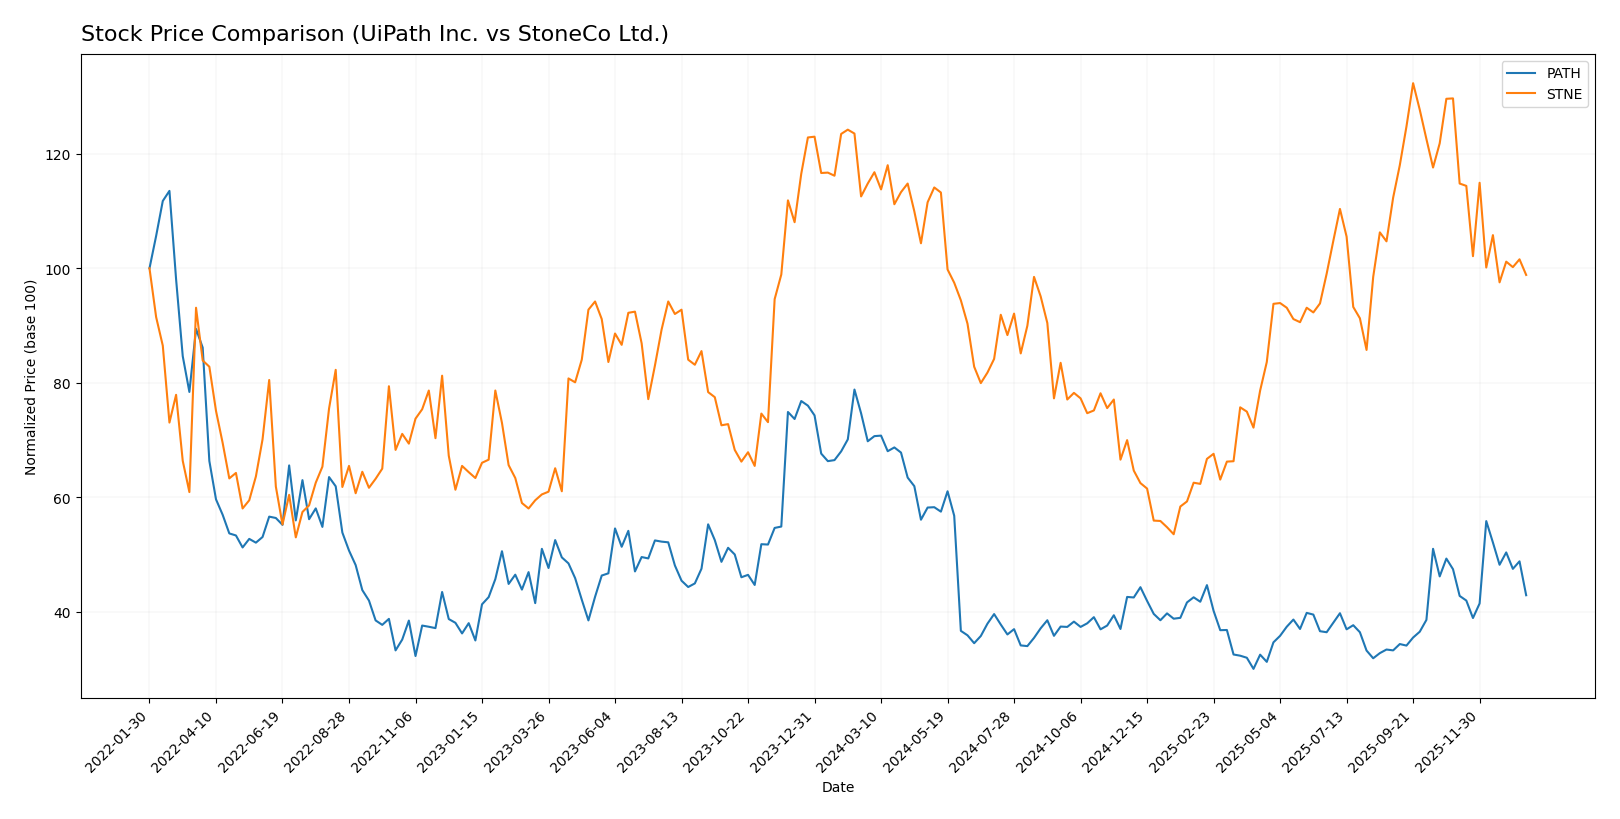
Trend Analysis
UiPath Inc. (PATH) experienced a significant bearish trend over the past 12 months with a price decline of 38.53%, showing acceleration in its downward movement. The stock traded between a high of 23.66 and a low of 10.04, with notable volatility (std deviation 3.33).
StoneCo Ltd. (STNE) also showed a bearish trend with a price change of -13.9% over the same period, but its downward trend decelerated. The stock reached a high of 19.4 and a low of 7.85, with a slightly lower volatility (std deviation 2.92).
Comparing the two, StoneCo Ltd. outperformed UiPath Inc. in market performance over the past year, delivering a smaller percentage loss, despite both stocks trading under bearish conditions.
Target Prices
Analysts present a clear target price consensus for UiPath Inc. and StoneCo Ltd., outlining potential upside from current levels.
| Company | Target High | Target Low | Consensus |
|---|---|---|---|
| UiPath Inc. | 19 | 14 | 16.6 |
| StoneCo Ltd. | 20 | 20 | 20 |
The consensus target prices for UiPath and StoneCo suggest moderate to strong upside potential compared to their current prices of $14.34 and $14.49, respectively, reflecting positive analyst sentiment.
Analyst Opinions Comparison
This section compares analysts’ ratings and financial scores for UiPath Inc. and StoneCo Ltd.:
Rating Comparison
UiPath Inc. Rating
- Rating: B+, indicating a very favorable overall rating.
- Discounted Cash Flow Score: Moderate at 3/5, reflecting fair valuation.
- ROE Score: Favorable at 4/5, showing efficient profit generation from equity.
- ROA Score: Favorable at 4/5, demonstrating effective asset utilization.
- Debt To Equity Score: Favorable at 4/5, suggesting low financial risk.
- Overall Score: Moderate at 3/5, reflecting balanced financial health.
StoneCo Ltd. Rating
- Rating: C, considered very favorable overall.
- Discounted Cash Flow Score: Moderate at 3/5, similar valuation outlook.
- ROE Score: Very unfavorable at 1/5, indicating poor equity profit efficiency.
- ROA Score: Very unfavorable at 1/5, showing weak asset earnings generation.
- Debt To Equity Score: Very unfavorable at 1/5, implying higher financial risk.
- Overall Score: Moderate at 2/5, indicating below-average financial standing.
Which one is the best rated?
Based on the provided data, UiPath Inc. holds a stronger rating profile with a B+ rating and favorable scores in ROE, ROA, and debt-to-equity metrics. StoneCo Ltd. has a lower C rating with very unfavorable profitability and leverage scores, making UiPath better rated overall.
Scores Comparison
Here is a comparison of the Altman Z-Score and Piotroski Score for UiPath Inc. and StoneCo Ltd.:
UiPath Inc. Scores
- Altman Z-Score: 5.27, indicating a safe zone with low bankruptcy risk.
- Piotroski Score: 7, reflecting strong financial health.
StoneCo Ltd. Scores
- Altman Z-Score: 1.02, indicating distress zone with high bankruptcy risk.
- Piotroski Score: 5, reflecting average financial health.
Which company has the best scores?
Based strictly on the provided data, UiPath Inc. shows better scores with a safe Altman Z-Score and a strong Piotroski Score, while StoneCo Ltd. falls into distress zone and has only average financial strength.
Grades Comparison
Here is a comparison of the grades assigned to UiPath Inc. and StoneCo Ltd. by reputable grading companies:
UiPath Inc. Grades
The following table summarizes recent grades from established financial institutions for UiPath Inc.:
| Grading Company | Action | New Grade | Date |
|---|---|---|---|
| Barclays | Maintain | Equal Weight | 2026-01-12 |
| RBC Capital | Maintain | Sector Perform | 2026-01-05 |
| RBC Capital | Maintain | Sector Perform | 2025-12-10 |
| Morgan Stanley | Maintain | Equal Weight | 2025-12-09 |
| DA Davidson | Maintain | Neutral | 2025-12-05 |
| Canaccord Genuity | Maintain | Buy | 2025-12-04 |
| Mizuho | Maintain | Neutral | 2025-12-04 |
| RBC Capital | Maintain | Sector Perform | 2025-12-04 |
| Wells Fargo | Maintain | Equal Weight | 2025-12-04 |
| Evercore ISI Group | Maintain | In Line | 2025-12-04 |
The overall trend for UiPath Inc. shows predominantly neutral to hold ratings, with only one buy rating noted.
StoneCo Ltd. Grades
Below are the recent grades from credible grading companies for StoneCo Ltd.:
| Grading Company | Action | New Grade | Date |
|---|---|---|---|
| Goldman Sachs | Maintain | Buy | 2025-10-14 |
| B of A Securities | Maintain | Buy | 2025-09-09 |
| UBS | Maintain | Buy | 2025-08-29 |
| JP Morgan | Maintain | Overweight | 2025-07-16 |
| Barclays | Maintain | Equal Weight | 2025-05-12 |
| Barclays | Maintain | Equal Weight | 2025-04-23 |
| Citigroup | Upgrade | Buy | 2025-04-22 |
| Barclays | Maintain | Equal Weight | 2025-03-21 |
| Morgan Stanley | Maintain | Underweight | 2025-03-21 |
| Goldman Sachs | Maintain | Buy | 2025-02-06 |
StoneCo Ltd. exhibits a stronger bias toward buy and overweight ratings, with a few equal weight and one underweight rating.
Which company has the best grades?
StoneCo Ltd. has received better grades overall, with a majority of buy and overweight ratings compared to UiPath Inc.’s predominantly neutral and hold assessments. This difference may influence investor sentiment by favoring StoneCo Ltd. for potential growth prospects.
Strengths and Weaknesses
Below is a comparative overview of key strengths and weaknesses for UiPath Inc. (PATH) and StoneCo Ltd. (STNE) based on their most recent financial and operational data.
| Criterion | UiPath Inc. (PATH) | StoneCo Ltd. (STNE) |
|---|---|---|
| Diversification | Moderate: revenue split between License (587M), Subscription Services (802M), and Professional Services (71M) | Limited data on product diversification; primary focus on payments solutions |
| Profitability | Unfavorable: negative net margin (-5.15%) and ROIC (-7.41%) indicating value destruction | Mixed: negative net margin (-11.89%) but strong ROIC (22.41%), showing efficient capital use despite losses |
| Innovation | Moderate: steady growth in ROIC (+65%) suggests improving operational efficiency | High: very favorable ROIC trend (+371%) indicates strong innovation and competitive positioning |
| Global presence | Strong: established global SaaS footprint with subscription services as majority revenue | Strong in Brazil and Latin America, expanding digital payment solutions |
| Market Share | Growing in RPA market but facing intense competition | Leading in Brazilian fintech with increasing market penetration |
Key takeaways: StoneCo demonstrates a durable competitive advantage with strong capital efficiency and growing profitability despite current losses. UiPath shows improving profitability trends but still struggles with value creation. Investors should weigh StoneCo’s growth and market position against UiPath’s innovation and diversification in automation software.
Risk Analysis
Below is a risk comparison table for UiPath Inc. (PATH) and StoneCo Ltd. (STNE) based on the most recent data from 2025 for PATH and 2024 for STNE:
| Metric | UiPath Inc. (PATH) | StoneCo Ltd. (STNE) |
|---|---|---|
| Market Risk | Moderate beta 1.08, tech sector volatility | High beta 1.84, emerging market exposure |
| Debt level | Very low debt-to-equity 0.04, low leverage | High debt-to-equity 1.1, significant leverage |
| Regulatory Risk | US and international compliance, moderate risk | Operating mainly in Brazil, exposure to local regulations |
| Operational Risk | Complex RPA platform, moderate execution risk | Fintech with reliance on digital infrastructure |
| Environmental Risk | Low, software-focused company | Low, digital payments with limited physical footprint |
| Geopolitical Risk | Moderate, exposure to US, Romania, Japan | High, concentrated in Brazil and Cayman Islands |
UiPath’s most impactful risk lies in market volatility and operational execution amid negative margins, while StoneCo faces higher leverage and significant geopolitical risk tied to Brazil’s economic and regulatory environment, elevating its financial distress concerns.
Which Stock to Choose?
UiPath Inc. (PATH) shows favorable income growth with a 9.3% revenue increase in 2025 and an overall 135% rise since 2021. Despite negative profitability metrics and a slightly unfavorable global financial ratios evaluation, it maintains low debt levels and a strong rating of B+ with a very favorable overall rating.
StoneCo Ltd. (STNE) reports higher revenue growth at 12.1% in 2024 and a 302% increase over five years. It has mixed profitability with a positive EBIT margin but negative net margin, a slightly favorable global ratios evaluation, and moderate debt. Its rating stands at C, with very favorable qualitative assessment but weaker financial scores overall.
For investors prioritizing durable competitive advantage and value creation, StoneCo’s very favorable moat rating and growing ROIC suggest potential appeal. Conversely, UiPath’s favorable income trends and solid rating might resonate more with those valuing growth and financial stability, despite some profitability challenges.
Disclaimer: Investment carries a risk of loss of initial capital. The past performance is not a reliable indicator of future results. Be sure to understand risks before making an investment decision.
Go Further
I encourage you to read the complete analyses of UiPath Inc. and StoneCo Ltd. to enhance your investment decisions: