Investors seeking growth opportunities in the technology sector often compare Synopsys, Inc. (SNPS) and StoneCo Ltd. (STNE), two innovators in software infrastructure with distinct market focuses. Synopsys leads in electronic design automation, while StoneCo specializes in fintech solutions for Brazilian commerce. By examining their industry positions and innovation strategies, this article will help you identify which company offers the most compelling investment potential in 2026.

Table of contents
Companies Overview
I will begin the comparison between Synopsys, Inc. and StoneCo Ltd. by providing an overview of these two companies and their main differences.
Synopsys Overview
Synopsys, Inc. is a technology company specializing in electronic design automation software used to design and test integrated circuits. Its offerings include platforms for digital design implementation, verification, FPGA-based prototyping, and intellectual property solutions for various interfaces and system-on-chip components. Headquartered in Mountain View, California, Synopsys serves diverse sectors such as electronics, automotive, and financial services, employing around 20,000 people.
StoneCo Overview
StoneCo Ltd. is a financial technology company providing electronic commerce solutions to merchants and partners in Brazil. It distributes services through proprietary Stone Hubs and a sales force targeting small and medium businesses, digital merchants, and integrated software vendors. Founded in 2000 and based in George Town, Cayman Islands, StoneCo serves approximately 1.77M clients and operates as a subsidiary of HR Holdings, with a workforce of about 7,200 employees.
Key similarities and differences
Both Synopsys and StoneCo operate in the technology sector with a focus on infrastructure software. However, Synopsys concentrates on electronic design automation and semiconductor IP solutions, while StoneCo focuses on fintech services enabling electronic commerce primarily in Brazil. Synopsys has a significantly larger market capitalization and workforce, reflecting its broad global reach and diversified technology applications compared to StoneCo’s niche fintech market.
Income Statement Comparison
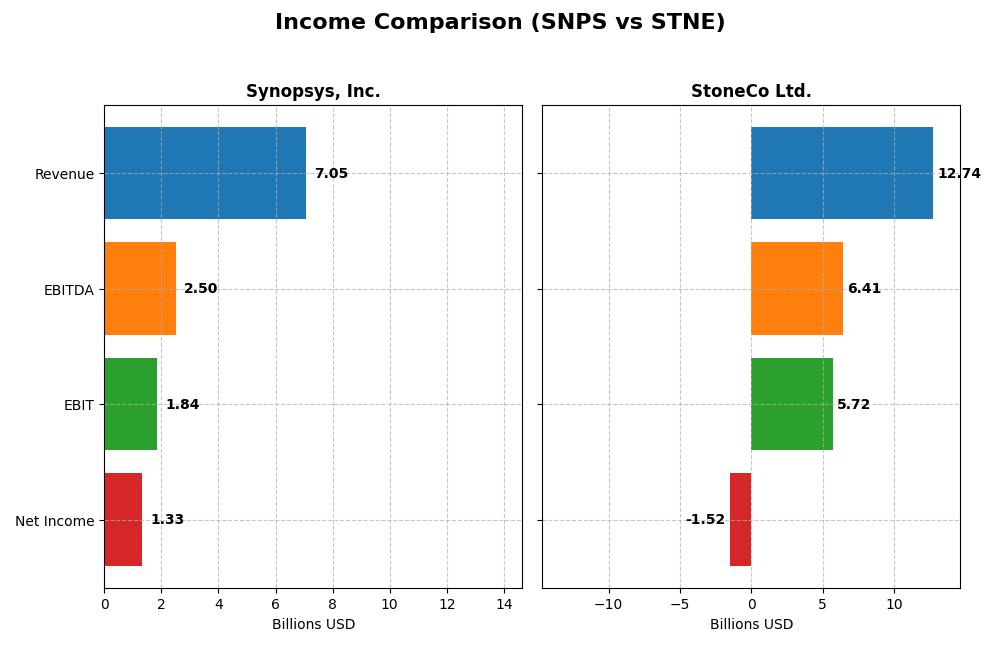
This table presents a side-by-side comparison of key income statement metrics for Synopsys, Inc. and StoneCo Ltd. for their most recent fiscal years, highlighting scale and profitability differences.
| Metric | Synopsys, Inc. (SNPS) | StoneCo Ltd. (STNE) |
|---|---|---|
| Market Cap | 98.8B USD | 3.9B BRL |
| Revenue | 7.05B USD | 12.74B BRL |
| EBITDA | 2.50B USD | 6.41B BRL |
| EBIT | 1.84B USD | 5.72B BRL |
| Net Income | 1.33B USD | -1.52B BRL |
| EPS | 8.13 USD | -5.02 BRL |
| Fiscal Year | 2025 | 2024 |
Income Statement Interpretations
Synopsys, Inc.
Synopsys exhibited consistent revenue growth from 2021 to 2025, increasing from $4.2B to $7.1B, with net income rising by 76% overall. Margins remained strong, with a gross margin near 77% and a stable net margin close to 19%. However, in 2025, net income and EPS dropped notably despite revenue and EBIT growth, reflecting margin compression and higher operating expenses.
StoneCo Ltd.
StoneCo’s revenue surged over 300% from 2020 to 2024, reaching BRL 12.7B, though net income deteriorated sharply into losses by 2024. Gross and EBIT margins remained favorable, around 73% and 45%, respectively, but the net margin was negative at nearly -12%. The latest year showed revenue and EBIT growth, yet net income and earnings per share plunged significantly, indicating profitability challenges.
Which one has the stronger fundamentals?
Synopsys demonstrates stronger fundamentals with favorable revenue and net income growth, stable and high margins, and a positive long-term earnings trend despite recent margin pressures. StoneCo’s impressive top-line expansion contrasts with persistent net losses and negative margins, which pose higher risks. Overall, Synopsys’s financial performance reflects more consistent profitability and operational stability.
Financial Ratios Comparison
Below is a comparison of key financial ratios for Synopsys, Inc. (SNPS) and StoneCo Ltd. (STNE) based on the most recent fiscal year data available.
| Ratios | Synopsys, Inc. (SNPS) 2025 | StoneCo Ltd. (STNE) 2024 |
|---|---|---|
| ROE | 4.72% | -12.87% |
| ROIC | 1.97% | 22.41% |
| P/E | 54.36 | -9.84 |
| P/B | 2.57 | 1.27 |
| Current Ratio | 1.62 | 1.37 |
| Quick Ratio | 1.52 | 1.37 |
| D/E (Debt-to-Equity) | 0.50 | 1.10 |
| Debt-to-Assets | 29.64% | 23.53% |
| Interest Coverage | 2.05 | 5.57 |
| Asset Turnover | 0.15 | 0.23 |
| Fixed Asset Turnover | 5.04 | 6.95 |
| Payout ratio | 0% | 0% |
| Dividend yield | 0% | 0% |
Interpretation of the Ratios
Synopsys, Inc.
Synopsys shows a mixed ratio profile with favorable net margin (18.96%) and liquidity ratios (current ratio 1.62, quick ratio 1.52), but weak returns on equity (4.72%) and invested capital (1.97%), alongside a high PE ratio (54.36). Its dividend yield is zero, indicating no dividends paid; this likely reflects a reinvestment or growth strategy without share buybacks.
StoneCo Ltd.
StoneCo presents a challenging picture with negative net margin (-11.89%) and return on equity (-12.87%), though it has a strong return on invested capital (22.41%) and favorable valuation multiples (PE negative but considered favorable, PB 1.27). The liquidity ratios are adequate, but debt levels are high (D/E 1.1). It does not pay dividends, possibly due to losses and a focus on expansion.
Which one has the best ratios?
StoneCo has a slightly favorable overall ratio profile due to strength in return on invested capital and valuation, despite profitability issues and leverage concerns. Synopsys exhibits a balanced but neutral stance with good profitability and liquidity but weaker returns and high valuation. The choice depends on prioritizing profitability versus growth and reinvestment risks.
Strategic Positioning
This section compares the strategic positioning of Synopsys, Inc. and StoneCo Ltd. regarding market position, key segments, and exposure to technological disruption:
Synopsys, Inc.
- Leading software infrastructure provider with significant market cap; faces competitive pressure in tech sector.
- Diverse segments: electronic design automation software, IP solutions, verification, and security for multiple industries.
- Exposure through advanced electronic design automation and security testing technologies; innovation critical for competitiveness.
StoneCo Ltd.
- Smaller market cap fintech focusing on Brazilian merchants; competitive pressure from regional and global players.
- Concentrated on financial technology solutions for small-to-medium merchants in Brazil, including digital and in-store commerce.
- Exposure linked to fintech innovations and digital payment platforms; adapts to changing e-commerce and digital transaction trends.
Synopsys, Inc. vs StoneCo Ltd. Positioning
Synopsys follows a diversified technology infrastructure approach addressing multiple industries, offering various software and IP solutions. StoneCo concentrates on fintech services for Brazilian merchants, focusing on payments and commerce technology, limiting its market scope but deepening regional penetration.
Which has the best competitive advantage?
StoneCo demonstrates a very favorable moat with growing ROIC and value creation, indicating durable competitive advantage. Synopsys shows a very unfavorable moat with declining ROIC and value destruction, signaling challenges in sustaining profitability.
Stock Comparison
This chart highlights the stock price movements of Synopsys, Inc. (SNPS) and StoneCo Ltd. (STNE) over the past 12 months, revealing contrasting bearish trends with differing volatility and recent momentum patterns.

Trend Analysis
Synopsys, Inc. (SNPS) experienced a bearish trend over the past year with a -10.31% price change, showing acceleration in its downward movement, a high volatility level (std dev 58.85), and a price range from 388.13 to 621.3. However, recent weeks indicate a bullish reversal with a 13.77% gain.
StoneCo Ltd. (STNE) also showed a bearish trend over the last 12 months, declining -13.9% with decelerating losses and low volatility (std dev 2.92). Its price fluctuated between 7.85 and 19.4, but recent performance worsened with a -23.78% decline.
Comparing both stocks, SNPS delivered a smaller overall loss and demonstrated a recent bullish recovery, outperforming STNE which faced a steeper decline and ongoing downside momentum.
Target Prices
The current analyst consensus presents a clear outlook on target prices for Synopsys, Inc. and StoneCo Ltd.
| Company | Target High | Target Low | Consensus |
|---|---|---|---|
| Synopsys, Inc. | 600 | 425 | 530 |
| StoneCo Ltd. | 20 | 20 | 20 |
Analysts expect Synopsys shares to trade moderately above the current price of $516.31, indicating potential upside. StoneCo’s consensus target of $20 suggests room for growth from its current $14.49, reflecting positive market sentiment.
Analyst Opinions Comparison
This section compares analysts’ ratings and grades for Synopsys, Inc. and StoneCo Ltd.:
Rating Comparison
Synopsys, Inc. Rating
- Rating: B-, considered very favorable by analysts.
- Discounted Cash Flow Score: Moderate, rated 3.
- ROE Score: Moderate, rated 3, indicating decent efficiency.
- ROA Score: Moderate, rated 3, reflecting effective asset use.
- Debt To Equity Score: Moderate, rated 2, indicating moderate financial risk.
- Overall Score: Moderate, rated 3.
StoneCo Ltd. Rating
- Rating: C, also considered very favorable.
- Discounted Cash Flow Score: Moderate, rated 3.
- ROE Score: Very unfavorable, rated 1, showing low efficiency.
- ROA Score: Very unfavorable, rated 1, showing poor asset use.
- Debt To Equity Score: Very unfavorable, rated 1, indicating high financial risk.
- Overall Score: Moderate, rated 2.
Which one is the best rated?
Based strictly on the provided data, Synopsys holds a higher overall rating and better scores across ROE, ROA, and debt-to-equity metrics compared to StoneCo, indicating a stronger financial standing.
Scores Comparison
Here is a comparison of the Altman Z-Score and Piotroski Score for Synopsys and StoneCo:
Synopsys Scores
- Altman Z-Score: 3.54, indicating a safe zone.
- Piotroski Score: 4, classified as average.
StoneCo Scores
- Altman Z-Score: 1.02, indicating distress zone.
- Piotroski Score: 5, classified as average.
Which company has the best scores?
Synopsys has a significantly higher Altman Z-Score placing it in the safe zone, while StoneCo is in the distress zone. Both companies have average Piotroski Scores, with StoneCo slightly higher by one point.
Grades Comparison
Here is the comparison of recent grades and analyst ratings for Synopsys, Inc. and StoneCo Ltd.:
Synopsys, Inc. Grades
The following table summarizes recent analyst grades from major financial institutions:
| Grading Company | Action | New Grade | Date |
|---|---|---|---|
| Piper Sandler | Downgrade | Neutral | 2026-01-13 |
| Morgan Stanley | Maintain | Overweight | 2025-12-12 |
| Rosenblatt | Maintain | Buy | 2025-12-11 |
| Keybanc | Maintain | Overweight | 2025-12-11 |
| Piper Sandler | Maintain | Overweight | 2025-12-11 |
| Needham | Maintain | Buy | 2025-12-11 |
| B of A Securities | Upgrade | Buy | 2025-12-11 |
| JP Morgan | Maintain | Overweight | 2025-12-11 |
| Wells Fargo | Maintain | Equal Weight | 2025-12-11 |
| Rosenblatt | Upgrade | Buy | 2025-12-09 |
Synopsys shows a predominantly positive rating trend with multiple “Buy” and “Overweight” grades and only one recent downgrade to “Neutral.”
StoneCo Ltd. Grades
The following table shows recent analyst grades for StoneCo Ltd.:
| Grading Company | Action | New Grade | Date |
|---|---|---|---|
| Goldman Sachs | Maintain | Buy | 2025-10-14 |
| B of A Securities | Maintain | Buy | 2025-09-09 |
| UBS | Maintain | Buy | 2025-08-29 |
| JP Morgan | Maintain | Overweight | 2025-07-16 |
| Barclays | Maintain | Equal Weight | 2025-05-12 |
| Barclays | Maintain | Equal Weight | 2025-04-23 |
| Citigroup | Upgrade | Buy | 2025-04-22 |
| Barclays | Maintain | Equal Weight | 2025-03-21 |
| Morgan Stanley | Maintain | Underweight | 2025-03-21 |
| Goldman Sachs | Maintain | Buy | 2025-02-06 |
StoneCo’s ratings are mixed with several “Buy” grades but also multiple “Equal Weight” and one “Underweight,” indicating more cautious sentiment.
Which company has the best grades?
Synopsys, Inc. has received generally stronger and more consistent buy and overweight grades compared to StoneCo Ltd., whose ratings show more variation and some cautious stances. This difference may influence investors’ perceptions of growth potential and risk profiles between the two companies.
Strengths and Weaknesses
Here is a comparative overview of key strengths and weaknesses for Synopsys, Inc. (SNPS) and StoneCo Ltd. (STNE) based on the most recent financial and performance data.
| Criterion | Synopsys, Inc. (SNPS) | StoneCo Ltd. (STNE) |
|---|---|---|
| Diversification | Strong in software licensing and services, with $3.49B in License and Maintenance revenue (2025) | Primarily focused on digital payments and financial services in Brazil |
| Profitability | Moderate net margin (18.96%), but low ROIC (1.97%) and declining profitability | Negative net margin (-11.89%) and ROE (-12.87%), but strong ROIC (22.41%) indicating efficient capital use |
| Innovation | High innovation in technology services, but declining economic moat and profitability | Growing ROIC and durable competitive advantage indicating strong innovation in fintech space |
| Global presence | Well-established global footprint in semiconductor software | Regional focus in Latin America limits global exposure |
| Market Share | Significant in EDA software market, supported by license sales growth | Growing market share in Brazilian fintech but faces competitive pressures |
Key takeaways: Synopsys shows solid revenue diversification and global presence but struggles with declining profitability and value destruction. StoneCo demonstrates a strong competitive moat with growing ROIC but suffers from negative margins and regional concentration risk. Investors should weigh Synopsys’s stability against StoneCo’s growth potential and volatility.
Risk Analysis
Below is a comparative table highlighting key risks for Synopsys, Inc. (SNPS) and StoneCo Ltd. (STNE) based on the most recent financial and market data.
| Metric | Synopsys, Inc. (SNPS) | StoneCo Ltd. (STNE) |
|---|---|---|
| Market Risk | Beta 1.12, moderate volatility | Beta 1.84, high volatility |
| Debt Level | Debt/Equity 0.5, moderate | Debt/Equity 1.1, elevated |
| Regulatory Risk | Moderate, US technology sector | High, fintech in Brazil with evolving regulations |
| Operational Risk | Moderate, large global software provider | Moderate, fintech reliant on digital infrastructure |
| Environmental Risk | Low, software company | Low, fintech company |
| Geopolitical Risk | Moderate, US-based with global clients | High, exposure to Latin America political climate |
The most impactful risks are StoneCo’s high regulatory and geopolitical exposure in Brazil, combined with elevated debt levels, which increases financial vulnerability. Synopsys faces moderate market and operational risks but benefits from a stronger balance sheet and more stable regulatory environment. Investors should weigh StoneCo’s higher growth potential against its elevated financial and geopolitical risks.
Which Stock to Choose?
Synopsys, Inc. (SNPS) shows favorable income growth with a 15.12% revenue increase in 2025 and solid profitability metrics like an 18.89% net margin. Financial ratios are mixed, with a neutral global evaluation, supported by moderate liquidity and manageable debt. The company’s rating is very favorable (B-), yet its economic moat is very unfavorable due to declining ROIC below WACC, indicating value destruction.
StoneCo Ltd. (STNE) reports favorable revenue growth of 12.1% in 2024, but suffers from negative net margin (-11.89%) and losses on equity. Its financial ratios are slightly favorable overall, reflecting efficient capital use but higher leverage risks. Despite a very favorable rating (C), the company’s Altman Z-Score signals distress, though its economic moat is very favorable with growing ROIC above WACC, suggesting competitive advantage.
Investors seeking companies with durable competitive moats and growing profitability might find StoneCo’s profile more aligned with growth strategies, while risk-averse investors valuing stable income and moderate financial ratios could interpret Synopsys’s metrics as more suitable. The contrasting ratings and income evaluations imply that choice depends on individual risk tolerance and investment focus.
Disclaimer: Investment carries a risk of loss of initial capital. The past performance is not a reliable indicator of future results. Be sure to understand risks before making an investment decision.
Go Further
I encourage you to read the complete analyses of Synopsys, Inc. and StoneCo Ltd. to enhance your investment decisions: