In the rapidly evolving semiconductor industry, STMicroelectronics N.V. (STM) and Tower Semiconductor Ltd. (TSEM) stand out as key players with distinct yet overlapping market approaches. STM, a global leader in automotive and analog semiconductor solutions, contrasts with TSEM’s specialization in analog mixed-signal foundry services. Both companies drive innovation, making them compelling choices for investors seeking growth in technology. This article will help you determine which company offers the most promising investment opportunity.
Table of contents
Companies Overview
I will begin the comparison between STMicroelectronics N.V. and Tower Semiconductor Ltd. by providing an overview of these two companies and their main differences.
STMicroelectronics N.V. Overview
STMicroelectronics N.V. is a global semiconductor company that designs, develops, manufactures, and sells a wide range of semiconductor products. Operating through segments such as Automotive and Discrete, Analog, MEMS and Sensors, and Microcontrollers and Digital ICs, it serves automotive, industrial, personal electronics, and communication markets. Headquartered in Schiphol, the Netherlands, STM has a market capitalization of approximately 25B USD.
Tower Semiconductor Ltd. Overview
Tower Semiconductor Ltd. is an independent semiconductor foundry specializing in analog-intensive mixed-signal semiconductor devices. It offers customizable process technologies and wafer fabrication services targeting markets including consumer electronics, automotive, aerospace, and medical devices. Based in Migdal Haemek, Israel, Tower operates with a market cap near 13.9B USD and focuses on foundry and design enablement services.
Key similarities and differences
Both STM and Tower operate in the semiconductor industry, serving diverse markets such as automotive and industrial electronics. However, STM emphasizes integrated semiconductor product design and manufacturing across multiple segments, while Tower primarily provides foundry services and customizable process technologies. STM’s scale is considerably larger with over 49K employees, contrasting with Tower’s focus on wafer fabrication and about 5.6K employees, reflecting different business models within the sector.
Income Statement Comparison
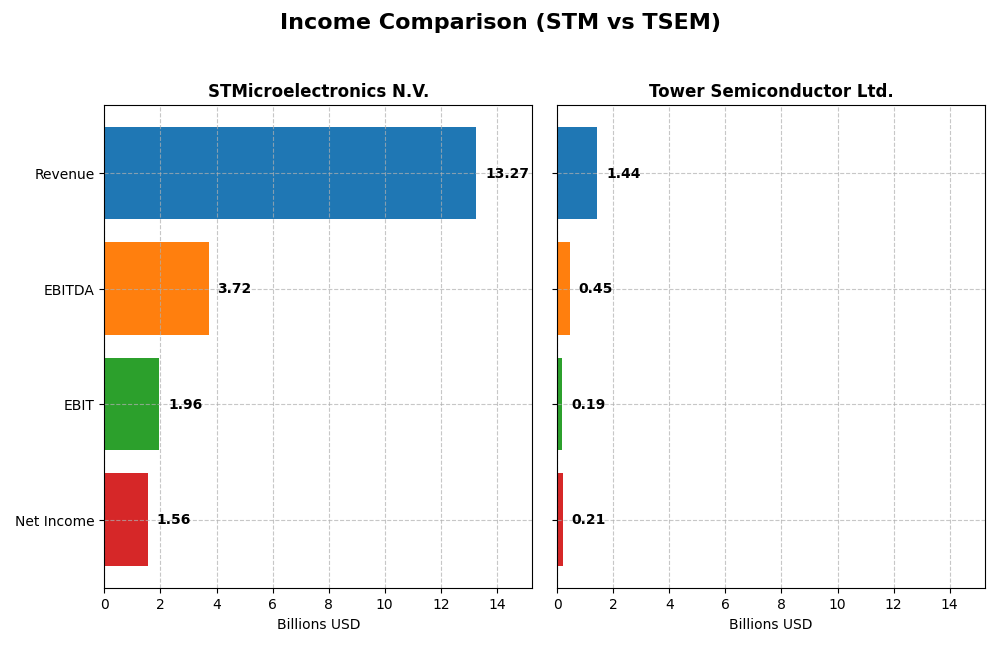
The table below presents a side-by-side comparison of key income statement metrics for STMicroelectronics N.V. and Tower Semiconductor Ltd. for the fiscal year 2024.
| Metric | STMicroelectronics N.V. | Tower Semiconductor Ltd. |
|---|---|---|
| Market Cap | 24.99B | 13.86B |
| Revenue | 13.27B | 1.44B |
| EBITDA | 3.72B | 451M |
| EBIT | 1.96B | 185M |
| Net Income | 1.56B | 208M |
| EPS | 1.73 | 1.87 |
| Fiscal Year | 2024 | 2024 |
Income Statement Interpretations
STMicroelectronics N.V.
STMicroelectronics saw overall revenue growth of 29.85% and net income growth of 40.78% from 2020 to 2024, with improving net margin by 8.42%. However, the most recent year showed a 23.24% revenue decline and a 51.83% drop in net margin, indicating a slowdown. Despite this, margins remain favorable with a gross margin of 39.34% and net margin of 11.73%.
Tower Semiconductor Ltd.
Tower Semiconductor experienced a 13.47% revenue increase and a strong 152.56% net income growth over 2020-2024, alongside a significant 122.59% improvement in net margin. The latest year, however, revealed a flat 0.94% revenue growth and a sharp 60.29% decrease in net margin, signaling recent margin pressure despite overall positive trends and a solid net margin of 14.47%.
Which one has the stronger fundamentals?
Both companies display favorable global income statement evaluations with 57.14% favorable metrics. STMicroelectronics boasts higher absolute revenue and net income but faced a sharper recent decline. Tower Semiconductor shows remarkable net income growth and margin improvement over the period, though recent margin contraction tempers this. Fundamentally, both have strengths, but recent performance challenges warrant careful consideration.
Financial Ratios Comparison
Below is a comparison of key financial ratios for STMicroelectronics N.V. (STM) and Tower Semiconductor Ltd. (TSEM) based on their most recent fiscal year data for 2024.
| Ratios | STMicroelectronics N.V. (STM) | Tower Semiconductor Ltd. (TSEM) |
|---|---|---|
| ROE | 8.92% | 7.83% |
| ROIC | 6.34% | 6.41% |
| P/E | 14.43 | 27.54 |
| P/B | 1.29 | 2.16 |
| Current Ratio | 3.11 | 6.18 |
| Quick Ratio | 2.37 | 5.23 |
| D/E (Debt to Equity) | 0.18 | 0.07 |
| Debt-to-Assets | 12.80% | 5.87% |
| Interest Coverage | 19.72 | 32.64 |
| Asset Turnover | 0.54 | 0.47 |
| Fixed Asset Turnover | 1.22 | 1.11 |
| Payout Ratio | 18.50% | 0% |
| Dividend Yield | 1.28% | 0% |
Interpretation of the Ratios
STMicroelectronics N.V.
STMicroelectronics shows a balanced ratio profile with favorable net margin (11.73%) and valuation metrics like PE (14.43) and PB (1.29), indicating reasonable market pricing. However, the ROE at 8.92% is marked unfavorable, and the current ratio of 3.11 signals liquidity concerns. Dividend yield stands at 1.28%, reflecting moderate shareholder returns with some caution needed on payout sustainability.
Tower Semiconductor Ltd.
Tower Semiconductor presents a strong net margin (14.47%) and excellent interest coverage (31.57), but its high PE ratio (27.54) raises valuation concerns. The company has a very high current ratio (6.18), flagged as unfavorable possibly due to inefficient asset use. It does not pay dividends, likely reinvesting profits to support growth and R&D priorities.
Which one has the best ratios?
Both companies receive a slightly favorable global assessment, but STMicroelectronics benefits from more balanced valuation and dividend metrics, while Tower Semiconductor’s higher net margin contrasts with its elevated PE and liquidity imbalances. The choice depends on investor preference for valuation discipline versus growth reinvestment.
Strategic Positioning
This section compares the strategic positioning of STM and TSEM, including market position, key segments, and exposure to technological disruption:
STMicroelectronics N.V. (STM)
- Large market cap of 25B USD with diversified global semiconductor presence, facing moderate competitive pressure.
- Operates across automotive, industrial, personal electronics, and communications with broad product segments.
- Exposure to evolving semiconductor technologies via analog, MEMS, and microcontrollers segments.
Tower Semiconductor Ltd. (TSEM)
- Mid-size market cap of 13.9B USD as an independent foundry, competing in niche analog and mixed-signal segments.
- Focuses on analog intensive mixed-signal devices and wafer fabrication services for varied industries.
- Provides customizable process technologies including SiGe, BiCMOS, RF CMOS, and MEMS, adapting to tech changes.
STM vs TSEM Positioning
STM shows a diversified product and market approach with broad industry coverage, while TSEM concentrates on analog mixed-signal foundry services. STM’s scale offers potential advantages in market reach, whereas TSEM’s specialization targets customizable manufacturing solutions.
Which has the best competitive advantage?
Both companies are shedding value with ROIC below WACC; STM’s declining profitability contrasts with TSEM’s improving ROIC trend, suggesting TSEM may be better positioned to enhance future value creation despite current challenges.
Stock Comparison
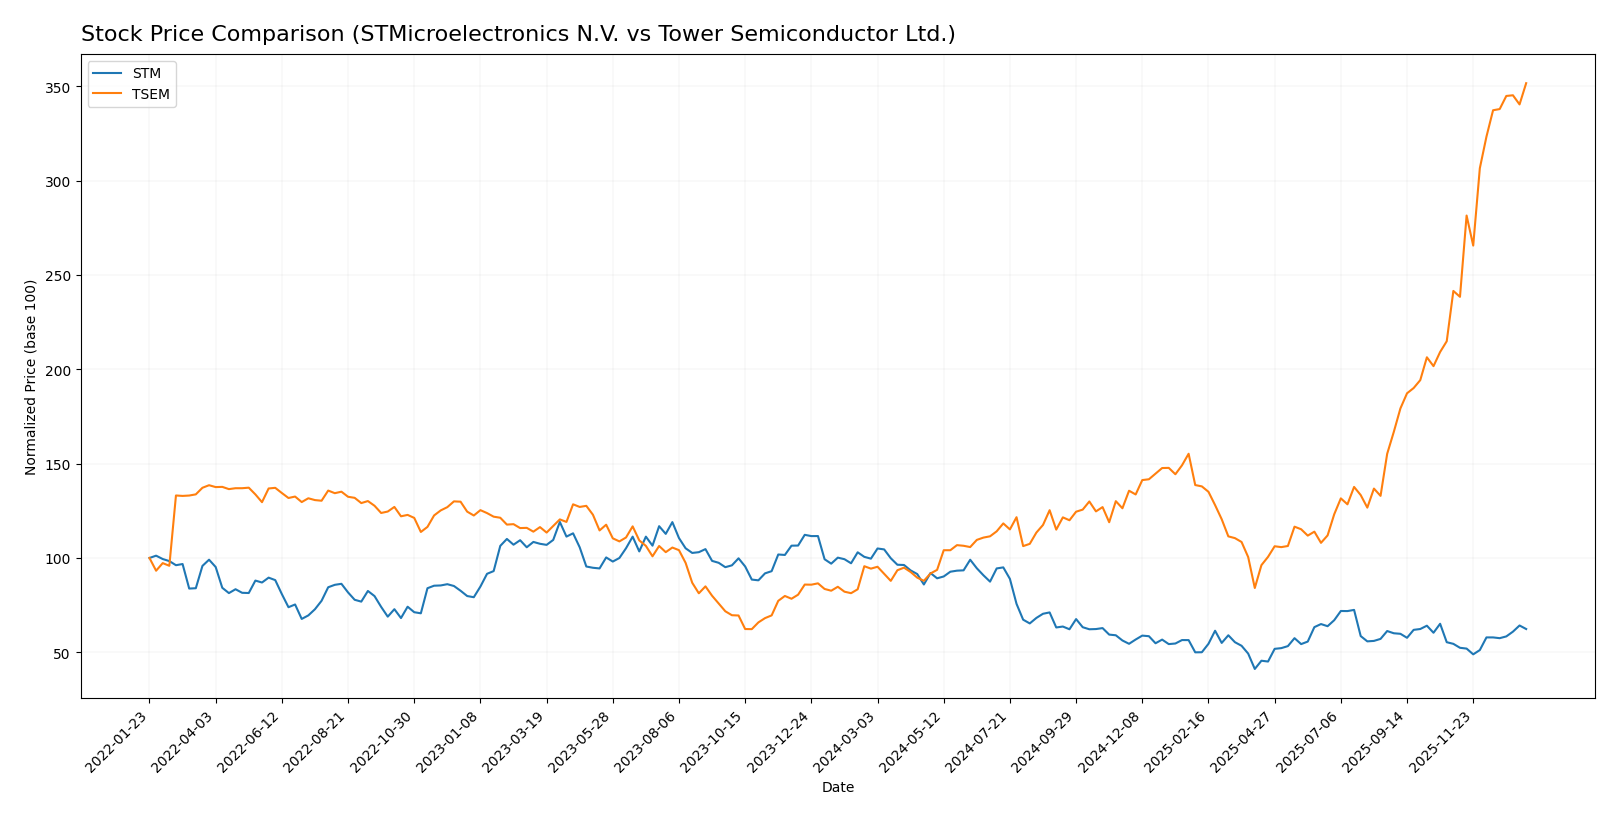
The stock prices of STMicroelectronics N.V. (STM) and Tower Semiconductor Ltd. (TSEM) have shown contrasting dynamics over the past 12 months, with STM experiencing a significant overall decline but recent recovery, while TSEM has exhibited strong and accelerating growth throughout the year.
Trend Analysis
STMicroelectronics N.V. (STM) recorded a bearish trend over the past 12 months with a price decline of -37.43%, showing acceleration and a standard deviation of 7.14. Recently, STM reversed course with a 14.43% gain, indicating a short-term bullish momentum.
Tower Semiconductor Ltd. (TSEM) demonstrated a bullish trend with a 272.71% price increase over the same period, supported by accelerating growth and high volatility (std deviation 23.67). Its recent 45.59% gain confirms strong upward momentum.
Comparing both stocks, TSEM outperformed STM substantially in market performance over the past year, delivering the highest returns with strong buyer dominance and accelerating price appreciation.
Target Prices
Analysts provide a clear consensus for the target prices of STMicroelectronics N.V. and Tower Semiconductor Ltd.
| Company | Target High | Target Low | Consensus |
|---|---|---|---|
| STMicroelectronics N.V. | 45 | 26.5 | 34.88 |
| Tower Semiconductor Ltd. | 125 | 66 | 96 |
The consensus target price for STMicroelectronics at 34.88 USD suggests moderate upside potential versus its current price of 28 USD. Tower Semiconductor’s consensus target at 96 USD is slightly below the current price of 124 USD, indicating a cautious outlook from analysts.
Analyst Opinions Comparison
This section compares analysts’ ratings and grades for STMicroelectronics N.V. (STM) and Tower Semiconductor Ltd. (TSEM):
Rating Comparison
STM Rating
- Rating: B, indicating a very favorable overall evaluation.
- Discounted Cash Flow Score: 3, a moderate score suggesting fair valuation.
- ROE Score: 2, moderate efficiency in generating profit from equity.
- ROA Score: 3, moderate effectiveness in asset utilization.
- Debt To Equity Score: 3, moderate financial risk with balanced leverage.
- Overall Score: 3, moderate overall financial standing.
TSEM Rating
- Rating: B+, also reflecting a very favorable overall evaluation.
- Discounted Cash Flow Score: 3, similarly moderate, indicating fair valuation.
- ROE Score: 3, moderate but higher efficiency in profit generation.
- ROA Score: 4, favorable effectiveness in asset utilization.
- Debt To Equity Score: 4, favorable, indicating lower financial risk.
- Overall Score: 3, moderate overall financial standing.
Which one is the best rated?
Based strictly on the provided data, TSEM holds a slightly better rating with a B+ versus STM’s B. TSEM outperforms STM in ROE, ROA, and Debt to Equity scores, indicating stronger profitability and financial stability.
Scores Comparison
Here is a comparison of the Altman Z-Score and Piotroski Score for the two companies:
STM Scores
- Altman Z-Score: 3.96, indicating a safe zone status.
- Piotroski Score: 7, reflecting strong financial health.
TSEM Scores
- Altman Z-Score: 21.06, indicating a safe zone status.
- Piotroski Score: 7, reflecting strong financial health.
Which company has the best scores?
Both STM and TSEM are in the safe zone by Altman Z-Score standards, but TSEM’s score is significantly higher. Both companies share identical Piotroski Scores of 7, indicating similarly strong financial health.
Grades Comparison
Here is the comparison of grades for STMicroelectronics N.V. and Tower Semiconductor Ltd.:
STMicroelectronics N.V. Grades
The following table summarizes recent grades and rating actions from reputable grading companies for STMicroelectronics N.V.:
| Grading Company | Action | New Grade | Date |
|---|---|---|---|
| TD Cowen | Maintain | Buy | 2025-10-24 |
| Susquehanna | Maintain | Positive | 2025-10-22 |
| Susquehanna | Maintain | Positive | 2025-07-25 |
| Susquehanna | Maintain | Positive | 2025-07-22 |
| Baird | Upgrade | Outperform | 2025-07-22 |
| Jefferies | Upgrade | Buy | 2025-02-19 |
| Bernstein | Downgrade | Market Perform | 2025-02-05 |
| Susquehanna | Maintain | Positive | 2025-01-31 |
| Barclays | Downgrade | Underweight | 2025-01-22 |
| JP Morgan | Downgrade | Neutral | 2024-12-09 |
Overall, STMicroelectronics N.V. shows a mixed trend with several upgrades and downgrades, maintaining a general Buy/Positive consensus but with some recent cautious ratings.
Tower Semiconductor Ltd. Grades
The table below details the recent grades and rating actions for Tower Semiconductor Ltd. from established grading companies:
| Grading Company | Action | New Grade | Date |
|---|---|---|---|
| Benchmark | Maintain | Buy | 2026-01-09 |
| Wedbush | Downgrade | Neutral | 2025-12-31 |
| Benchmark | Maintain | Buy | 2025-11-11 |
| Susquehanna | Maintain | Positive | 2025-11-11 |
| Wedbush | Maintain | Outperform | 2025-11-11 |
| Barclays | Maintain | Equal Weight | 2025-11-11 |
| Benchmark | Maintain | Buy | 2025-09-08 |
| Susquehanna | Maintain | Positive | 2025-08-05 |
| Benchmark | Maintain | Buy | 2025-08-05 |
| Benchmark | Maintain | Buy | 2025-08-04 |
Tower Semiconductor Ltd. exhibits a stable pattern with mostly maintained Buy and Positive ratings, alongside a few neutral stances but no downgrades to Sell or Underweight.
Which company has the best grades?
Both companies carry a consensus Buy rating, but Tower Semiconductor Ltd. holds a more consistent series of Buy and Positive grades without significant downgrades. STMicroelectronics N.V. has experienced more volatility in grades, which could imply a higher perceived risk or mixed outlook for investors.
Strengths and Weaknesses
Below is a comparison table highlighting the strengths and weaknesses of STMicroelectronics N.V. (STM) and Tower Semiconductor Ltd. (TSEM) based on the most recent financial and strategic data available.
| Criterion | STMicroelectronics N.V. (STM) | Tower Semiconductor Ltd. (TSEM) |
|---|---|---|
| Diversification | Strong product diversification with $13.2B in product sales, plus services; broad industrial and automotive segments | Less diversified; focuses mainly on semiconductor foundry services |
| Profitability | Moderate net margin (11.7%) and ROIC (6.3%), but ROIC below WACC indicates value destruction | Higher net margin (14.5%), ROIC slightly above 6%, but also below WACC; profitability improving |
| Innovation | Established player with broad product range; investment in analog, MEMS, microcontrollers | Focused on specialized foundry technology; innovation tied to niche processes |
| Global presence | Large multinational footprint with diverse markets served globally | Smaller global footprint, more niche market presence |
| Market Share | Significant market share in several semiconductor segments with steady product revenue growth | Smaller market share but showing improving operational efficiency and profitability |
Key takeaways: STM offers strong product diversification and a broad industrial reach, but is currently facing value destruction with declining ROIC. TSEM, while less diversified, is improving profitability and ROIC, suggesting potential for value creation despite a smaller scale. Investors should weigh STM’s established market position against TSEM’s growth trajectory and focus on risk management accordingly.
Risk Analysis
Below is a comparative table of key risk factors for STMicroelectronics N.V. (STM) and Tower Semiconductor Ltd. (TSEM) based on the most recent 2024 data:
| Metric | STMicroelectronics N.V. (STM) | Tower Semiconductor Ltd. (TSEM) |
|---|---|---|
| Market Risk | Beta 1.29 (moderate volatility) | Beta 0.88 (lower volatility) |
| Debt level | Low debt-to-equity 0.18 (favorable) | Very low debt-to-equity 0.07 (favorable) |
| Regulatory Risk | Moderate (operates globally, subject to diverse regulations) | Moderate (global foundry with exposure to multiple regulatory environments) |
| Operational Risk | High complexity with multiple segments and large workforce (49.6K employees) | Smaller scale (5.6K employees), but reliant on foundry capacity and technology |
| Environmental Risk | Moderate (semiconductor manufacturing impact, ongoing sustainability efforts) | Moderate (similar manufacturing footprint and environmental challenges) |
| Geopolitical Risk | Exposure to global supply chain disruptions, especially Europe and Asia | Elevated risk due to Israel base and global supply chain sensitivities |
The most likely and impactful risks for both companies center around operational complexities and geopolitical tensions affecting supply chains. STM’s broader geographic footprint and larger scale introduce operational and regulatory challenges, while TSEM faces notable geopolitical risks due to its location and foundry dependencies. Both maintain strong balance sheets with low debt, reducing financial risk.
Which Stock to Choose?
STMicroelectronics N.V. (STM) shows favorable income statement metrics including a strong net margin of 11.73% but experienced a 23.24% revenue decline in the last year. Its financial ratios are slightly favorable overall, with low debt and good interest coverage, though return on equity is less favorable. The company’s rating is very favorable with a moderate overall score, and it is considered to be in a safe zone for bankruptcy risk, despite a very unfavorable economic moat due to declining ROIC.
Tower Semiconductor Ltd. (TSEM) presents a favorable net margin of 14.47% and modest revenue growth over the long term despite a 0.94% increase last year. Its financial ratios are slightly favorable though with more unfavorable aspects than STM, including a high P/E ratio and no dividend yield. TSEM holds a very favorable rating with a moderate overall score and strong Altman Z-Score. The company faces a slightly unfavorable moat status due to value destruction but has a growing ROIC trend.
Investors focused on stability and strong financial health might find STM’s robust rating and safer bankruptcy profile appealing, while those favoring growth and improving profitability could see TSEM’s expanding ROIC and bullish price trend as attractive. Both companies exhibit strengths and risks, suggesting the choice may depend on the investor’s risk tolerance and investment strategy.
Disclaimer: Investment carries a risk of loss of initial capital. The past performance is not a reliable indicator of future results. Be sure to understand risks before making an investment decision.
Go Further
I encourage you to read the complete analyses of STMicroelectronics N.V. and Tower Semiconductor Ltd. to enhance your investment decisions: