Home > Comparison > Technology > TER vs STM
The strategic rivalry between Teradyne, Inc. and STMicroelectronics N.V. shapes the semiconductor sector’s evolution. Teradyne excels as a specialized test equipment provider with a focus on automation and wireless test solutions. In contrast, STMicroelectronics operates a diversified semiconductor manufacturer model spanning automotive, analog, and microcontroller products. This analysis evaluates which corporate strategy offers superior risk-adjusted returns amid shifting technology demands and global supply chain dynamics.
Table of contents
Companies Overview
Teradyne and STMicroelectronics stand as pivotal players in the global semiconductor landscape.
Teradyne, Inc.: Automatic Test Equipment Leader
Teradyne commands the semiconductor testing market by designing and manufacturing automatic test equipment. Its core revenue stems from testing platforms serving automotive, industrial, and communication devices. In 2026, the company sharpens its focus on expanding industrial automation and wireless test solutions to capture emerging technology demand.
STMicroelectronics N.V.: Semiconductor Innovator
STMicroelectronics excels as a diversified semiconductor manufacturer offering automotive ICs, analog products, MEMS sensors, and microcontrollers. It generates revenue through broad product lines catering to automotive, industrial, and personal electronics markets. The 2026 strategy emphasizes innovation in power and sensor technologies to strengthen its foothold across multiple end-markets.
Strategic Collision: Similarities & Divergences
Both firms operate in semiconductors but diverge sharply in approach: Teradyne focuses on testing and automation systems, while STMicroelectronics drives growth via chip manufacturing and product diversity. Their primary battleground lies in automotive and industrial applications, where testing and semiconductor innovation intersect. This contrast defines distinct investment profiles—Teradyne as a niche equipment provider, STMicroelectronics as a broad-based chip supplier.
Income Statement Comparison
This data dissects the core profitability and scalability of both corporate engines to reveal who dominates the bottom line:
| Metric | Teradyne, Inc. (TER) | STMicroelectronics N.V. (STM) |
|---|---|---|
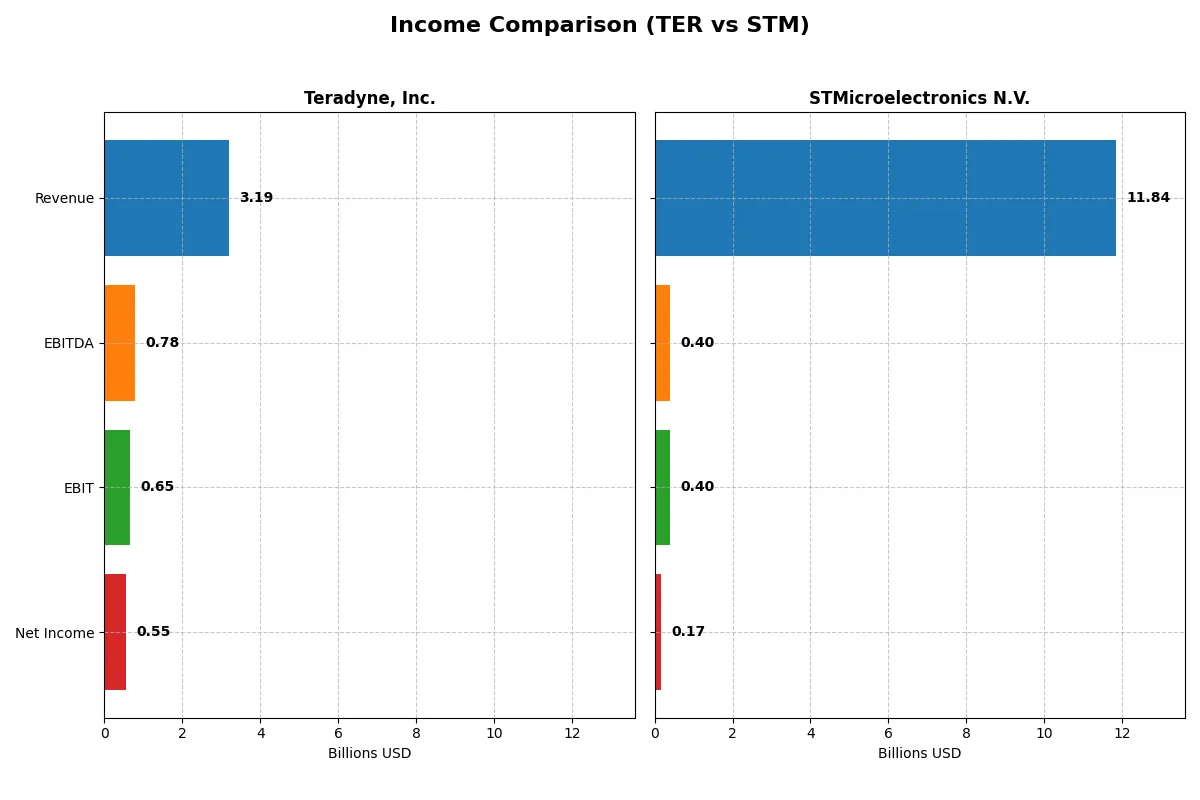
| Revenue | 3.19B | 11.84B |
| Cost of Revenue | 1.32B | 7.83B |
| Operating Expenses | 1.17B | 3.69B |
| Gross Profit | 1.87B | 4.01B |
| EBITDA | 780M | 401M |
| EBIT | 653M | 401M |
| Interest Expense | 8.02M | 0 |
| Net Income | 554M | 0 |
| EPS | 3.49 | 0.19 |
| Fiscal Year | 2025 | 2025 |
Income Statement Analysis: The Bottom-Line Duel
This income statement comparison reveals which company operates with greater efficiency and financial discipline.
Teradyne, Inc. Analysis
Teradyne shows a mixed trajectory with revenue peaking at 3.7B in 2021 before falling to 3.2B in 2025. Net income follows a similar pattern, declining from 1B to 554M. Despite this, Teradyne sustains strong margins: a gross margin of 58.6% and a net margin of 17.4% in 2025. Its operating efficiency remains solid, with a slight EBIT margin dip to 20.5%, signaling resilience.
STMicroelectronics N.V. Analysis
STMicroelectronics commands a larger revenue base, peaking at 17.3B in 2023 but declining to 11.8B in 2025. Net income shrinks dramatically from 4.2B to 167M, reflecting margin compression. Gross margin stands at 33.9% with a weak net margin near 1.4% in 2025. EBIT margin at 3.4% highlights operational struggles, exacerbated by steep declines in profitability and earnings growth.
Margin Strength vs. Scale Vulnerability
Teradyne outperforms STMicroelectronics on margin health and profitability despite smaller scale. Teradyne’s gross and net margins remain robust, maintaining operational discipline amid revenue fluctuations. STMicroelectronics suffers from margin erosion and net income collapse despite higher revenues. For investors prioritizing efficiency and margin resilience, Teradyne’s profile is more compelling.
Financial Ratios Comparison
These vital ratios act as a diagnostic tool to expose underlying fiscal health, valuation premiums, and capital efficiency for the selected companies:
| Ratios | Teradyne, Inc. (TER) | STMicroelectronics N.V. (STM) |
|---|---|---|
| ROE | 19.8% | 0.9% |
| ROIC | 18.4% | 0.7% |
| P/E | 54.6 | 0 |
| P/B | 10.8 | 0 |
| Current Ratio | 1.76 | 3.36 |
| Quick Ratio | 1.41 | 2.43 |
| D/E | 0.12 | 0.12 |
| Debt-to-Assets | 8.3% | 8.6% |
| Interest Coverage | 86.4 | 0 |
| Asset Turnover | 0.76 | 0.48 |
| Fixed Asset Turnover | 4.99 | 1.07 |
| Payout ratio | 13.8% | 0% |
| Dividend yield | 0.25% | 0% |
| Fiscal Year | 2025 | 2025 |
Efficiency & Valuation Duel: The Vital Signs
Financial ratios act as a company’s DNA, uncovering hidden risks and revealing operational strengths that shape investor confidence.
Teradyne, Inc.
Teradyne delivers strong profitability with a 19.82% ROE and 17.37% net margin, signaling operational excellence. However, its valuation appears stretched, trading at a high 54.64 P/E and 10.83 P/B. The company maintains a modest 0.25% dividend yield, emphasizing reinvestment into R&D to fuel long-term growth.
STMicroelectronics N.V.
STMicroelectronics struggles with weak profitability, showing a 0.93% ROE and 1.41% net margin, reflecting operational challenges. Its valuation metrics are favorable with zero P/E and P/B, suggesting undervaluation or transitional phases. It pays no dividends, focusing instead on reinvesting heavily in R&D for future competitiveness.
Premium Valuation vs. Operational Safety
Teradyne balances robust returns and solid operational ratios but trades at a premium, increasing risk. STMicroelectronics offers a cheaper valuation but suffers poor profitability, raising concerns over near-term returns. Investors seeking growth with operational safety may lean toward Teradyne, while risk-tolerant investors eye STMicroelectronics’ turnaround potential.
Which one offers the Superior Shareholder Reward?
Teradyne, Inc. (TER) pays a modest dividend yield near 0.25% with a conservative payout ratio around 14%, supported by robust free cash flow coverage above 2. TER complements dividends with steady buybacks, enhancing total returns sustainably. STMicroelectronics (STM) offers a higher dividend yield near 1.3% but with a payout ratio close to 18%, and its free cash flow is inconsistent, even negative in 2024. STM’s buyback activity is minimal, relying more on dividends. I see TER’s balanced dividend and buyback strategy as more sustainable, delivering superior total shareholder rewards in 2026.
Comparative Score Analysis: The Strategic Profile
The radar chart reveals the fundamental DNA and trade-offs of Teradyne, Inc. and STMicroelectronics N.V. across key financial metrics:
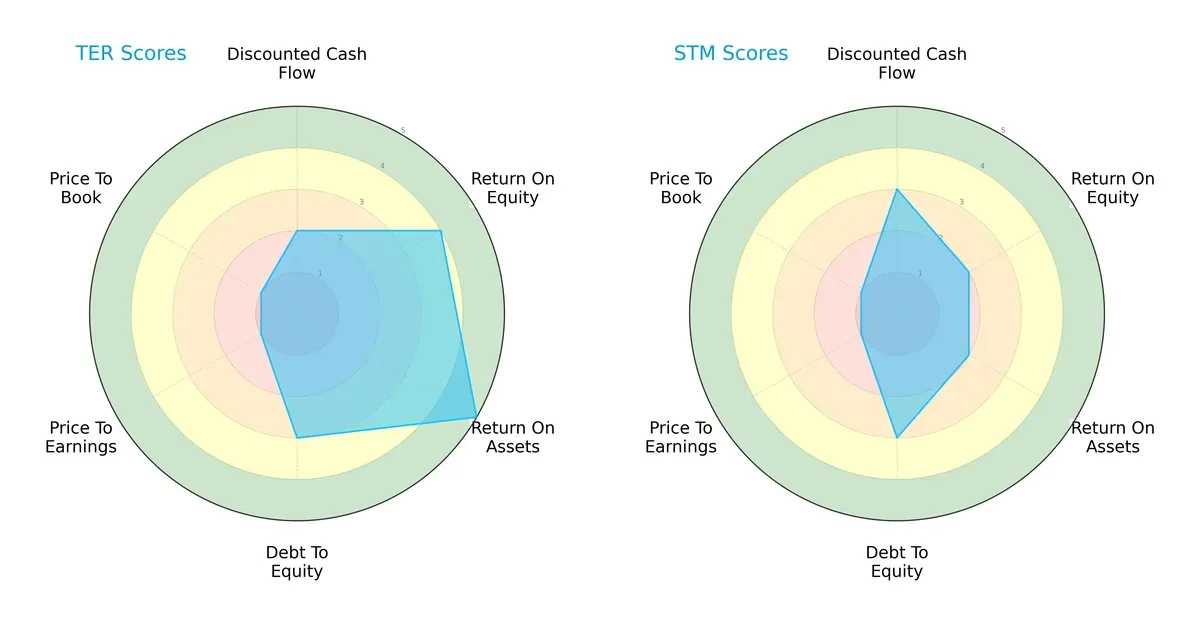
Teradyne showcases a more balanced profile, excelling in ROE (4) and ROA (5), indicating efficient profit generation and asset use. STMicroelectronics scores moderately across the board but lacks Teradyne’s operational edge. Both share moderate debt-to-equity risk (3) and very unfavorable valuation scores (PE/PB at 1), signaling caution on price metrics.
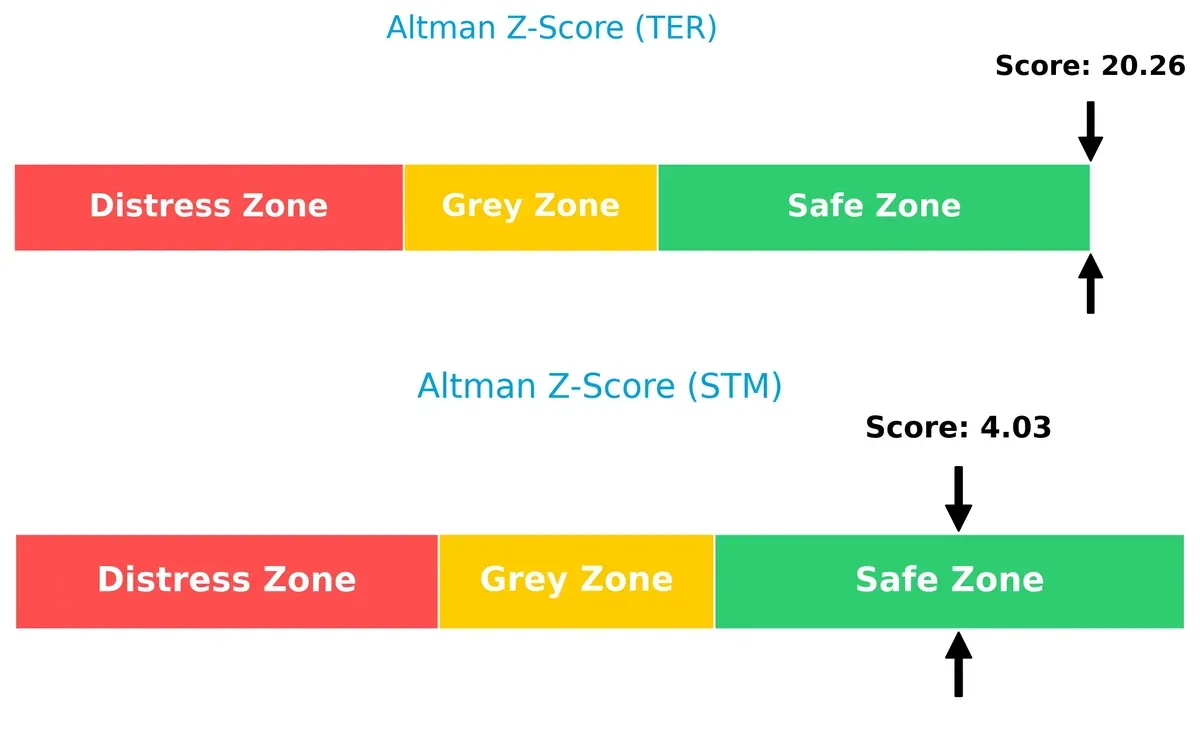
Bankruptcy Risk: Solvency Showdown
Teradyne’s Altman Z-Score (20.3) vastly outperforms STMicroelectronics (4.0), signaling superior solvency and long-term survival odds in this cycle:
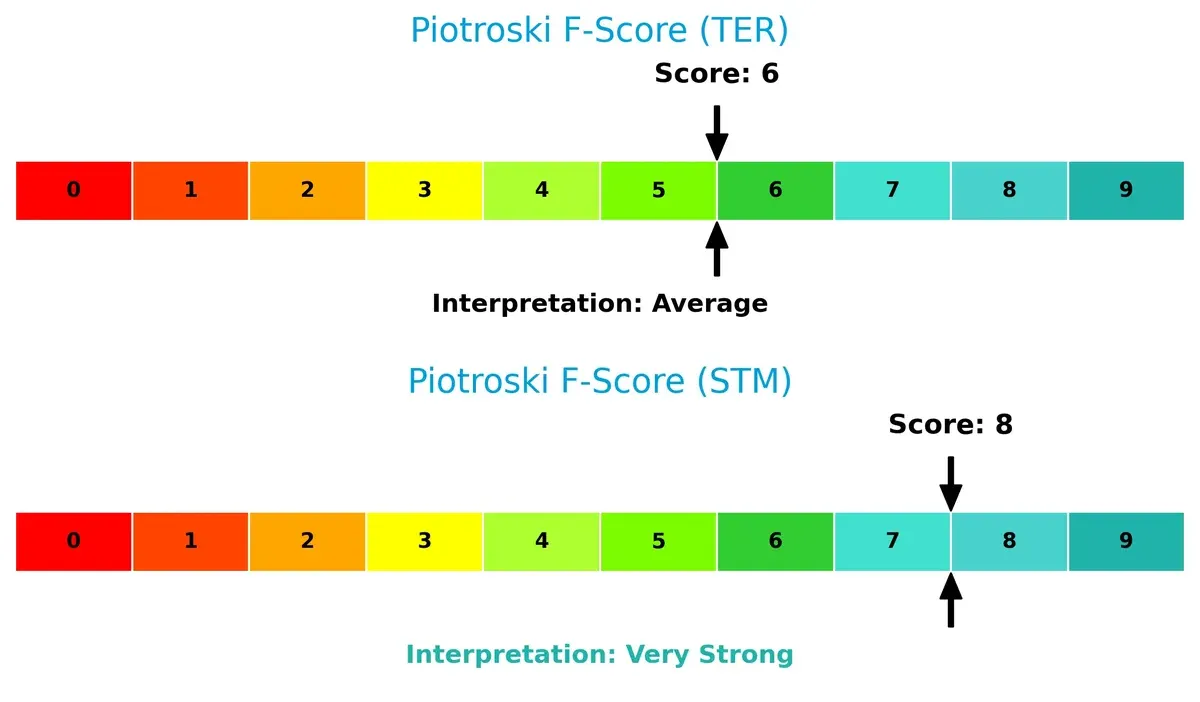
Financial Health: Quality of Operations
STMicroelectronics leads with a Piotroski F-Score of 8, reflecting very strong financial health. Teradyne’s score of 6 is average, indicating some red flags in internal metrics compared to its peer:
How are the two companies positioned?
This section dissects the operational DNA of Teradyne and STMicroelectronics by comparing their revenue distribution and internal dynamics. The goal is to confront their economic moats and identify which business model offers the most resilient competitive advantage today.
Revenue Segmentation: The Strategic Mix
This visual comparison dissects how Teradyne, Inc. and STMicroelectronics N.V. diversify their income streams and where their primary sector bets lie:
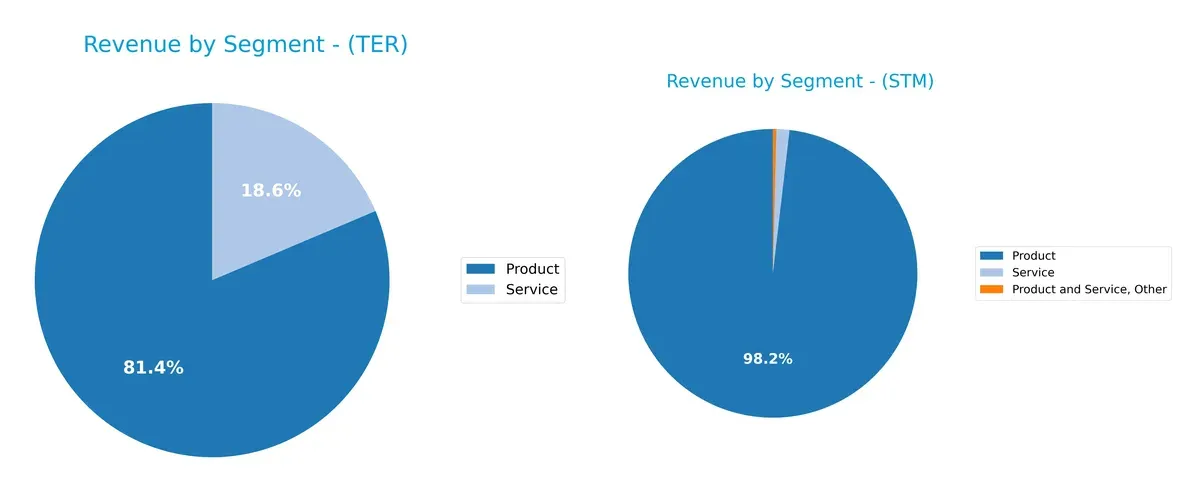
Teradyne anchors its revenue heavily on Products, generating $2.3B in 2024, with Services contributing $525M, reflecting a moderately concentrated but stable mix. STMicroelectronics dwarfs Teradyne in scale, with $13.2B from Products and a small $196M from Services, indicating a dominant product focus but broader segment reporting historically. Teradyne’s reliance on product sales suggests exposure to semiconductor test cycles, while STMicroelectronics’ vast product base signals infrastructure dominance but potential vulnerability to semiconductor industry cyclicality.
Strengths and Weaknesses Comparison
This table compares the Strengths and Weaknesses of Teradyne, Inc. and STMicroelectronics N.V.:
Teradyne Strengths
- Strong profitability with 17.37% net margin
- High ROE at 19.82%
- Favorable ROIC of 18.45%
- Low debt-to-assets at 8.32%
- Robust interest coverage of 81.43
- Diverse geographic revenue including Asia and US
STMicroelectronics Strengths
- Favorable valuation metrics with PE and PB at 0
- Strong quick ratio at 2.43
- Low debt-to-assets at 8.6%
- Infinite interest coverage
- Large global presence with strong Asia Pacific and US sales
Teradyne Weaknesses
- High WACC at 12.35% is unfavorable
- Elevated PE at 54.64 and PB at 10.83
- Dividend yield low at 0.25%
- Asset turnover neutral at 0.76
STMicroelectronics Weaknesses
- Low profitability with 1.41% net margin and 0.93% ROE
- ROIC at 0.67% below WACC
- Current ratio high at 3.36 (unfavorable liquidity)
- Asset turnover weak at 0.48
- Zero dividend yield
Teradyne’s strengths lie in its superior profitability and capital efficiency, while STMicroelectronics benefits from strong liquidity and valuation metrics. Each company faces distinct challenges that could impact their strategic focus on financial health and market competitiveness.
The Moat Duel: Analyzing Competitive Defensibility
A structural moat is the only shield protecting long-term profits from relentless competition and market disruption:
Teradyne, Inc.: Switching Cost Moat
Teradyne dominates through high switching costs in test equipment, reflected in superior 58.5% gross margin and stable EBIT margins. Its robotic automation expansion deepens this moat in 2026.
STMicroelectronics N.V.: Broad Product Portfolio Moat
STM leverages a diversified semiconductor portfolio but faces margin pressure with a slim 3.4% EBIT margin, unlike Teradyne’s robust profitability. Expansion into analog and MEMS segments may offer recovery opportunities.
Defensive Strength: Switching Costs vs. Product Breadth
Teradyne’s switching cost moat creates deeper value, sustaining high ROIC above WACC despite a declining trend. STM’s value destruction and margin compression reveal a weaker moat. Teradyne stands better armed to defend its market share in 2026.
Which stock offers better returns?
The past year shows stark contrast: Teradyne’s shares surged over 160%, driven by accelerating momentum and strong buyer dominance. STMicroelectronics fell over 34%, despite recent modest gains.
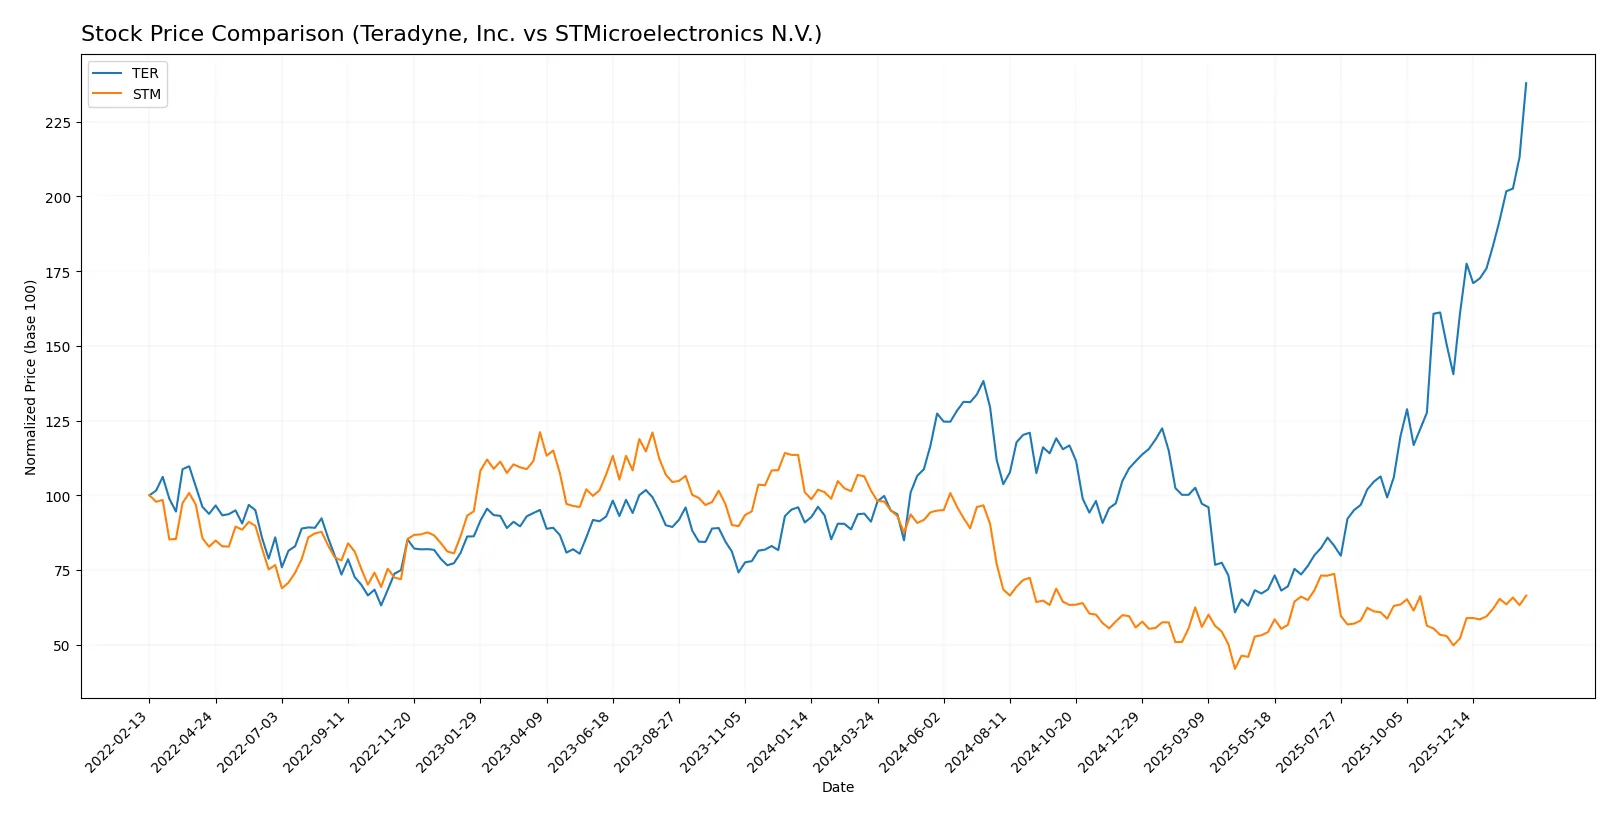
Trend Comparison
Teradyne’s stock rose 161.08% over 12 months, signaling a bullish trend with accelerating gains. Volatility is significant, with a 39.2 standard deviation and a high near 269.
STMicroelectronics declined 34.6% in the same period, a clear bearish trend despite acceleration. Volatility remains low at 6.54, with a recent slight upward slope of 0.58.
Teradyne’s performance outstrips STMicroelectronics significantly, delivering the highest market returns over the past year.
Target Prices
Analysts present a mixed but constructive target consensus for Teradyne, Inc. and STMicroelectronics N.V.
| Company | Target Low | Target High | Consensus |
|---|---|---|---|
| Teradyne, Inc. | 175 | 335 | 276.08 |
| STMicroelectronics N.V. | 28 | 45 | 37.67 |
Teradyne’s consensus target at 276.08 slightly exceeds its current price of 269.07, signaling modest upside potential. STMicroelectronics’ consensus target at 37.67 surpasses its current price of 29.33, reflecting stronger analyst optimism.

Don’t Let Luck Decide Your Entry Point
Optimize your entry points with our advanced ProRealTime indicators. You’ll get efficient buy signals with precise price targets for maximum performance. Start outperforming now!
How do institutions grade them?
This section compares the most recent institutional grades for Teradyne, Inc. and STMicroelectronics N.V.:
Teradyne, Inc. Grades
The following table summarizes recent analyst grades for Teradyne, Inc.:
| Grading Company | Action | New Grade | Date |
|---|---|---|---|
| Cantor Fitzgerald | maintain | Overweight | 2026-02-04 |
| Goldman Sachs | maintain | Buy | 2026-02-04 |
| Stifel | maintain | Buy | 2026-02-04 |
| Evercore ISI Group | maintain | Outperform | 2026-02-04 |
| Citigroup | maintain | Buy | 2026-02-04 |
| Evercore ISI Group | maintain | Outperform | 2026-02-03 |
| Cantor Fitzgerald | maintain | Overweight | 2026-02-02 |
| Stifel | maintain | Buy | 2026-01-30 |
| UBS | maintain | Buy | 2026-01-26 |
| B of A Securities | maintain | Buy | 2026-01-22 |
STMicroelectronics N.V. Grades
The following table summarizes recent analyst grades for STMicroelectronics N.V.:
| Grading Company | Action | New Grade | Date |
|---|---|---|---|
| TD Cowen | maintain | Buy | 2025-10-24 |
| Susquehanna | maintain | Positive | 2025-10-22 |
| Susquehanna | maintain | Positive | 2025-07-25 |
| Baird | upgrade | Outperform | 2025-07-22 |
| Susquehanna | maintain | Positive | 2025-07-22 |
| Jefferies | upgrade | Buy | 2025-02-19 |
| Bernstein | downgrade | Market Perform | 2025-02-05 |
| Susquehanna | maintain | Positive | 2025-01-31 |
| Barclays | downgrade | Underweight | 2025-01-22 |
| JP Morgan | downgrade | Neutral | 2024-12-09 |
Which company has the best grades?
Teradyne, Inc. consistently earns Buy and Outperform ratings from top firms, showing strong confidence. STMicroelectronics N.V. exhibits a mixed picture with upgrades and downgrades, reflecting greater analyst uncertainty. Investors may view Teradyne’s steadier grades as a sign of clearer institutional conviction.
Risks specific to each company
The following categories identify critical pressure points and systemic threats facing Teradyne, Inc. and STMicroelectronics N.V. in the 2026 market environment:
1. Market & Competition
Teradyne, Inc.
- Faces intense competition in semiconductor test equipment with high innovation demands.
STMicroelectronics N.V.
- Competes in diverse semiconductor markets, pressured by global chip supply dynamics and price erosion.
2. Capital Structure & Debt
Teradyne, Inc.
- Maintains low debt-to-equity of 0.12, strong interest coverage at 81x, indicating conservative leverage.
STMicroelectronics N.V.
- Also low debt-to-equity at 0.12 with infinite interest coverage, showing solid balance sheet strength.
3. Stock Volatility
Teradyne, Inc.
- Exhibits high beta at 1.82, signaling greater sensitivity to market swings.
STMicroelectronics N.V.
- Lower beta of 1.32, implying more moderate stock price fluctuations.
4. Regulatory & Legal
Teradyne, Inc.
- Subject to US technology export controls and semiconductor industry regulations.
STMicroelectronics N.V.
- Faces European and global regulatory complexities, including export controls and trade compliance.
5. Supply Chain & Operations
Teradyne, Inc.
- Relies on global semiconductor manufacturers; supply chain disruptions could impact production schedules.
STMicroelectronics N.V.
- Operates extensive manufacturing footprint across continents, exposed to supply chain variability and logistics risk.
6. ESG & Climate Transition
Teradyne, Inc.
- Industrial automation focus demands energy-efficient solutions; ESG initiatives critical to client retention.
STMicroelectronics N.V.
- Broad product portfolio requires aggressive climate transition strategies to meet evolving industry standards.
7. Geopolitical Exposure
Teradyne, Inc.
- US-based with global customers; geopolitical tensions risk export restrictions and market access.
STMicroelectronics N.V.
- European headquartered with significant Asia Pacific exposure; vulnerable to regional trade tensions and tariffs.
Which company shows a better risk-adjusted profile?
Teradyne’s most impactful risk is elevated stock volatility and high valuation multiples, which may limit downside protection amid market shifts. STMicroelectronics struggles with weak profitability but benefits from a diversified global footprint and robust Piotroski score. Overall, Teradyne presents a better risk-adjusted profile due to stronger financial metrics and balance sheet stability despite market sensitivity. The recent surge in Teradyne’s beta to 1.82 highlights heightened investor caution about cyclical semiconductor demand risks.
Final Verdict: Which stock to choose?
Teradyne, Inc. (TER) excels as a cash-generating powerhouse with a proven ability to create value above its capital cost. Its superpower lies in operational efficiency and a robust balance sheet. A point of vigilance is its high valuation multiples, which could pressure returns. TER suits investors targeting aggressive growth with a tolerance for premium pricing.
STMicroelectronics N.V. (STM) offers a strategic moat through its diversified semiconductor portfolio and solid liquidity position. Its recurring revenue base and conservative debt profile provide a safer investment profile compared to TER. STM fits portfolios aiming for growth at a reasonable price, emphasizing stability over rapid expansion.
If you prioritize strong value creation and operational efficiency, Teradyne outshines with superior returns on invested capital despite its premium valuation. However, if you seek better stability and a more defensive stance in semiconductor exposure, STMicroelectronics offers a compelling scenario with its solid financial footing and strategic resilience.
Disclaimer: Investment carries a risk of loss of initial capital. The past performance is not a reliable indicator of future results. Be sure to understand risks before making an investment decision.
Go Further
I encourage you to read the complete analyses of Teradyne, Inc. and STMicroelectronics N.V. to enhance your investment decisions: