In the rapidly evolving semiconductor industry, Taiwan Semiconductor Manufacturing Company Limited (TSM) and STMicroelectronics N.V. (STM) stand out as influential players driving innovation and technological advancement. Both companies operate globally, overlapping in key markets such as automotive, industrial, and consumer electronics, yet they adopt distinct strategies in product development and market focus. This article will explore their strengths and challenges to help you decide which stock could be the better addition to your investment portfolio.
Table of contents
Companies Overview
I will begin the comparison between Taiwan Semiconductor Manufacturing Company Limited (TSM) and STMicroelectronics N.V. (STM) by providing an overview of these two companies and their main differences.
Taiwan Semiconductor Manufacturing Company Limited Overview
TSMC is a leading semiconductor manufacturer headquartered in Hsinchu City, Taiwan. Founded in 1987, the company specializes in wafer fabrication processes and produces integrated circuits and other semiconductor devices for global markets. Its products support high-performance computing, smartphones, IoT, automotive, and consumer electronics, positioning TSMC as a critical player in the semiconductor industry with a market cap of approximately 1.7T USD.
STMicroelectronics N.V. Overview
STM is a semiconductor company based in Schiphol, the Netherlands, established in 1987. It designs, develops, and sells semiconductor products across various regions, including Europe, the Americas, and Asia Pacific. STM operates through segments focused on automotive ICs, analog and MEMS products, and microcontrollers, serving automotive, industrial, personal electronics, and communications markets. Its market cap stands near 25B USD, reflecting a diverse product portfolio.
Key similarities and differences
Both TSM and STM operate in the semiconductor industry, producing integrated circuits and serving global markets. However, TSMC primarily focuses on wafer fabrication and foundry services, while STM emphasizes product design and development across automotive, analog, MEMS, and microcontroller segments. TSMC’s operations are more manufacturing-centered, whereas STM combines design, manufacturing, and sales through multiple semiconductor product groups.
Income Statement Comparison
The table below presents a side-by-side comparison of key income statement metrics for Taiwan Semiconductor Manufacturing Company Limited (TSM) and STMicroelectronics N.V. (STM) for the fiscal year 2024.

| Metric | Taiwan Semiconductor Manufacturing Company Limited (TSM) | STMicroelectronics N.V. (STM) |
|---|---|---|
| Market Cap | 1.70T TWD | 24.9B USD |
| Revenue | 2.89T TWD | 13.3B USD |
| EBITDA | 1.98T TWD | 3.72B USD |
| EBIT | 1.32T TWD | 1.96B USD |
| Net Income | 1.16T TWD | 1.56B USD |
| EPS | 223.4 TWD | 1.73 USD |
| Fiscal Year | 2024 | 2024 |
Income Statement Interpretations
Taiwan Semiconductor Manufacturing Company Limited
Taiwan Semiconductor Manufacturing Company Limited (TSM) displayed strong growth from 2020 to 2024, with revenue rising 116.11% and net income increasing 126.8%. Margins remained solid, with a gross margin of 56.12% and a net margin of 40.02% in 2024. The latest year saw a 33.89% revenue increase and a slight net margin growth, indicating sustained profitability and operational efficiency.
STMicroelectronics N.V.
STMicroelectronics N.V. (STM) experienced moderate overall revenue growth of 29.85% and net income growth of 40.78% from 2020 to 2024. However, 2024 showed a decline in revenue by 23.24% and net income by 62.78%, impacting margins which remain lower than TSM’s, with a gross margin of 39.34% and net margin of 11.73%. This recent drop signals challenges in maintaining growth momentum.
Which one has the stronger fundamentals?
TSM exhibits stronger fundamentals, with higher and more stable margins, robust revenue and net income growth over the period, and positive one-year growth trends. STM, while showing growth over the longer term, suffered significant declines in 2024, negatively affecting margins and earnings. TSM’s consistent profitability and margin expansion reflect more favorable income statement performance.
Financial Ratios Comparison
The table below presents key financial ratios for Taiwan Semiconductor Manufacturing Company Limited (TSM) and STMicroelectronics N.V. (STM) based on their most recent fiscal year data from 2024.
| Ratios | Taiwan Semiconductor Manufacturing Company Limited (TSM) | STMicroelectronics N.V. (STM) |
|---|---|---|
| ROE | 27.3% | 8.9% |
| ROIC | 20.0% | 6.3% |
| P/E | 29.0 | 14.4 |
| P/B | 7.9 | 1.3 |
| Current Ratio | 2.36 | 3.11 |
| Quick Ratio | 2.14 | 2.37 |
| D/E (Debt to Equity) | 0.25 | 0.18 |
| Debt-to-Assets | 15.6% | 12.8% |
| Interest Coverage | 126 | 19.7 |
| Asset Turnover | 0.43 | 0.54 |
| Fixed Asset Turnover | 0.88 | 1.22 |
| Payout ratio | 31.3% | 18.5% |
| Dividend yield | 1.08% | 1.28% |
Interpretation of the Ratios
Taiwan Semiconductor Manufacturing Company Limited
Taiwan Semiconductor Manufacturing Company Limited shows strong profitability with favorable net margin (40.02%) and return on equity (27.29%). Its liquidity and solvency ratios are robust, including a current ratio of 2.36 and low debt-to-assets at 15.65%. However, valuation multiples like P/E (29.04) and P/B (7.92) appear high, which could signal overvaluation. The company pays a dividend, yielding 1.08% with a stable payout supported by free cash flow, posing moderate risk from valuation pressure.
STMicroelectronics N.V.
STMicroelectronics displays mixed ratio results. It has a favorable net margin (11.73%) and valuation multiples, including a low P/E (14.43) and P/B (1.29), suggesting reasonable market pricing. Liquidity is somewhat inconsistent, with a high current ratio (3.11) considered unfavorable due to potential inefficiency, while quick ratio remains favorable. ROE is relatively weak at 8.92%. The company pays a dividend with a 1.28% yield but shows negative free cash flow, indicating possible reinvestment or operational challenges.
Which one has the best ratios?
Overall, Taiwan Semiconductor Manufacturing Company Limited exhibits more favorable financial ratios with stronger profitability, efficient capital structure, and solid liquidity, despite higher valuation multiples. STMicroelectronics offers more moderate valuations but weaker returns and some liquidity concerns. The global ratio assessments favor Taiwan Semiconductor, though both companies maintain neutral dividend yields and face distinct operational trade-offs.
Strategic Positioning
This section compares the strategic positioning of Taiwan Semiconductor Manufacturing Company Limited (TSM) and STMicroelectronics N.V. (STM), focusing on market position, key segments, and exposure to technological disruption:
Taiwan Semiconductor Manufacturing Company Limited (TSM)
- Leading global semiconductor foundry with significant scale and competitive pressure from other wafer fabricators.
- Dominantly focused on wafer fabrication serving high-performance computing, smartphones, automotive, and IoT sectors.
- Exposure to advanced semiconductor manufacturing technologies with ongoing investments in new fabrication processes.
STMicroelectronics N.V. (STM)
- Mid-sized semiconductor company facing competitive pressure in analog, MEMS, and automotive IC markets.
- Diversified across automotive, analog, MEMS, sensors, microcontrollers, and digital ICs segments.
- Exposure to analog and MEMS innovation, including wireless charging and GaN power transistor integration.
Taiwan Semiconductor Manufacturing Company Limited vs STMicroelectronics N.V. Positioning
TSM’s strategy centers on a concentrated wafer fabrication business with global scale advantages, while STM pursues a diversified product portfolio across multiple semiconductor segments. TSM benefits from scale in advanced process technology; STM’s diversification exposes it to varied end markets but with smaller scale.
Which has the best competitive advantage?
Based on MOAT evaluation, TSM shows a slightly favorable moat by creating value despite declining profitability, while STM’s very unfavorable moat indicates value destruction and declining returns, suggesting TSM holds a stronger competitive advantage.
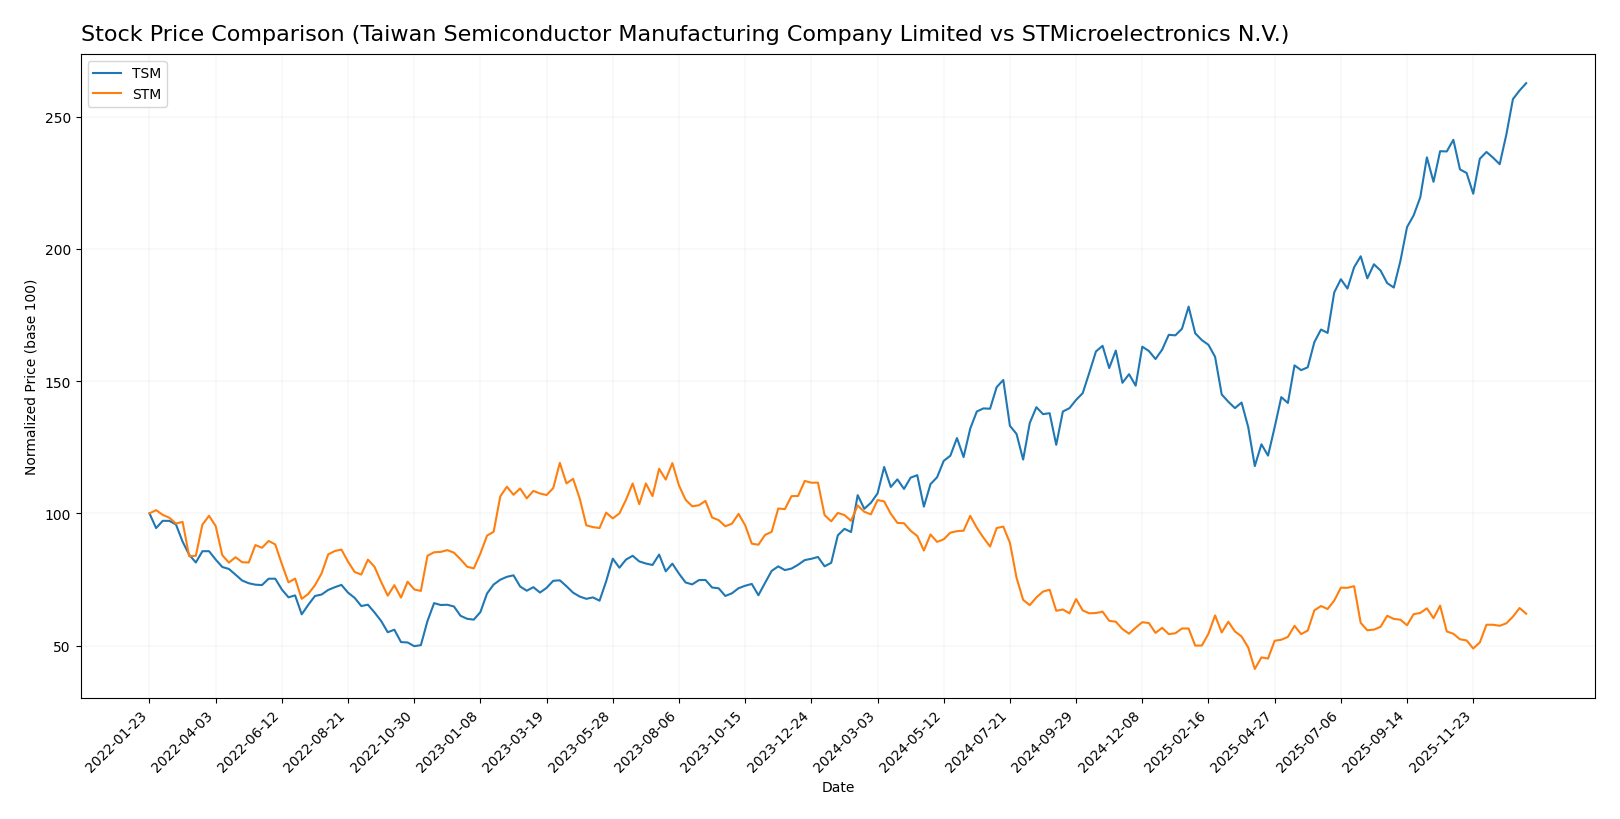
Stock Comparison
The stock price movements over the past year reveal a strong bullish acceleration for Taiwan Semiconductor Manufacturing Company Limited (TSM), contrasted by a sustained bearish acceleration for STMicroelectronics N.V. (STM), with recent periods showing modest recovery trends.
Trend Analysis
Taiwan Semiconductor Manufacturing Company Limited (TSM) experienced a 152.54% price increase over the past year, indicating a bullish trend with accelerating momentum and significant volatility. The stock ranged between 127.7 and 327.11 during this period.
STMicroelectronics N.V. (STM) showed a 37.7% price decline over the past year, reflecting a bearish trend with acceleration despite lower volatility. The stock’s price fluctuated between 18.49 and 47.17.
Comparing both, TSM delivered the highest market performance with a strong bullish trend, while STM experienced a notable bearish trend, despite both showing positive recent trend slopes.
Target Prices
The current analyst consensus indicates promising upside potential for both Taiwan Semiconductor Manufacturing Company Limited and STMicroelectronics N.V.
| Company | Target High | Target Low | Consensus |
|---|---|---|---|
| Taiwan Semiconductor Manufacturing Company Limited | 400 | 330 | 361.25 |
| STMicroelectronics N.V. | 45 | 26.5 | 34.88 |
Analysts expect Taiwan Semiconductor’s price to rise significantly from its current 327.11 USD, while STMicroelectronics shows moderate upside from 27.88 USD, reflecting generally positive market outlooks.
Analyst Opinions Comparison
This section compares analysts’ ratings and financial scores for Taiwan Semiconductor Manufacturing Company Limited (TSM) and STMicroelectronics N.V. (STM):
Rating Comparison
TSM Rating
- Rating: A- indicating a very favorable overall evaluation.
- Discounted Cash Flow Score: 5, reflecting a very favorable valuation outlook.
- ROE Score: 5, indicating very efficient profit generation from equity.
- ROA Score: 5, demonstrating very effective asset utilization.
- Debt To Equity Score: 3, assessed as moderate financial risk.
- Overall Score: 4, categorized as favorable financial standing.
STM Rating
- Rating: B with a very favorable overall status.
- Discounted Cash Flow Score: 3, showing a moderate valuation assessment.
- ROE Score: 2, suggesting moderate efficiency in generating equity returns.
- ROA Score: 3, indicating moderate asset utilization.
- Debt To Equity Score: 3, also reflecting moderate financial risk.
- Overall Score: 3, seen as moderate financial standing.
Which one is the best rated?
Based strictly on the provided data, TSM holds a higher rating (A-) and superior scores in discounted cash flow, ROE, ROA, and overall financial standing compared to STM’s B rating and moderate scores. TSM is thus better rated overall.
Scores Comparison
Here is a comparison of the Altman Z-Score and Piotroski Score for both companies:
TSM Scores
- Altman Z-Score: 2.94, in the grey zone indicating moderate bankruptcy risk.
- Piotroski Score: 8, very strong financial health signal.
STM Scores
- Altman Z-Score: 4.06, in the safe zone indicating low bankruptcy risk.
- Piotroski Score: 7, strong financial health signal.
Which company has the best scores?
STM has a higher Altman Z-Score in the safe zone, suggesting lower bankruptcy risk than TSM’s grey zone score. TSM, however, has a slightly better Piotroski Score indicating a marginally stronger financial health.
Grades Comparison
Here is the grades comparison for Taiwan Semiconductor Manufacturing Company Limited and STMicroelectronics N.V.:
Taiwan Semiconductor Manufacturing Company Limited Grades
This table shows recent grades assigned by established grading companies:
| Grading Company | Action | New Grade | Date |
|---|---|---|---|
| Bernstein | Maintain | Outperform | 2025-12-08 |
| Needham | Maintain | Buy | 2025-10-27 |
| Barclays | Maintain | Overweight | 2025-10-17 |
| Needham | Maintain | Buy | 2025-10-16 |
| Susquehanna | Maintain | Positive | 2025-10-10 |
| Barclays | Maintain | Overweight | 2025-10-09 |
| Barclays | Maintain | Overweight | 2025-09-16 |
| Needham | Maintain | Buy | 2025-07-17 |
| Susquehanna | Maintain | Positive | 2025-07-14 |
| Needham | Maintain | Buy | 2025-07-01 |
Grades for Taiwan Semiconductor Manufacturing Company Limited consistently indicate strong buy-side recommendations, with no downgrades and multiple reaffirmations of “Buy,” “Outperform,” and “Overweight” ratings.
STMicroelectronics N.V. Grades
This table shows recent grades assigned by established grading companies:
| Grading Company | Action | New Grade | Date |
|---|---|---|---|
| TD Cowen | Maintain | Buy | 2025-10-24 |
| Susquehanna | Maintain | Positive | 2025-10-22 |
| Susquehanna | Maintain | Positive | 2025-07-25 |
| Susquehanna | Maintain | Positive | 2025-07-22 |
| Baird | Upgrade | Outperform | 2025-07-22 |
| Jefferies | Upgrade | Buy | 2025-02-19 |
| Bernstein | Downgrade | Market Perform | 2025-02-05 |
| Susquehanna | Maintain | Positive | 2025-01-31 |
| Barclays | Downgrade | Underweight | 2025-01-22 |
| JP Morgan | Downgrade | Neutral | 2024-12-09 |
Grades for STMicroelectronics N.V. show a mixed pattern, including upgrades to “Outperform” and “Buy,” but also downgrades to “Market Perform,” “Underweight,” and “Neutral,” reflecting more varied analyst sentiment.
Which company has the best grades?
Taiwan Semiconductor Manufacturing Company Limited has received stronger and more consistent buy-side grades compared to STMicroelectronics N.V., which shows a mixed rating history. This consistency may suggest greater analyst confidence in Taiwan Semiconductor’s outlook, potentially influencing investor perceptions of stability and growth prospects.
Strengths and Weaknesses
The table below summarizes the key strengths and weaknesses of Taiwan Semiconductor Manufacturing Company Limited (TSM) and STMicroelectronics N.V. (STM) based on their latest financial and operational data.
| Criterion | Taiwan Semiconductor Manufacturing Company Limited (TSM) | STMicroelectronics N.V. (STM) |
|---|---|---|
| Diversification | Primarily focused on wafer manufacturing with limited product diversification; “Other Products” revenue at 380B TWD in 2024 | More diversified product portfolio including products and services totaling around 13.4B USD in 2024 |
| Profitability | High net margin (40.02%) and ROIC (20.0%), but declining ROIC trend; favorable overall financial ratios | Moderate net margin (11.73%), neutral ROIC (6.34%) with declining trend; mixed financial ratios with some unfavorable ones |
| Innovation | Strong R&D focus as industry leader in advanced semiconductor manufacturing | Broad innovation across analog, MEMS, automotive, and microcontrollers, but less dominant market position |
| Global presence | Market leader with significant global footprint in semiconductor foundry | Global operations but smaller scale and less dominant compared to TSM |
| Market Share | Leading foundry with dominant wafer market share | Smaller market share in semiconductor segment, competing in niche areas |
Key takeaways: TSM exhibits strong profitability and market leadership but faces a declining ROIC trend, signaling caution. STM offers greater product diversification with moderate profitability but struggles with declining returns and some financial weaknesses. Investors should balance TSM’s scale and profitability against STM’s diversification and growth potential while monitoring ROIC trends closely.
Risk Analysis
Below is a comparative table summarizing key risks for Taiwan Semiconductor Manufacturing Company Limited (TSM) and STMicroelectronics N.V. (STM) as of 2026:
| Metric | Taiwan Semiconductor Manufacturing Company Limited (TSM) | STMicroelectronics N.V. (STM) |
|---|---|---|
| Market Risk | Elevated due to high beta (1.274) and semiconductor cyclical exposure | Elevated beta (1.292) and diversified product segments mitigate somewhat |
| Debt level | Low debt-to-equity (0.25), strong interest coverage (126x) | Low debt-to-equity (0.18), solid interest coverage (23x) |
| Regulatory Risk | Moderate, geopolitical tensions around Taiwan could affect operations | Moderate, exposure to EU regulations and trade policies |
| Operational Risk | High complexity in advanced chip manufacturing, supply chain reliance | Moderate, diversified product lines reduce operational concentration risk |
| Environmental Risk | Increasing pressure on energy use and emissions in fabrication plants | Moderate, with focus on sustainable products and manufacturing |
| Geopolitical Risk | High, due to Taiwan-China-US tensions impacting supply chain stability | Moderate, based in the Netherlands but global market exposure |
The most significant risks lie in geopolitical tensions affecting TSM, with Taiwan’s strategic position creating supply chain uncertainty. STM benefits from geographic diversification but faces regulatory and operational risks. Both companies maintain low debt, providing financial resilience amid market volatility.
Which Stock to Choose?
Taiwan Semiconductor Manufacturing Company Limited (TSM) shows strong income growth with a 33.89% revenue increase in 2024 and favorable profitability ratios, including a 40.02% net margin and 27.29% ROE. Its debt levels are low, supported by a favorable debt-to-equity ratio of 0.25, and it holds a very favorable A- rating.
STMicroelectronics N.V. (STM) experienced a 23.24% decline in revenue in 2024, though it maintains a favorable net margin of 11.73%. Financial ratios are mixed, with a moderately favorable overall rating of B and a net debt-to-EBITDA ratio of 0.24, indicating manageable leverage but weaker profitability compared to TSM.
Considering the ratings and financial evaluations, TSM’s strong income growth and favorable ratios might appeal to growth-oriented investors, while STM’s moderate rating and stable leverage could be more suitable for those with a cautious approach seeking value opportunities despite recent revenue declines.
Disclaimer: Investment carries a risk of loss of initial capital. The past performance is not a reliable indicator of future results. Be sure to understand risks before making an investment decision.
Go Further
I encourage you to read the complete analyses of Taiwan Semiconductor Manufacturing Company Limited and STMicroelectronics N.V. to enhance your investment decisions: