Home > Comparison > Technology > STM vs SWKS
The strategic rivalry between STMicroelectronics N.V. and Skyworks Solutions, Inc. shapes the semiconductor sector’s evolution. STM operates as a diversified industrial powerhouse, spanning automotive chips, sensors, and microcontrollers. In contrast, SWKS focuses on high-margin, proprietary analog and mixed-signal solutions for wireless and IoT markets. This analysis pits STM’s broad industrial base against SWKS’s specialized innovation to identify which offers superior risk-adjusted returns for a balanced portfolio.
Table of contents
Companies Overview
STMicroelectronics and Skyworks Solutions dominate key niches within the global semiconductor industry.
STMicroelectronics N.V.: Diverse Semiconductor Innovator
STMicroelectronics leads as a broad-based semiconductor provider with a product suite spanning automotive ICs, analog, MEMS, sensors, and microcontrollers. Its revenue primarily flows from diversified industrial and automotive markets. In 2026, the company sharpened focus on integrating silicon and GaN power transistors, enhancing energy-efficient solutions across segments.
Skyworks Solutions, Inc.: Wireless Connectivity Specialist
Skyworks Solutions excels as a specialist in proprietary semiconductor products, including RF front-end modules and amplifiers. Its revenue engine leverages intellectual property in wireless analog system-on-chip tech, serving smartphones, automotive, and broadband markets. The strategic emphasis in 2026 remained on expanding portfolio innovation within cellular infrastructure and connected devices.
Strategic Collision: Similarities & Divergences
STMicroelectronics pursues a diversified product strategy, contrasting with Skyworks’ focused wireless ecosystem approach. Both aggressively compete in automotive and industrial segments, particularly for RF and power management solutions. Their market battle centers on balancing breadth versus specialization. This divergence defines distinct investment profiles: STMicroelectronics offers broad exposure, while Skyworks delivers targeted innovation in wireless semiconductors.
Income Statement Comparison
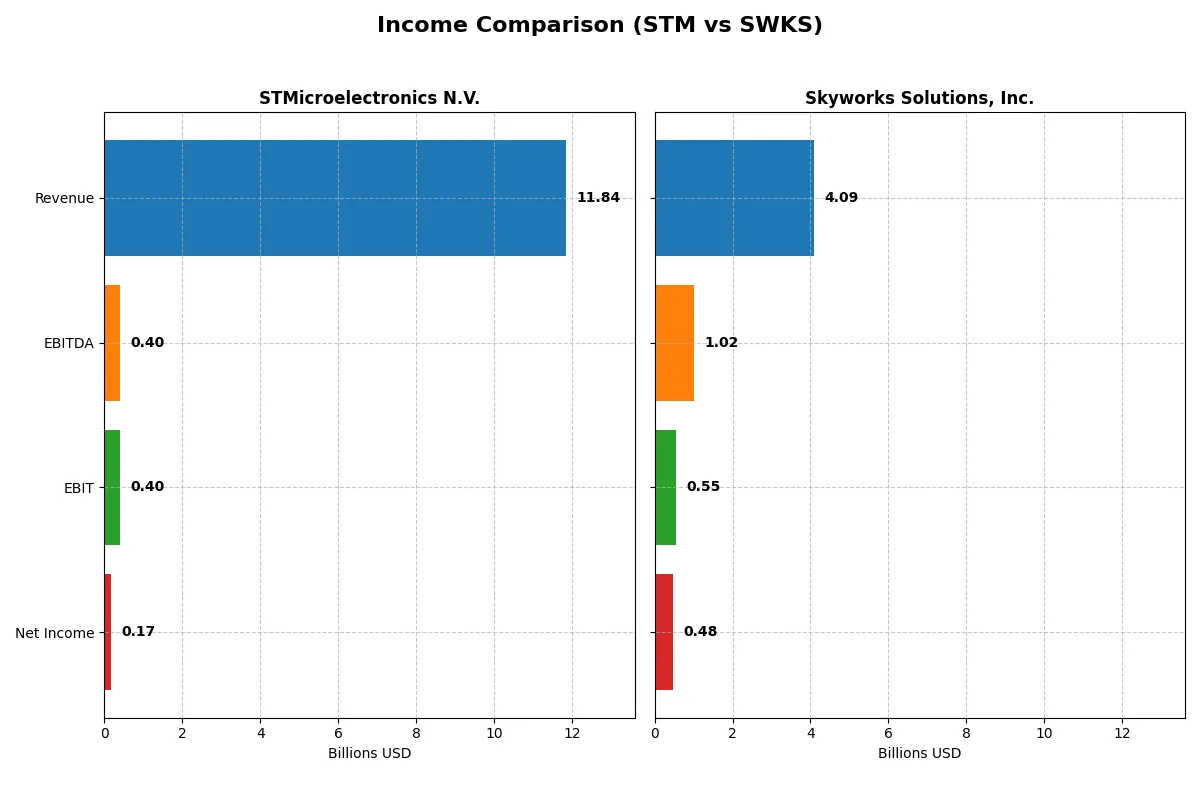
This data dissects the core profitability and scalability of both corporate engines to reveal who dominates the bottom line:
| Metric | STMicroelectronics N.V. (STM) | Skyworks Solutions, Inc. (SWKS) |
|---|---|---|
| Revenue | 11.8B | 4.1B |
| Cost of Revenue | 7.8B | 2.4B |
| Operating Expenses | 3.7B | 1.2B |
| Gross Profit | 4.0B | 1.7B |
| EBITDA | 401M | 1.0B |
| EBIT | 401M | 554M |
| Interest Expense | 0 | 27M |
| Net Income | 167M | 477M |
| EPS | 0.19 | 3.09 |
| Fiscal Year | 2025 | 2025 |
Income Statement Analysis: The Bottom-Line Duel
This income statement comparison reveals which company operates with superior efficiency and financial discipline in a challenging market environment.
STMicroelectronics N.V. Analysis
STM’s revenue declined from 17.3B in 2023 to 11.8B in 2025, reflecting shrinking top-line momentum. Gross margin softened to 33.9%, while net margin contracted sharply to 1.4%. The company’s EBIT margin fell to a neutral 3.4% in 2025, signaling deteriorating operational efficiency and heavy pressure on profitability.
Skyworks Solutions, Inc. Analysis
SWKS recorded a revenue drop to 4.1B in 2025 from 5.5B in 2022, marking a steady but milder decline. Its gross margin remains robust at 41.2%, and net margin held strong at 11.7%. EBIT margin at 13.6% underscores better cost control and stronger profit retention despite a modest revenue contraction.
Margin Strength vs. Top-Line Erosion
STM’s steep declines in revenue and net income contrast with SWKS’s more resilient margins amid slower sales deterioration. Skyworks clearly manages costs better, delivering nearly triple the EBIT margin of STMicroelectronics in 2025. For investors, SWKS’s profile offers greater profitability stability, while STM’s rapid margin compression suggests caution over operational challenges.
Financial Ratios Comparison
These vital ratios act as a diagnostic tool to expose underlying fiscal health, valuation premiums, and capital efficiency for the two semiconductor companies:
| Ratios | STMicroelectronics N.V. (STM) | Skyworks Solutions, Inc. (SWKS) |
|---|---|---|
| ROE | 0.0093 | 0.0829 |
| ROIC | 0.0067 | 0.0635 |
| P/E | 0 | 24.95 |
| P/B | 0 | 2.07 |
| Current Ratio | 3.36 | 2.33 |
| Quick Ratio | 2.43 | 1.76 |
| D/E (Debt to Equity) | 0.12 | 0.21 |
| Debt-to-Assets | 0.086 | 0.152 |
| Interest Coverage | 0 | 18.45 |
| Asset Turnover | 0.48 | 0.52 |
| Fixed Asset Turnover | 1.07 | 2.95 |
| Payout ratio | 0 | 0.91 |
| Dividend yield | 0 | 3.63% |
| Fiscal Year | 2025 | 2025 |
Efficiency & Valuation Duel: The Vital Signs
Ratios act as a company’s DNA, revealing hidden risks and operational excellence through profitability, valuation, and liquidity insights.
STMicroelectronics N.V.
STMicroelectronics displays weak profitability with a low ROE of 0.93% and a net margin of 1.41%, signaling operational challenges. Its valuation metrics, including P/E and P/B, appear favorable but reflect uncertainty. The absence of dividends points to a reinvestment focus, likely on R&D, supporting future growth despite current efficiency concerns.
Skyworks Solutions, Inc.
Skyworks Solutions registers a stronger net margin of 11.67%, though its ROE at 8.29% remains moderate. The stock trades at a neutral P/E of 24.95 and P/B of 2.07, indicating fair valuation. Skyworks rewards shareholders with a 3.63% dividend yield, balancing income return with solid operating efficiency and liquidity positions.
Operational Efficiency vs. Shareholder Yield Balance
Skyworks offers a better balance of profitability and shareholder returns with favorable margins and dividend yield. STMicroelectronics struggles with profitability despite attractive valuations and reinvestment emphasis. Investors seeking income and operational stability may prefer Skyworks, while those focused on growth through reinvestment might consider STMicroelectronics’ profile.
Which one offers the Superior Shareholder Reward?
I observe that STMicroelectronics (STM) pays a modest dividend yield near 1.28% with a low payout ratio around 18%, but its free cash flow per share turned negative in 2025, signaling payout pressure. STM’s buyback activity appears limited or unreported, reducing total shareholder return. Skyworks Solutions (SWKS), by contrast, delivers a robust 3.63% dividend yield with a high 90% payout ratio, backed by strong free cash flow of 7.16B and consistent buybacks fueling shareholder value. Although SWKS carries more debt, its capital allocation heavily favors distributions, reflecting confidence in sustainable returns. I judge Skyworks offers the superior total return profile in 2026, balancing yield and buybacks more effectively for long-term investors.
Comparative Score Analysis: The Strategic Profile
The radar chart reveals the fundamental DNA and trade-offs of STMicroelectronics N.V. and Skyworks Solutions, Inc., highlighting their financial strengths and vulnerabilities:
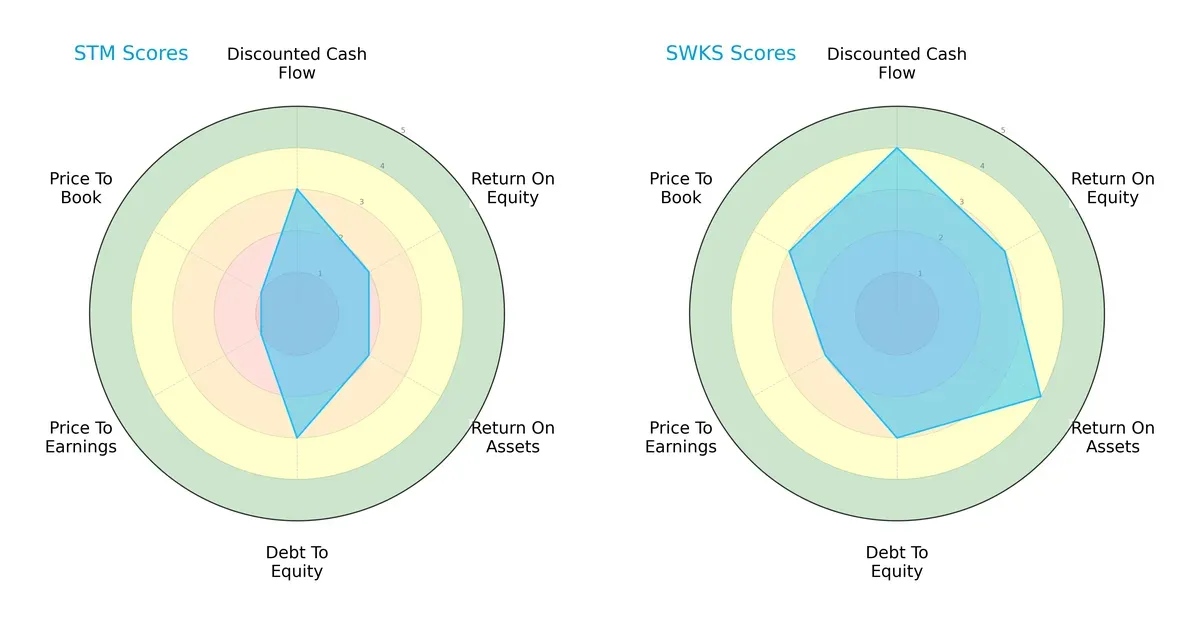
Skyworks demonstrates a more balanced and favorable profile, excelling in discounted cash flow (4 vs. 3), return on equity (3 vs. 2), and return on assets (4 vs. 2). Both companies share moderate debt-to-equity scores (3), but STMicroelectronics suffers from very unfavorable valuation metrics (PE and PB scores at 1), indicating potential overvaluation or market skepticism. Skyworks relies on consistent operational efficiency and valuation discipline, while STMicroelectronics leans more on moderate financial leverage with weaker market sentiment.
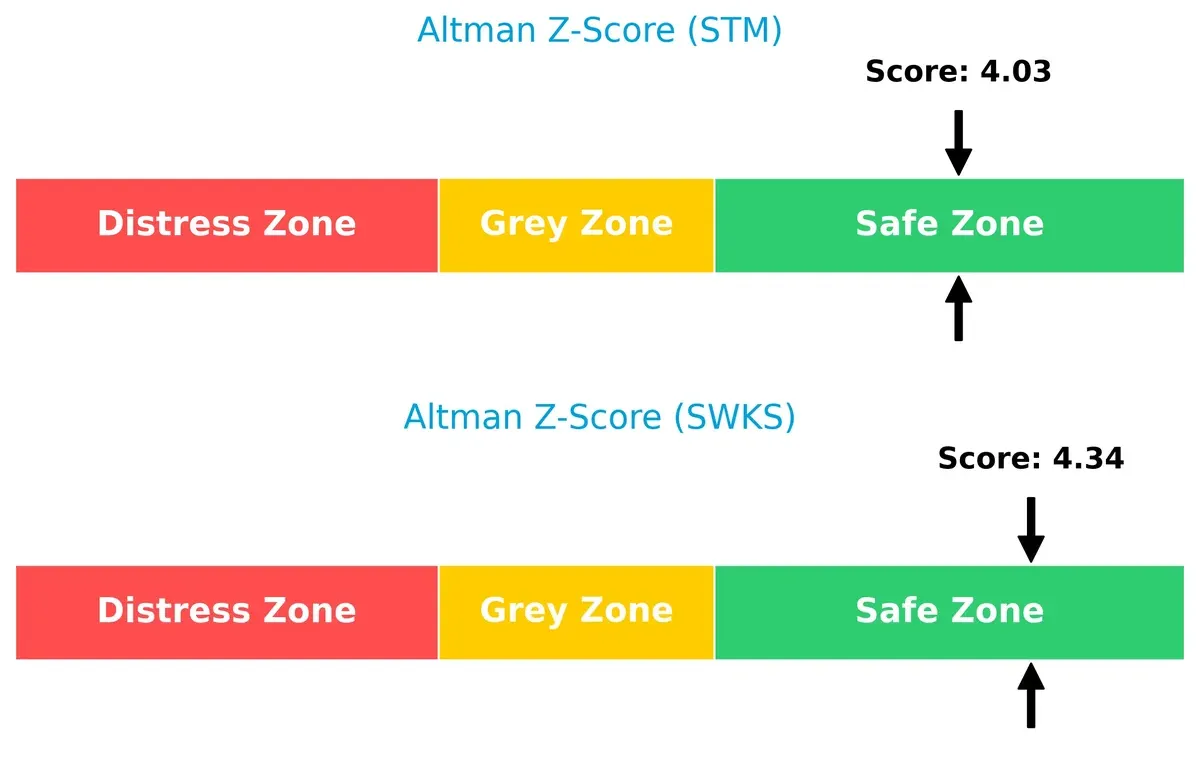
Bankruptcy Risk: Solvency Showdown
The Altman Z-Score gap shows both firms reside comfortably in the safe zone, with Skyworks slightly ahead at 4.34 versus STMicroelectronics’ 4.03, signaling strong long-term solvency and resilience in this economic cycle:
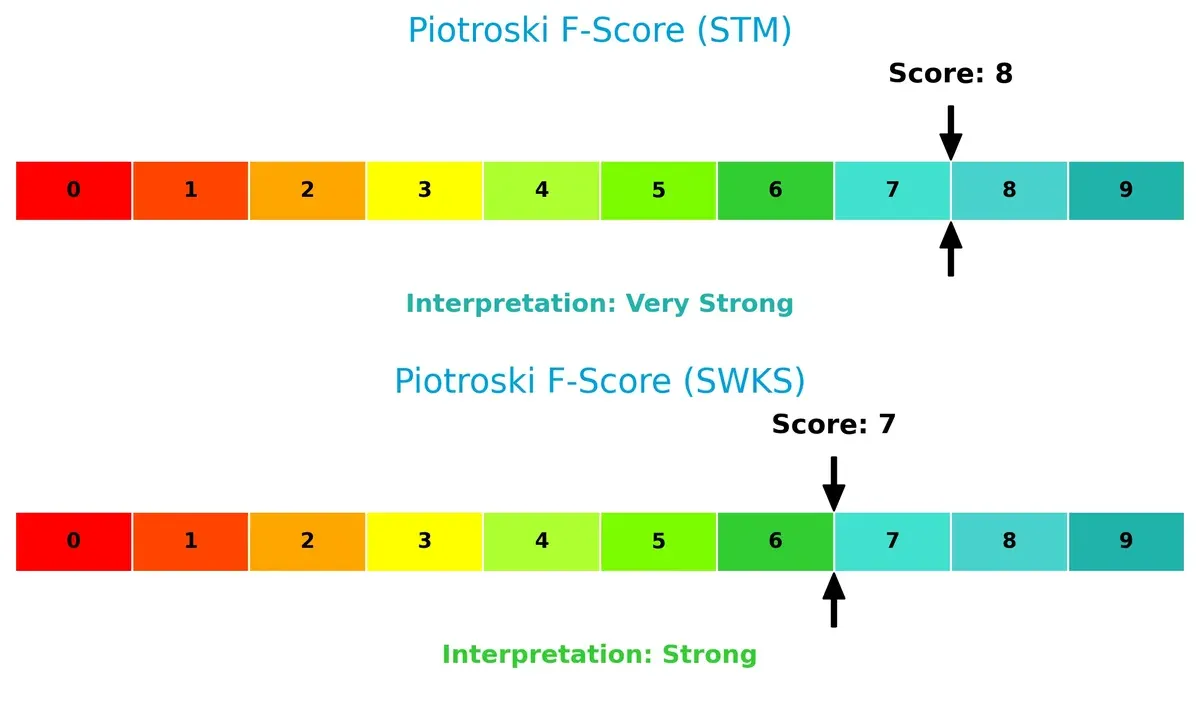
Financial Health: Quality of Operations
STMicroelectronics scores an impressive 8 on the Piotroski F-Score, indicating very strong financial health. Skyworks follows closely with a 7, denoting strong fundamentals but with slightly more room for improvement. Neither shows red flags, but STMicroelectronics’ internal metrics suggest peak operational quality:
How are the two companies positioned?
This section dissects STM and SWKS’s operational DNA by comparing their revenue distribution and internal strengths and weaknesses. The goal is to confront their economic moats to reveal which model offers the most resilient and sustainable competitive advantage today.
Revenue Segmentation: The Strategic Mix
The following visual comparison dissects how STMicroelectronics N.V. and Skyworks Solutions, Inc. diversify their income streams and where their primary sector bets lie:
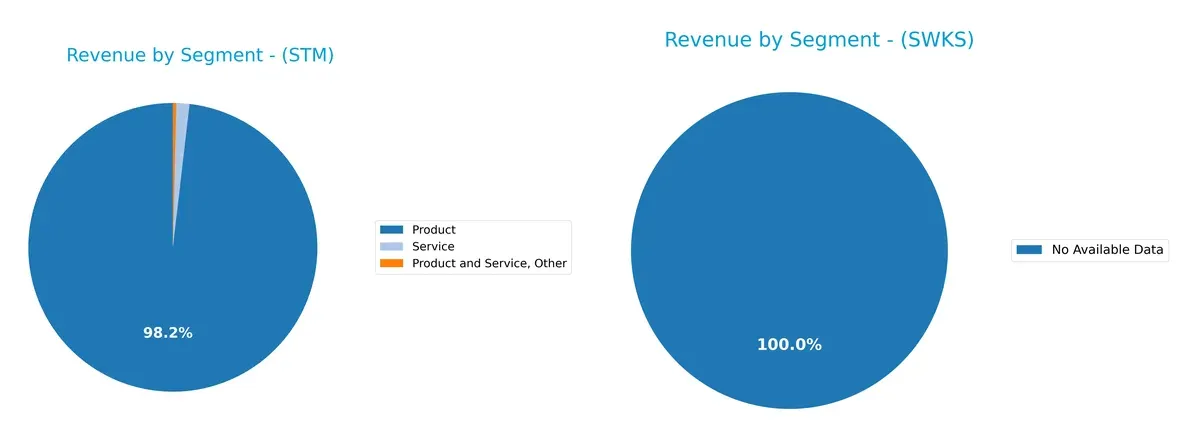
STMicroelectronics N.V. anchors revenue in its Product segment with $13.2B in 2024, dwarfing its smaller Service and Other streams. Skyworks Solutions lacks available segmentation data, preventing comparison. STM’s heavy product reliance signals a strong infrastructure foothold but exposes it to concentration risk. Diversification appears limited, focusing on core semiconductor products rather than spreading risk across varied business units. This strategy demands close monitoring amid sector volatility.
Strengths and Weaknesses Comparison
This table compares the strengths and weaknesses of STMicroelectronics N.V. (STM) and Skyworks Solutions, Inc. (SWKS):
STM Strengths
- Strong global presence including Singapore, Switzerland, and the US
- Favorable debt-to-equity at 0.12 and low debt-to-assets at 8.6%
- High quick ratio at 2.43 indicates good short-term liquidity
SWKS Strengths
- High net margin of 11.67% shows strong profitability
- Favorable interest coverage at 20.44 supports financial stability
- Global sales heavily concentrated in the US, showing market dominance there
STM Weaknesses
- Low profitability with net margin at 1.41% and ROE at 0.93%
- Unfavorable asset turnover at 0.48 limits efficiency
- Zero dividend yield may deter income-focused investors
SWKS Weaknesses
- ROE at 8.29% is unfavorable compared to net margin
- PE and PB ratios neutral, suggesting moderate valuation
- Geographic diversification less balanced, with heavy US reliance
STM’s strengths lie in its diversified global footprint and strong balance sheet metrics, but it struggles with profitability and asset efficiency. SWKS excels in profitability and financial stability but shows geographic concentration and mixed returns on equity, which could impact strategic flexibility.
The Moat Duel: Analyzing Competitive Defensibility
Only a structural moat can shield long-term profits from relentless competitive erosion. Let’s dissect two semiconductor firms’ moats in 2026:
STMicroelectronics N.V. (STM): Diverse Product Breadth as Moat
STM’s competitive edge stems from its broad product portfolio spanning automotive ICs to MEMS sensors. This diversification stabilizes margins but recent ROIC trends show steep decline and value destruction. Future success hinges on innovation in automotive and IoT segments to deepen its moat.
Skyworks Solutions, Inc. (SWKS): Proprietary IP and Market Focus
SWKS leans on proprietary semiconductor IP and strong US market presence, driving superior gross and net margins versus STM. However, its ROIC also declines, signaling shrinking economic profits. Growth may come from expanding 5G and connected device applications, though competition intensifies.
Moat Strength: Diversification vs. IP Specialization
Both firms destroy value with deteriorating ROICs, but SWKS maintains higher margin profiles and tighter market focus. STM’s broader diversification offers resilience but faltering profitability. Between them, SWKS possesses a slightly deeper moat and better defends its core markets amid sector challenges.
Which stock offers better returns?
Both stocks experienced significant price fluctuations over the past year, with STMicroelectronics showing recent strength while Skyworks Solutions continued a prolonged decline.
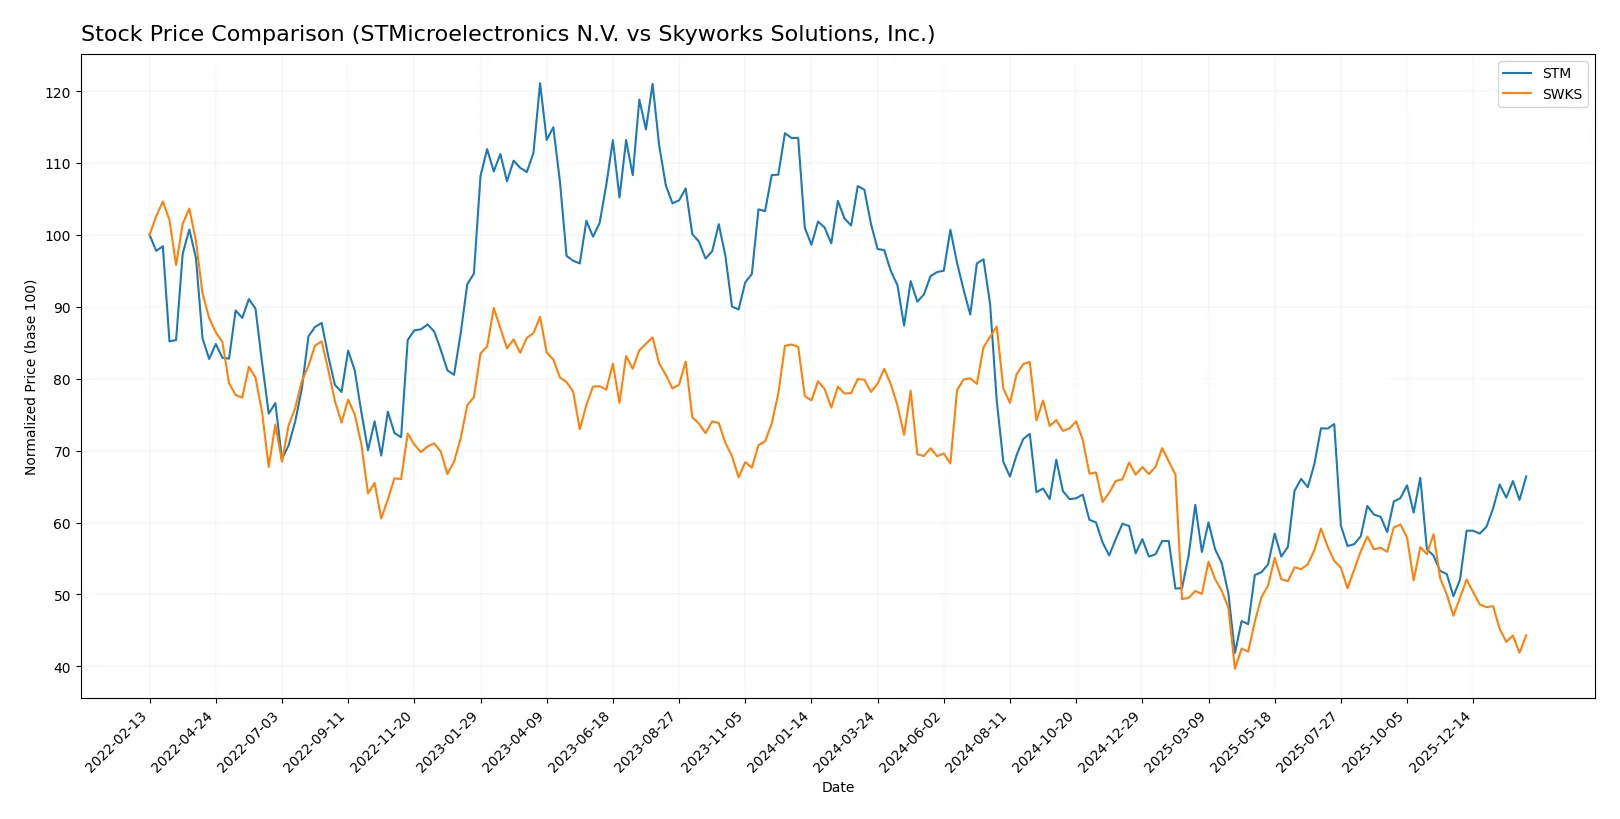
Trend Comparison
STMicroelectronics N.V. shows a bearish trend over the past 12 months with a -34.6% price change, accelerating downward. Recently, it reversed with a 33.5% gain from November 2025 to February 2026.
Skyworks Solutions, Inc. has a bearish trend declining -43.3% over the last year, but its downward trend decelerates. Recent months show a continued -5.8% drop, indicating renewed weakness.
STMicroelectronics outperformed Skyworks over the past year, showing a strong recent rebound versus Skyworks’ persistent decline and greater volatility.
Target Prices
Analysts show a broad range of optimistic targets for these semiconductor leaders.
| Company | Target Low | Target High | Consensus |
|---|---|---|---|
| STMicroelectronics N.V. | 28 | 45 | 37.67 |
| Skyworks Solutions, Inc. | 58 | 140 | 77.36 |
STMicroelectronics trades well below its consensus target of 37.67, signaling potential upside from the current 29.33 price. Skyworks’ consensus target of 77.36 implies substantial appreciation from its 59 market price, reflecting strong analyst confidence.

Don’t Let Luck Decide Your Entry Point
Optimize your entry points with our advanced ProRealTime indicators. You’ll get efficient buy signals with precise price targets for maximum performance. Start outperforming now!
How do institutions grade them?
STMicroelectronics N.V. Grades
The following table summarizes recent grades assigned to STMicroelectronics by major grading firms.
| Grading Company | Action | New Grade | Date |
|---|---|---|---|
| TD Cowen | Maintain | Buy | 2025-10-24 |
| Susquehanna | Maintain | Positive | 2025-10-22 |
| Susquehanna | Maintain | Positive | 2025-07-25 |
| Baird | Upgrade | Outperform | 2025-07-22 |
| Susquehanna | Maintain | Positive | 2025-07-22 |
| Jefferies | Upgrade | Buy | 2025-02-19 |
| Bernstein | Downgrade | Market Perform | 2025-02-05 |
| Susquehanna | Maintain | Positive | 2025-01-31 |
| Barclays | Downgrade | Underweight | 2025-01-22 |
| JP Morgan | Downgrade | Neutral | 2024-12-09 |
Skyworks Solutions, Inc. Grades
Below is the recent grading history for Skyworks Solutions from recognized financial institutions.
| Grading Company | Action | New Grade | Date |
|---|---|---|---|
| Citigroup | Maintain | Neutral | 2026-02-04 |
| Stifel | Maintain | Hold | 2026-02-04 |
| Benchmark | Maintain | Hold | 2026-02-04 |
| Keybanc | Maintain | Overweight | 2026-02-04 |
| JP Morgan | Maintain | Neutral | 2026-02-04 |
| Morgan Stanley | Maintain | Equal Weight | 2026-02-02 |
| B. Riley Securities | Maintain | Neutral | 2026-01-26 |
| Mizuho | Maintain | Neutral | 2026-01-26 |
| Susquehanna | Maintain | Neutral | 2026-01-22 |
| UBS | Maintain | Neutral | 2026-01-20 |
Which company has the best grades?
STMicroelectronics has received several upgrades and mostly positive or buy ratings, with some downgrades. Skyworks Solutions consistently holds neutral to overweight ratings without upgrades. Investors might view STMicroelectronics as more favorably rated, suggesting a stronger bullish sentiment from analysts.
Risks specific to each company
In the challenging 2026 market environment, the following categories identify critical pressure points and systemic threats facing STMicroelectronics N.V. and Skyworks Solutions, Inc.:
1. Market & Competition
STMicroelectronics N.V. (STM)
- Faces intense competition in automotive and industrial segments; lower profitability pressures market positioning.
Skyworks Solutions, Inc. (SWKS)
- Strong market position in wireless and analog semiconductors; higher net margins support competitive resilience.
2. Capital Structure & Debt
STMicroelectronics N.V. (STM)
- Maintains low debt-to-equity ratio (0.12), signaling conservative leverage and stable balance sheet.
Skyworks Solutions, Inc. (SWKS)
- Uses slightly higher leverage (0.21 debt-to-equity) but sustains robust interest coverage (20.44x), indicating manageable debt risk.
3. Stock Volatility
STMicroelectronics N.V. (STM)
- Beta of 1.32 suggests above-market volatility, consistent with semiconductor cyclicality.
Skyworks Solutions, Inc. (SWKS)
- Beta of 1.32 similarly indicates sensitivity to market swings, common in technology sector stocks.
4. Regulatory & Legal
STMicroelectronics N.V. (STM)
- European base exposes STM to complex EU regulatory frameworks and trade policies.
Skyworks Solutions, Inc. (SWKS)
- US headquarters subjects SWKS to evolving US-China trade tensions and export controls impacting supply chains.
5. Supply Chain & Operations
STMicroelectronics N.V. (STM)
- Global footprint includes exposure to semiconductor raw material scarcity and geopolitical risks in Asia-Pacific.
Skyworks Solutions, Inc. (SWKS)
- Supply chain diversification aids resilience, but reliance on Asian manufacturing hubs remains a vulnerability.
6. ESG & Climate Transition
STMicroelectronics N.V. (STM)
- Faces pressure to reduce carbon footprint, especially in energy-intensive manufacturing segments.
Skyworks Solutions, Inc. (SWKS)
- Advances in energy-efficient products and strong ESG disclosures support climate transition positioning.
7. Geopolitical Exposure
STMicroelectronics N.V. (STM)
- Significant exposure to EU and Asia-Pacific trade policies; risks from regional conflicts persist.
Skyworks Solutions, Inc. (SWKS)
- US-based with global sales; geopolitical tensions and export regulations remain key risk factors.
Which company shows a better risk-adjusted profile?
Skyworks Solutions bears its risks with stronger profitability and balanced leverage, making its risk-adjusted profile more attractive. STMicroelectronics’ low returns and margin pressure highlight operational challenges. SWKS’s superior Altman Z-Score (4.34 vs. 4.03) and Piotroski Score (7 vs. 8) confirm its healthier financial footing. The critical risk for STM is its weak profitability undermining capital returns. For SWKS, geopolitical and supply chain dependencies pose the greatest threats. Recent financial ratios show SWKS’s better operational efficiency and dividend support, justifying my cautious preference.
Final Verdict: Which stock to choose?
STMicroelectronics (STM) stands out for its robust liquidity and strong balance sheet, offering a cash-rich foundation. Its superpower lies in operational resilience despite recent profitability challenges. However, investors should watch its declining returns on invested capital. STM suits portfolios aiming for value recovery with patience.
Skyworks Solutions (SWKS) boasts a strategic moat through high free cash flow yield and consistent operating margins. Its recurring revenue model and strong income quality provide relative safety versus STM’s volatility. SWKS fits well in balanced portfolios seeking moderate growth with income stability.
If you prioritize capital preservation with steady cash flow and a solid moat, Skyworks offers better stability and income potential. However, if you seek a turnaround opportunity with strong liquidity as a buffer, STMicroelectronics might outshine in a more aggressive, value-oriented strategy. Both carry risks given declining profitability trends.
Disclaimer: Investment carries a risk of loss of initial capital. The past performance is not a reliable indicator of future results. Be sure to understand risks before making an investment decision.
Go Further
I encourage you to read the complete analyses of STMicroelectronics N.V. and Skyworks Solutions, Inc. to enhance your investment decisions: