Home > Comparison > Technology > STM vs SLAB
The strategic rivalry between STMicroelectronics N.V. and Silicon Laboratories Inc. shapes the semiconductor sector’s evolution. STMicroelectronics operates as a diversified, capital-intensive manufacturer with broad product lines across automotive and industrial markets. In contrast, Silicon Laboratories focuses on high-margin, fabless mixed-signal solutions for IoT applications. This analysis weighs their contrasting models to identify which offers superior risk-adjusted returns for a diversified portfolio navigating ongoing technological transformation.
Table of contents
Companies Overview
STMicroelectronics and Silicon Laboratories stand as influential players shaping the semiconductor landscape globally.
STMicroelectronics: Global Semiconductor Powerhouse
STMicroelectronics dominates the semiconductor market with a diversified product portfolio spanning automotive ICs, analog and digital ICs, and MEMS sensors. Its core revenue engine lies in delivering integrated circuits across automotive, industrial, and consumer markets. In 2026, the company emphasizes innovation in power electronics and sensor integration to strengthen its competitive advantage in automotive and industrial sectors.
Silicon Laboratories: Mixed-Signal Innovator for IoT
Silicon Laboratories excels as a fabless semiconductor company specializing in analog-intensive mixed-signal solutions. Its revenue model focuses on wireless microcontrollers and sensor products tailored for IoT applications like smart homes, industrial automation, and medical devices. The firm’s 2026 strategy centers on expanding IoT market penetration and enhancing wireless connectivity solutions, underpinning its market position in connected device technologies.
Strategic Collision: Similarities & Divergences
STMicroelectronics pursues a broad product diversification with a closed ecosystem approach, while Silicon Laboratories opts for a fabless, specialized mixed-signal strategy. Both battle fiercely in the IoT and industrial automation markets, but their business philosophies diverge: STM integrates manufacturing and R&D internally, SLAB leverages agile fabless innovation. Their distinct investment profiles reflect STM’s scale and vertical control versus SLAB’s nimble focus on emerging IoT niches.
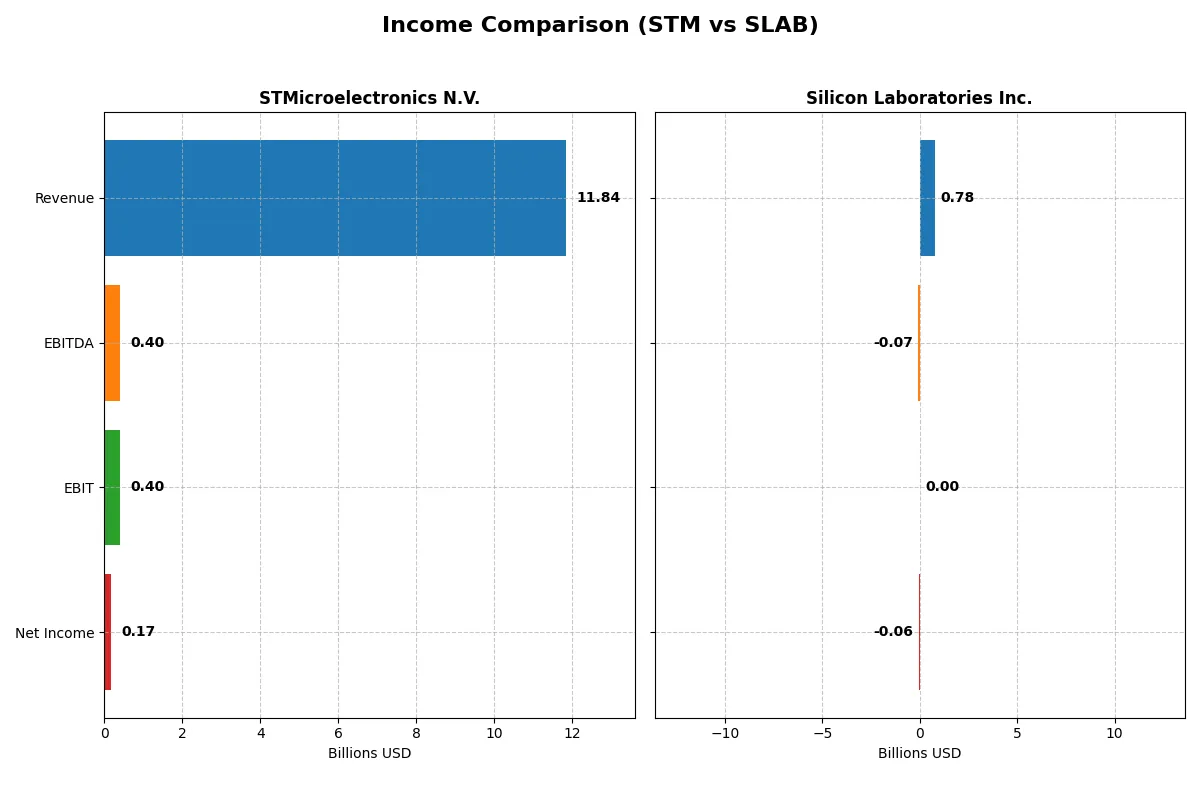
Income Statement Comparison
The following data dissects the core profitability and scalability of both corporate engines to reveal who dominates the bottom line:
| Metric | STMicroelectronics N.V. (STM) | Silicon Laboratories Inc. (SLAB) |
|---|---|---|
| Revenue | 11.8B | 785M |
| Cost of Revenue | 7.8B | 328M |
| Operating Expenses | 3.7B | 528M |
| Gross Profit | 4.0B | 457M |
| EBITDA | 401M | -71M |
| EBIT | 401M | 0 |
| Interest Expense | 0 | -975K |
| Net Income | 167M | -65M |
| EPS | 0.19 | -1.98 |
| Fiscal Year | 2025 | 2025 |
Income Statement Analysis: The Bottom-Line Duel
This income statement comparison reveals which company drives greater efficiency and profitability through its core operations and cost management.
STMicroelectronics N.V. Analysis
STMicroelectronics shows declining revenue, dropping from 17.3B in 2023 to 11.8B in 2025. Net income fell sharply from 4.2B to 167M over the same period, reflecting margin pressure. Its gross margin contracts from 48% to 34%, while net margin slips to just 1.4%, signaling weakening operational efficiency and profit momentum.
Silicon Laboratories Inc. Analysis
Silicon Laboratories grows revenue steadily, rising from 720M in 2021 to 785M in 2025. However, net income remains negative at -65M in 2025 despite a strong gross margin near 58%. Recent margin improvement contrasts with ongoing net losses, highlighting operational challenges despite top-line growth and enhanced cost control.
Margin Power vs. Revenue Scale
STMicroelectronics delivers massive scale but faces steep margin erosion and profit decline. Silicon Labs posts higher gross margins and accelerating revenue growth but struggles to convert top-line gains into profits. Investors prioritizing scale and established profitability may lean toward STM, while those focused on margin potential and growth might watch SLAB’s path cautiously.
Financial Ratios Comparison
These vital ratios act as a diagnostic tool to expose the underlying fiscal health, valuation premiums, and capital efficiency of each company:
| Ratios | STMicroelectronics N.V. (STM) | Silicon Laboratories Inc. (SLAB) |
|---|---|---|
| ROE | 0.0093 | 0 |
| ROIC | 0.0067 | 0 |
| P/E | 14.43 | -66.51 |
| P/B | 1.29 | 0 |
| Current Ratio | 3.11 | 0 |
| Quick Ratio | 2.37 | 0 |
| D/E | 0.18 | 0 |
| Debt-to-Assets | 0.13 | 0 |
| Interest Coverage | 19.72 | 72.35 |
| Asset Turnover | 0.54 | 0 |
| Fixed Asset Turnover | 1.22 | 0 |
| Payout ratio | 0.18 | 0 |
| Dividend yield | 1.28% | 0 |
| Fiscal Year | 2025 | 2025 |
Efficiency & Valuation Duel: The Vital Signs
Financial ratios act as a company’s DNA, revealing hidden risks and operational efficiency that surface beyond headline figures.
STMicroelectronics N.V.
STMicroelectronics posts weak profitability with ROE at 0.93% and net margin at 1.41%, indicating operational challenges. Its valuation metrics like P/E and P/B appear favorable, suggesting the stock is not stretched. The firm offers no dividend, instead prioritizing a strong reinvestment strategy with R&D spending around 15.7% of revenue, aiming for long-term growth.
Silicon Laboratories Inc.
Silicon Laboratories struggles with negative net margin (-8.27%) and zero returns on equity and invested capital, reflecting severe profitability issues. Despite a favorable P/E ratio, other ratios like current and quick ratios are lacking. The company pays no dividend and invests heavily in R&D (over 45% of revenue), signaling a focus on innovation and future expansion amid current losses.
Modest Valuation Meets Operational Strain
STMicroelectronics balances a reasonable valuation with weak profitability but sustains growth through R&D reinvestment. Silicon Laboratories shows more operational distress and lower financial health despite aggressive innovation spending. Investors seeking stability might lean toward STMicroelectronics, while those tolerating risk for potential growth may consider Silicon Laboratories.
Which one offers the Superior Shareholder Reward?
STMicroelectronics (STM) pays a modest dividend yield of 1.28% with a sustainable payout ratio near 18%, supported by positive free cash flow, despite a slight recent dip. STM also executes steady buybacks, reinforcing shareholder returns. Silicon Laboratories (SLAB) does not pay dividends but boasts strong free cash flow generation (2.01/share in 2025) and invests heavily in growth, though recent net losses signal risk. SLAB’s buyback activity is minimal, limiting direct shareholder returns. Historically, STM’s balanced dividend and buyback approach offers a more reliable total return profile in 2026, outperforming SLAB’s reinvestment strategy given SLAB’s profitability challenges. I conclude STM provides the superior shareholder reward today.
Comparative Score Analysis: The Strategic Profile
The radar chart reveals the fundamental DNA and trade-offs of STMicroelectronics and Silicon Laboratories, highlighting their financial strengths and vulnerabilities:
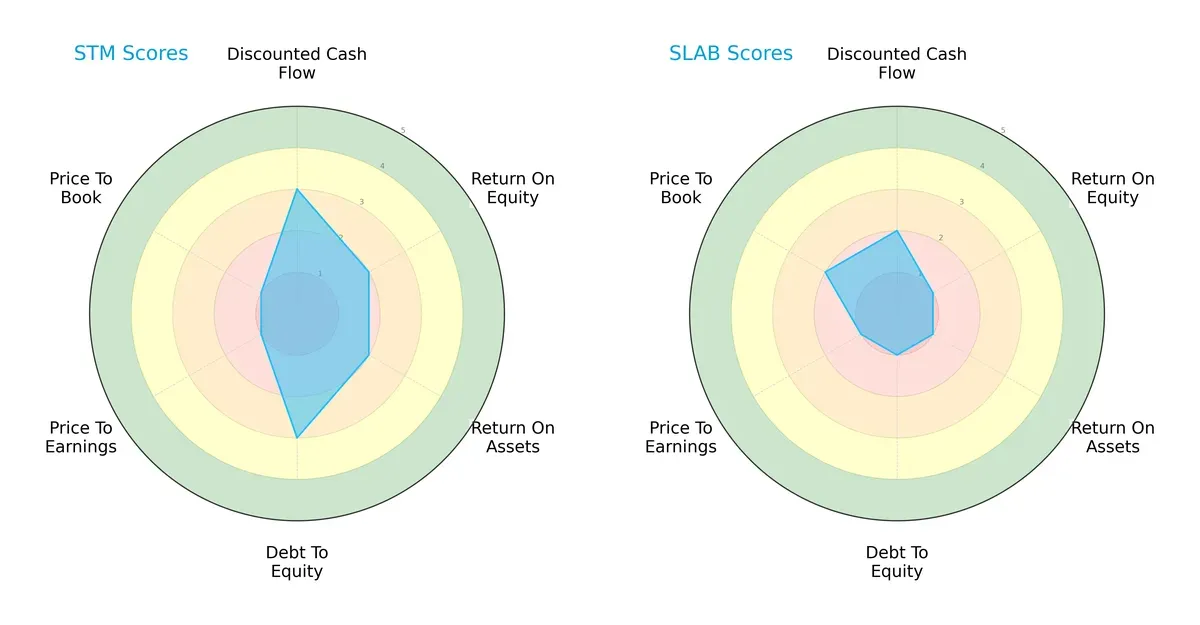
STMicroelectronics shows a more balanced profile with moderate scores in DCF (3), ROE (2), ROA (2), and Debt/Equity (3). Silicon Laboratories relies heavily on its Price-to-Book score (2) but lags significantly in profitability and leverage metrics, scoring mostly 1s. STM’s moderate leverage control contrasts SLAB’s higher financial risk, indicating STM’s steadier operational footing.
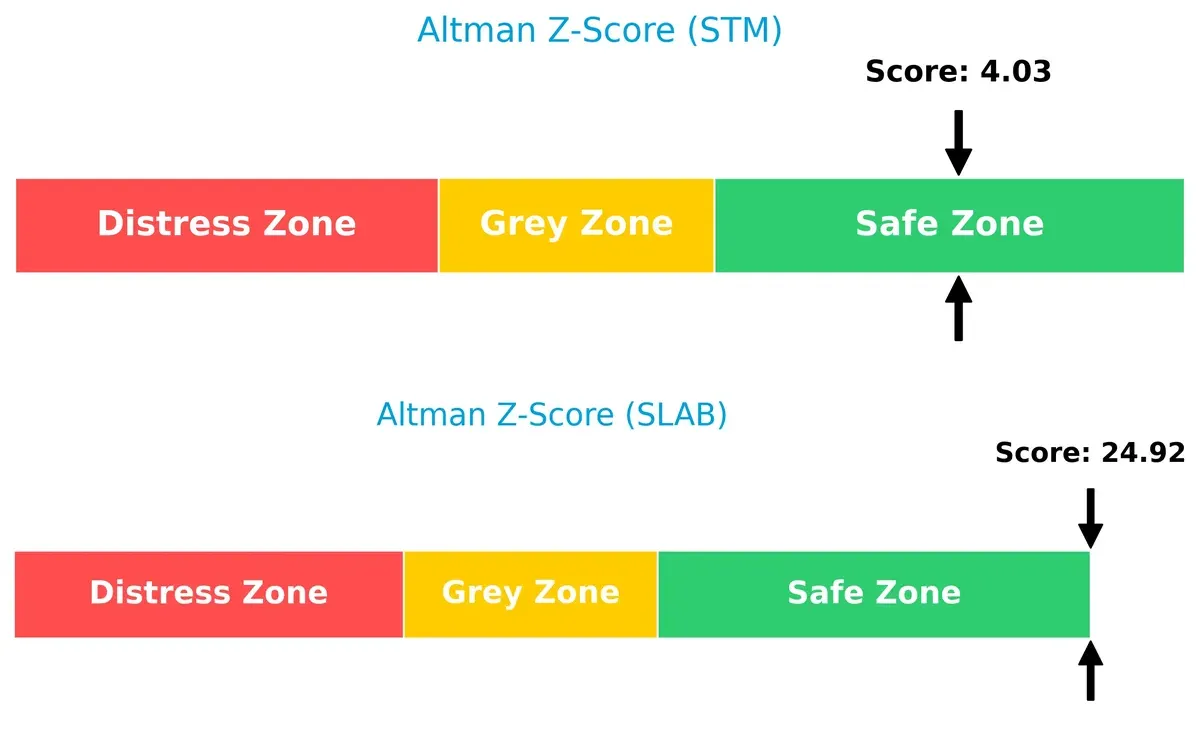
Bankruptcy Risk: Solvency Showdown
The Altman Z-Score delta highlights both firms firmly in the safe zone, but Silicon Laboratories’ exceptionally high 24.9 score signals rock-solid solvency, surpassing STMicroelectronics’ respectable 4.0:
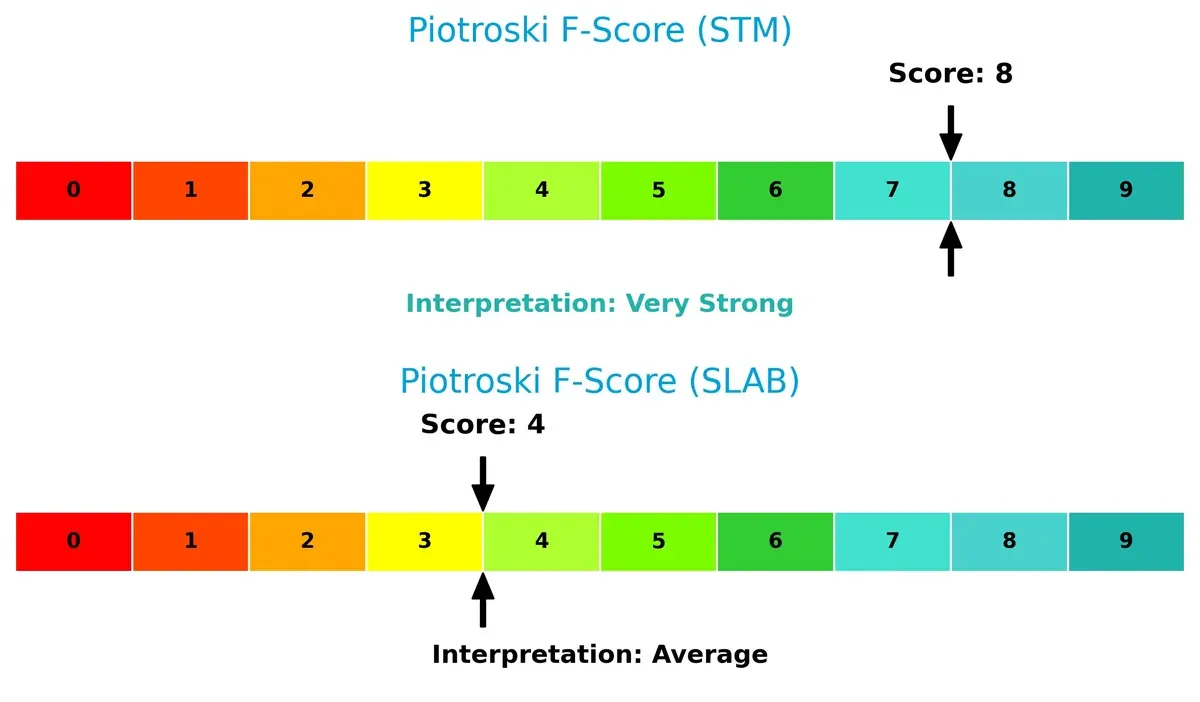
Financial Health: Quality of Operations
STMicroelectronics scores an impressive 8 on the Piotroski F-Score, reflecting very strong financial health. Silicon Laboratories’ 4 indicates average health and potential internal red flags:
How are the two companies positioned?
This section dissects the operational DNA of STM and SLAB by comparing their revenue distribution and internal dynamics. The goal is to confront their economic moats, revealing which model offers the most resilient competitive advantage today.
Revenue Segmentation: The Strategic Mix
This visual comparison dissects how STMicroelectronics and Silicon Laboratories diversify their income streams and where their primary sector bets lie:
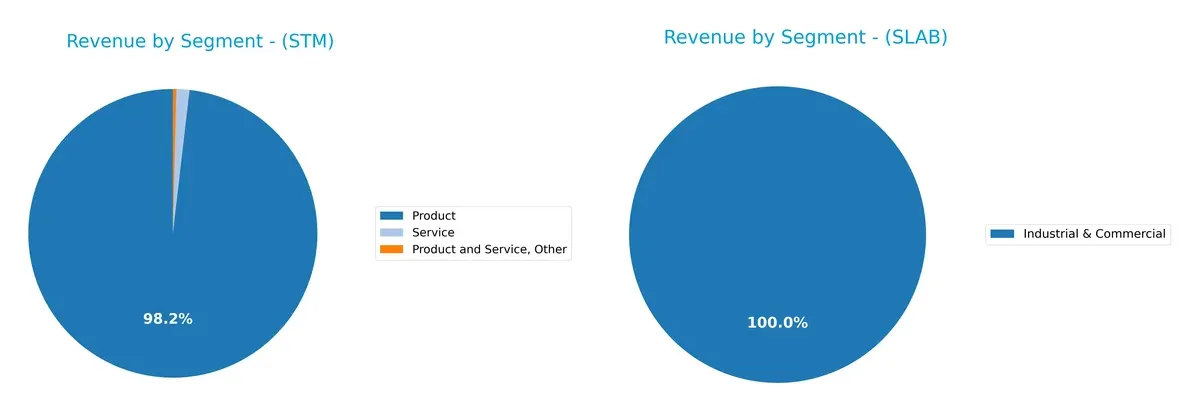
STMicroelectronics anchors its revenue with a dominant $13.2B product segment in 2024, supplemented modestly by $196M in services and $52M in other. Silicon Laboratories, by contrast, leans heavily on a single Industrial & Commercial segment at $339M, showing less diversification. STM’s broad product base reduces concentration risk, while SLAB’s focus exposes it to sector-specific volatility but may enable deeper ecosystem specialization.
Strengths and Weaknesses Comparison
This table compares the strengths and weaknesses of STMicroelectronics (STM) and Silicon Laboratories (SLAB):
STM Strengths
- Diverse product segments including automotive and microcontrollers
- Strong global presence in Asia, Americas, and Europe
- Favorable debt metrics with low leverage and high interest coverage
- Positive P/E and P/B ratios indicating market valuation confidence
SLAB Strengths
- Favorable P/E and P/B ratios suggest market valuation support
- Low debt levels with favorable debt-to-assets ratio
- Presence in growing industrial and commercial sectors
- Focus on IoT and infrastructure markets
STM Weaknesses
- Low profitability with unfavorable net margin, ROE, and ROIC
- Unfavorable asset turnover, indicating inefficiency
- Zero dividend yield
- High current ratio flagged as unfavorable, possible liquidity concerns
SLAB Weaknesses
- Negative net margin and zero ROE and ROIC point to profitability challenges
- Unavailable WACC and unfavorable liquidity ratios
- Negative interest coverage signals financial strain
- Zero dividend yield and weak asset turnover
STM’s strengths lie in its diversified product portfolio and solid global footprint, but profitability and efficiency remain concerns. SLAB faces more pronounced profitability and liquidity weaknesses despite favorable market valuations, impacting its operational resilience.
The Moat Duel: Analyzing Competitive Defensibility
A structural moat protects long-term profits from competitive erosion, serving as the ultimate defense against market pressures:
STMicroelectronics N.V.: Diverse Product Portfolio with Geographic Reach
STM’s moat stems from its broad semiconductor product range and global footprint. However, declining ROIC and shrinking margins signal weakening profitability. Expansion into automotive and sensor markets could deepen its moat if execution improves.
Silicon Laboratories Inc.: Niche Analog and Mixed-Signal Solutions
SLAB’s moat relies on specialized analog-intensive mixed-signal products serving IoT applications. Its strong gross margins and rapid revenue growth demonstrate effective market positioning. Continued innovation in IoT and industrial automation can expand this moat significantly.
Verdict: Product Breadth vs. Specialized Innovation
STM’s wide product and geographic diversity contrasts with SLAB’s focused niche dominance. Despite STM’s scale, its declining ROIC reveals a deteriorating moat. SLAB’s growing ROIC trend and robust margin expansion suggest a deeper moat and better market defense in 2026.
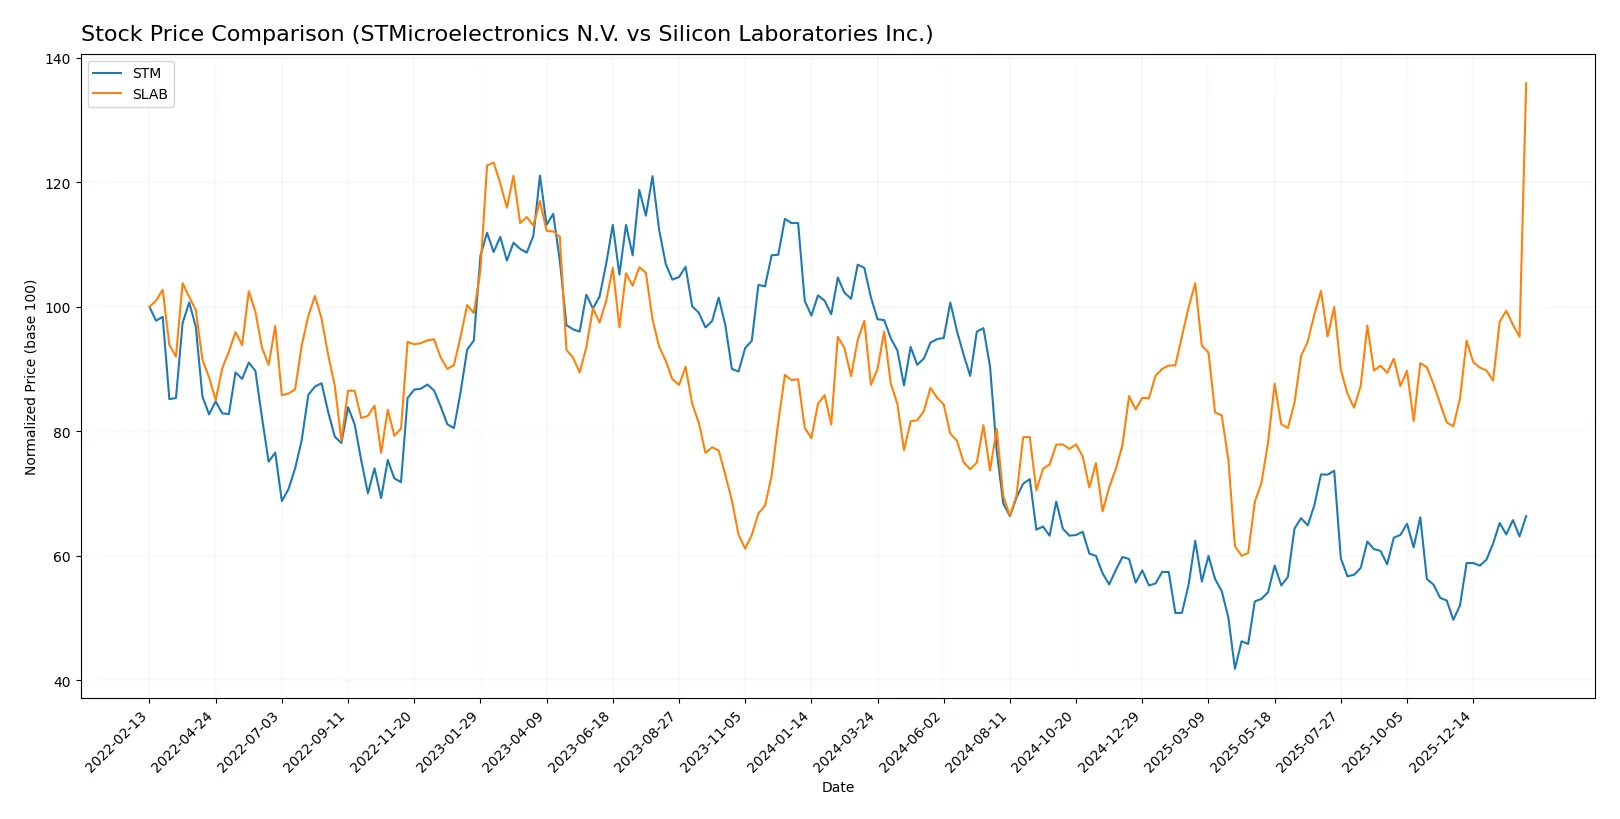
Which stock offers better returns?
Over the past 12 months, STMicroelectronics N.V. experienced a sharp decline with a notable recent rebound, while Silicon Laboratories Inc. showed sustained robust gains and accelerating momentum.
Trend Comparison
STMicroelectronics N.V. shows a 34.6% price drop over the past year, marking a bearish trend with accelerating decline. A recent 33.5% rally indicates a short-term recovery.
Silicon Laboratories Inc. gained 55.4% over the same period, maintaining a bullish trend with accelerating price increases and high volatility in recent months.
Silicon Laboratories clearly delivered stronger market performance than STMicroelectronics, with sustained gains versus ST’s overall decline despite its recent recovery.
Target Prices
Analyst consensus reveals promising upside potential for both STMicroelectronics N.V. and Silicon Laboratories Inc.
| Company | Target Low | Target High | Consensus |
|---|---|---|---|
| STMicroelectronics N.V. | 28 | 45 | 37.67 |
| Silicon Laboratories Inc. | 130 | 231 | 173.67 |
Analysts expect STMicroelectronics shares to appreciate around 28% from the current $29.33, while Silicon Laboratories shows a more aggressive target, suggesting nearly 15% upside from $203.41.

Don’t Let Luck Decide Your Entry Point
Optimize your entry points with our advanced ProRealTime indicators. You’ll get efficient buy signals with precise price targets for maximum performance. Start outperforming now!
How do institutions grade them?
STMicroelectronics N.V. Grades
Below are the recent institutional grades for STMicroelectronics N.V.:
| Grading Company | Action | New Grade | Date |
|---|---|---|---|
| TD Cowen | Maintain | Buy | 2025-10-24 |
| Susquehanna | Maintain | Positive | 2025-10-22 |
| Susquehanna | Maintain | Positive | 2025-07-25 |
| Baird | Upgrade | Outperform | 2025-07-22 |
| Susquehanna | Maintain | Positive | 2025-07-22 |
| Jefferies | Upgrade | Buy | 2025-02-19 |
| Bernstein | Downgrade | Market Perform | 2025-02-05 |
| Susquehanna | Maintain | Positive | 2025-01-31 |
| Barclays | Downgrade | Underweight | 2025-01-22 |
| JP Morgan | Downgrade | Neutral | 2024-12-09 |
Silicon Laboratories Inc. Grades
Here are the latest institutional grades for Silicon Laboratories Inc.:
| Grading Company | Action | New Grade | Date |
|---|---|---|---|
| Benchmark | Downgrade | Hold | 2026-02-04 |
| Keybanc | Downgrade | Sector Weight | 2026-02-04 |
| Needham | Downgrade | Hold | 2026-02-04 |
| Susquehanna | Maintain | Neutral | 2025-08-06 |
| Morgan Stanley | Maintain | Equal Weight | 2025-08-06 |
| Barclays | Maintain | Equal Weight | 2025-08-05 |
| Susquehanna | Maintain | Neutral | 2025-07-22 |
| Stifel | Maintain | Buy | 2025-07-18 |
| Keybanc | Maintain | Overweight | 2025-07-08 |
| Benchmark | Maintain | Buy | 2025-05-27 |
Which company has the best grades?
STMicroelectronics N.V. holds predominantly positive to buy ratings with some recent downgrades, while Silicon Laboratories Inc. shows multiple downgrades to hold or sector weight. This implies STMicroelectronics currently enjoys stronger institutional confidence, which may influence investor sentiment and stock momentum.
Risks specific to each company
The following categories identify the critical pressure points and systemic threats facing both firms in the 2026 market environment:
1. Market & Competition
STMicroelectronics N.V.
- Operates in highly competitive semiconductor markets with diversified product lines across automotive and industrial sectors.
Silicon Laboratories Inc.
- Faces intense competition in niche mixed-signal and IoT semiconductor markets, relying heavily on innovation and market adoption.
2. Capital Structure & Debt
STMicroelectronics N.V.
- Maintains low debt-to-equity (0.12) and strong interest coverage, indicating solid financial stability.
Silicon Laboratories Inc.
- Virtually no debt but negative interest coverage suggests operational losses and financial strain.
3. Stock Volatility
STMicroelectronics N.V.
- Beta of 1.32 reflects moderate volatility, aligned with semiconductor sector norms.
Silicon Laboratories Inc.
- Higher beta of 1.54 signals greater stock price fluctuations and risk exposure.
4. Regulatory & Legal
STMicroelectronics N.V.
- Global operations expose it to diverse regulatory regimes, especially in automotive and industrial certifications.
Silicon Laboratories Inc.
- US-based with significant international sales, faces increasing scrutiny on export controls and technology compliance.
5. Supply Chain & Operations
STMicroelectronics N.V.
- Complex global supply chain risks due to multi-region manufacturing and component sourcing.
Silicon Laboratories Inc.
- Fabless model reduces capital intensity but increases dependency on foundries, raising supply chain vulnerability.
6. ESG & Climate Transition
STMicroelectronics N.V.
- Larger firm with greater ESG disclosure obligations; pressure to align with EU climate goals.
Silicon Laboratories Inc.
- Smaller scale but growing ESG expectations from investors, with room to improve sustainability practices.
7. Geopolitical Exposure
STMicroelectronics N.V.
- High exposure to European, Asian, and US markets; geopolitical tensions could disrupt operations.
Silicon Laboratories Inc.
- Primarily US exposure but reliant on Chinese and global markets, vulnerable to trade restrictions.
Which company shows a better risk-adjusted profile?
STMicroelectronics faces competitive and operational complexities but demonstrates stronger financial resilience and lower leverage. Silicon Laboratories carries higher volatility and financial instability, amplified by losses and weaker liquidity. STM’s Altman Z-score (4.03) and Piotroski score (8) confirm robust financial health, while SLAB’s scores signal caution. The largest risk for STM lies in global supply chain disruptions. For SLAB, persistent negative margins and liquidity issues present the greatest threat. Overall, STMicroelectronics shows a superior risk-adjusted profile, justifying investor preference amid semiconductor sector uncertainties.
Final Verdict: Which stock to choose?
STMicroelectronics (STM) wields a robust cash conversion cycle and solid balance sheet, reflecting operational efficiency and liquidity strength. Its point of vigilance lies in declining profitability and value destruction signals. STM suits portfolios focused on resilient industrial play with moderate growth expectations.
Silicon Laboratories (SLAB) boasts a strategic moat through rapid revenue growth and heavy R&D investment, signaling innovation potential. Compared to STM, SLAB’s financial stability is weaker, carrying higher risk. It fits well in GARP portfolios aiming for transformative growth with tolerance for volatility.
If you prioritize operational stability and cash flow resilience, STM outshines as the more dependable choice despite recent earnings pressure. However, if you seek growth fueled by innovation and can absorb higher risk, SLAB offers superior upside potential with its accelerating top-line momentum.
Disclaimer: Investment carries a risk of loss of initial capital. The past performance is not a reliable indicator of future results. Be sure to understand risks before making an investment decision.
Go Further
I encourage you to read the complete analyses of STMicroelectronics N.V. and Silicon Laboratories Inc. to enhance your investment decisions: